Article
J. Braz. Chem. Soc., Vol. 23, No. 1, 85-95, 2012. Printed in Brazil - ©2012 Sociedade Brasileira de Química
0103 - 5053 $6.00+0.00
A
*e-mail: [email protected]
Advanced QSAR Studies on PPAR
δ
Ligands Related to Metabolic Diseases
Vinícius G. Maltarollo,a Danielle C. Silvaa and Káthia M. Honório*,a,b
aUniversidade Federal do ABC, Santo André-SP, Brazil
bEscola de Artes, Ciências e Humanidades, Universidade de São Paulo, São Paulo-SP, Brazil
PPARδ é um receptor nuclear que, quando ativado, regula o metabolismo de carboidratos e lipídios, e está relacionado com diversas enfermidades, tais como síndrome metabólica e diabetes tipo 2. Para entender as principais interações entre alguns ligantes bioativos e o receptor PPARδ, modelos de QSAR 2D e 3D foram obtidos e comparados com mapas de potencial eletrostático (MEP) e dos orbitais de fronteira (HOMO e LUMO), assim como resultados de docagem molecular. Os modelos de QSAR obtidos apresentaram bons resultados estatísticos e foram utilizados para predizer a atividade biológica de compostos do conjunto-teste (validação externa), e os valores preditos estão em concordância com os resultados experimentais. Além disso, todos mapas moleculares foram utilizados para avaliar as possíveis interações entre os ligantes e o receptor PPARδ. Portanto, os modelos de QSAR 2D e 3D, assim como os mapas de HOMO, LUMO e MEP, podem fornecer informações sobre as principais propriedades necessárias para o planejamento de novos ligantes do receptor PPARδ.
PPARδ is a nuclear receptor that, when activated, regulates the metabolism of carbohydrates and lipids and is related to metabolic syndrome and type 2 diabetes. To understand the main interactions between ligands and PPARδ, we have constructed 2D and 3D QSAR models and compared them with HOMO, LUMO and electrostatic potential maps of the compounds studied, as well as docking results. All QSAR models showed good statistical parameters and prediction outcomes. The QSAR models were used to predict the biological activity of an external test set, and the predicted values are in good agreement with the experimental results. Furthermore, we employed all maps to evaluate the possible interactions between the ligands and PPARδ. These predictive QSAR models, along with the HOMO, LUMO and MEP maps, can provide insights into the structural and chemical properties that are needed in the design of new PPARδ ligands that have improved biological activity and can be employed to treat metabolic diseases.
Keywords:diabetes mellitus, PPARδ, HQSAR, 3D-QSAR, quantum chemistry, molecular modeling
Introduction
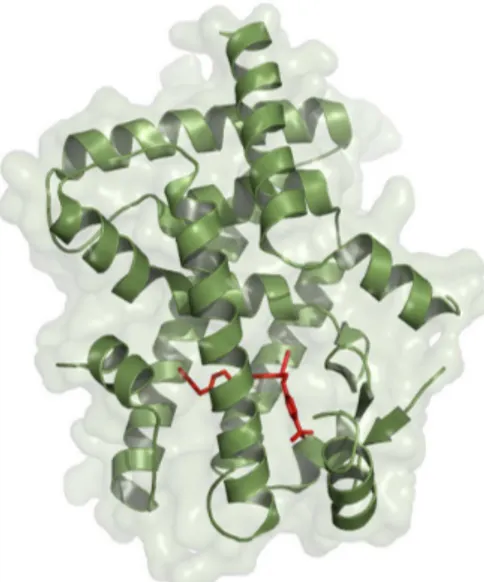
Peroxisome proliferator-activated receptor delta (PPARδ) is a nuclear receptor that, when activated by specific ligands, promotes the transcription of genes that control the metabolism of lipids and carbohydrates. These receptors are expressed in several types of tissues and cells, but are significantly found in the brain, cardiac and skeletal muscles, adipose tissue and skin. Natural ligands of PPARδ include fatty acids and eicosanoids.1-3 Figure 1 shows the structure
of PPARδ and an endogenous ligand in its active site. Some effects of PPARδ activation involve the decrease of glucose oxidation, the increase of lipid utilization into
the muscle tissues, insulin sensibility and oxidation of fatty acids. Based on these effects, substances that activate the PPARδ receptor can be used to treat two chronic diseases: type 2 diabetes mellitus (DM) and metabolic syndrome.4-7 DM is a disease of carbohydrate metabolism
that is related to hyperglycemia and insulin resistance.8-11
Metabolic syndrome is a disease of lipid metabolism and is consequently involved in obesity and insulin resistance. The two diseases can arise from similar causes, such as sedentary lifestyle, inadequate nutrition, genetics, and oxidative stress.6,12,13 In the 1990s, DM affected 4% of the
new safe and effective agents to treat DM and metabolic syndrome, and several authors have been studied PPAR as a potential target to treat these diseases.15-18
Structure and ligand-based approaches have been successfully employed in the development of new drugs. Two and three-dimensional quantitative structure-activity relationships (2D and 3D QSAR) and quantum chemical descriptors have been used to understand the main interactions between drugs and biological receptors, as well as in designing new classes of drugs for many diseases.19-27
Therefore, the main objective of this study is to construct reliable HQSAR, CoMFA and CoMSIA models and utilize them in combination with quantum chemical maps to understand the main interactions between a set of bioactive ligands and the PPARδ receptor.
Methodology
Data set
In general, PPAR ligands have a polar head (e.g., a COOH group), a linker group (e.g., a benzene ring−O−(CH2)2−) and a hydrophobic tail (see general
structure in Table 1). Our compound set consists of indanylacetic acid derivatives that have very similar structures to the generic model of PPAR ligands.28-32 From
the indanylacetic acid derivatives synthesized by Wickens et al.,29 we have selected 51 compounds to constitute the
entire data set. A training set was formed using 41 of the compounds, and the remaining 10 comprised the test set (external validation). The selection of training and test sets was based on cluster analyses, and the chemical diversity of the two sets is very significant.
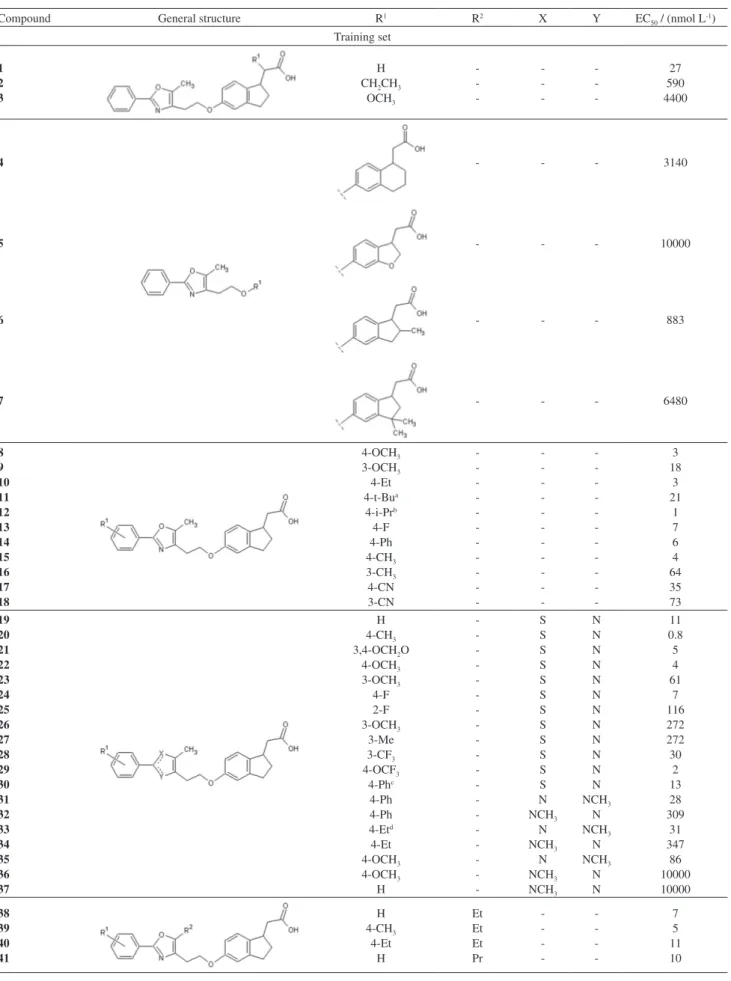
Table 1 displays the chemical structures and the values of biological activity (EC50) for all compounds
studied. These values were all measured under the same experimental conditions,29 converted to corresponding
pEC50 value (−log EC50) and used as dependent variables
in the QSAR analyses. Figure 2 displays the distribution of pEC50 values for the training and test sets.
Protein structure
To perform the molecular alignment of the data set, docking studies were necessary. We selected the protein structure from the Protein Data Bank (PDB) with regard to the characteristics that showed good correlation with the biological system. First, eight structures of PPARδ with the best resolution (≤ 2.40Å) were chosen; then, the RMS fit for all structures were calculated using the Pymol33 software.
The alignment error was 0.464Å, and Figure 3 shows the alignment of all protein structures selected.
The PPARδ structures did not show significant differences when compared with each other. Therefore, we have selected the protein structure with the PDB code 3GZ934
in order to perform the molecular alignment of the compound set. This PPARδ structure has the better resolution (2.00 Å), and its ligand is structurally similar to the compounds in our data set. The PPAR ligand binding domain has a polar pocket with three main amino acids (His323, His449 and Tyr473), as well as a Y shaped hydrophobic cavity.3,33,35,36
Before molecular alignment was performed on all the compound sets, redocking and crossdocking processes were carried out to validate the methodology selected. For the docking analyses, the crystallographic ligand and water molecules were removed and hydrogen atoms were added using the Biopolymer module, implemented in Sybyl 8.1.37
Some aminoacid residues in the binding site (e.g. histidine, glutamine and asparagines) were manually checked for possible flipped orientation, protonation, and tautomeric states using the Pymol 1.0 program (DeLano Scientific, San Carlos, USA). The docking process was flexible with respect to the ligands.
Figure 1. Structure of PPARδ and the natural ligand D32 (red). See
online for color image. Figure 2. Distribution of pEC50 values for the training, test and complete
Table 1. Structure of compounds studied and EC50 values
Compound General structure R1 R2 X Y EC
50 / (nmol L-1)
Training set
1 2 3
H CH2CH3
OCH3 -27 590 4400
4 - - - 3140
5 - - - 10000
6 - - - 883
7 - - - 6480
8 9 10 11 12 13 14 15 16 17 18 4-OCH3 3-OCH3 4-Et 4-t-Bua 4-i-Prb 4-F 4-Ph 4-CH3 3-CH3 4-CN 3-CN -3 18 3 21 1 7 6 4 64 35 73 19 20 21 22 23 24 25 26 27 28 29 30 31 32 33 34 35 36 37 H 4-CH3 3,4-OCH2O
Compound General structure R1 R2 X Y EC
50 / (nmol L-1)
Test set
42 CH3 - - - 120
43 44 45 46
H 3-F 3-Cl 4-Cl
-14 13 13 3
47 48 49 50
4-i-Pr 3-F 4-Cl H
-S S S N
N N N NCH3
5 47 1.5 257
51 H (CH2)2-Ph - - 10000
at-Bu = C(CH
3)3; bi-Pr = CH(CH3)3; cPh = C6H11; dEt = CH2CH3.
Table 1. continuation
Figure 3. Alignment of PPARδ structures with resolution ≤ 2.40Å from Protein Data Bank. (A) Backbone view of aligned structures; (B) aligned residues into the binding site. See online for color image.
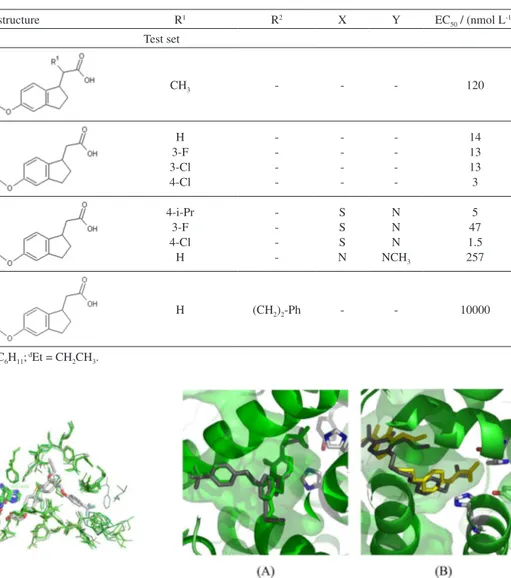
Redocking and crossdocking
Using Surflex docking implemented in Sybyl 8.1,37
we docked the natural ligand of PPARδ found in the 3GZ934 structure, called D32 or (2,3-dimethyl-4-phenyl]
sulfanyl} phenoxy) acetic acid. The redocking results were compared with the crystallographic structure of the ligand. The redocking process was also performed using the same receptor structure (3GZ9), but with the ligand from the 3D5F structure called L41 or (4-[3-(4-acetyl-3-hydroxy-2-propylphenoxy)propoxy] phenoxy) acetic acid. The results obtained from redocking and crossdocking are shown in Figure 4.
From Figure 4, we can observe that the selected methodology reproduces the geometries and the positioning of molecules into the binding site accurately. Therefore,
Surflex docking can be used to dock all compound sets to create reliable 3D QSAR models.
2D and 3D QSAR studies
All 2D and 3D QSAR analyses, calculations and visualizations were performed using the Sybyl 8.1 package (Tripos, St. Louis, USA), running on Linux workstations. The 2D QSAR analyses were performed using a specialized fragment-based method to develop a predictive quantitative structure-activity relationship. This method is known as hologram QSAR (HQSAR) and permits the visualization of the positive and negative contributions of each molecular fragment to the biological activity. The HQSAR models can be affected by a number of parameters concerning hologram generation, such as hologram length,
Figure 4. (A) Redocking and (B) crossdocking results. Both
fragment size and fragment distinction. Initially, each molecule in the data set was energetically minimized by the Tripos force field; the Gasteiger-Huckel charges were calculated and the molecular holograms were generated using the standard parameters implemented in Sybyl 8.1.
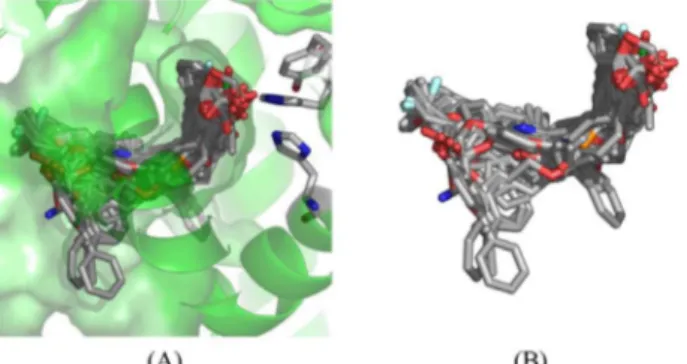
Comparative molecular field analysis (CoMFA) and comparative molecular similarity indices analysis (CoMSIA) are two methods based on molecular force fields that reproduce some interactions between ligands and their biological receptors. In combination with HQSAR maps, 3D QSAR results can show a complete understanding of electrostatic, stereochemical, hydrophobic, and H-bond donor and acceptor features of bioactive ligands. Structural alignment is an important parameter in developing reliable 3D QSAR models, and in this case, we have employed a docking methodology to align all the compounds of the data set. For this, we used the Surflex module of Sybyl 8.1 (scoring function: ChemScore)37 on the PPARδ
structure with PDB code 3GZ9. Figure 5 displays the molecular alignment of the compound set obtained from this methodology.
After aligning all compounds in the PPARδ structure, we have constructed several models based on CoMFA and CoMSIA. Initially, we calculated the atomic charges using the PM3 method,38,39 implemented in the MOPAC package,
as this method contains many of the same AM1 parameters, but these ones were derived more systematically.40 These
CoMFA models were based on the relationship between the values of biological activity and the values of the force fields based on the stereochemical (according to Lennard-Jones potential) and electrostatic (Coulomb potential) interactions. All CoMFA and CoMSIA models were investigated using full leave-one-out cross-validation (q2) and no validation (r2)
methods, as well as CoMFA and CoMSIA standard options for variable scaling. The values of pEC50 were used as the
dependent variable in all QSAR analyses.
For CoMSIA analyses, stereochemical, electrostatic, hydrophobic, H bond acceptor and H bond donor
similarity indices were evaluated using the standard indices implemented in Sybyl 8.1. A CoMFA and CoMSIA region focusing method was applied to increase the resolution of the 3D QSAR models. The statistical evaluation for the CoMSIA analyses was performed in the same way as described for CoMFA.
Quantum chemical maps
Based on previous QSAR studies41-44 using quantum
chemical descriptors, we can note that the energy of the lowest unoccupied molecular orbital (LUMO), the charge of a carbon atom and the value of the dipole moment of a class of PPARδ ligands are important properties in describing the biological activity. Therefore, we decided to calculate the HOMO, LUMO and ESP (electrostatic surface potential) maps for some of the compounds studied. The calculations were performed with the DFT method implemented in the Gaussian09 software,45 using the B3LYP46,47 functional and
DGDZVP48,49 basis sets, since this functional is appropriated
for organic molecules and this set of functional and basis set was employed in a previous study, providing good results when compared to crystallographic data.50
Results and Discussion
HQSAR analyses
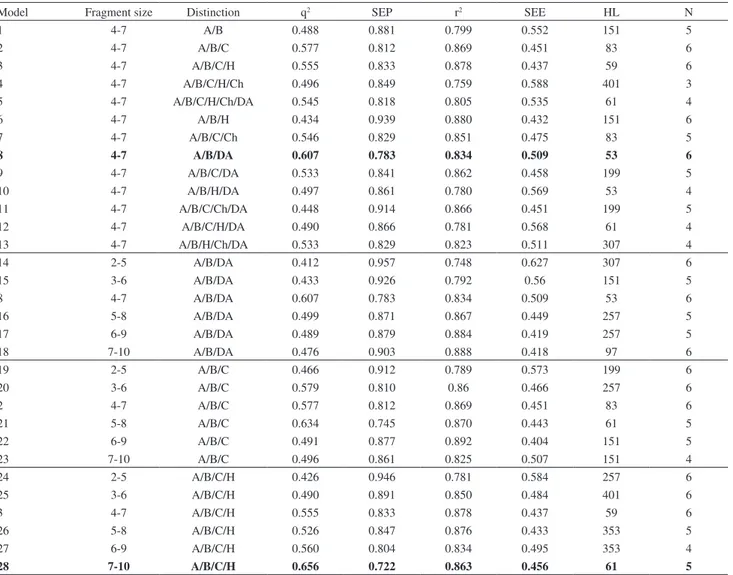
The first 2D QSAR analyses employed several combinations of molecular parameters, such as the screening of the 12 default series of hologram length (ranging from 53 to 401 bins), fragment distinction (atoms, bonds, connections, hydrogen atoms, chirality, donor and acceptor atoms) and fragment size. All results from the PLS analyses, using several fragment distinction combinations and different fragment sizes, are displayed in Table 2.
Analyzing the results from Table 2 using the default fragment size (4-7), we can observe that the models 2, 3 and 8 have presented the best statistical parameters. Afterwards, we varied the fragment size for the three models selected in order to assess the influence of the length of the fragments to be included in the hologram fingerprint. From Table 2, we can see that the best statistical results among all models were obtained for model 28 (r2 = 0.863 and q2 = 0.656).
This model was derived using a combination of A, B, C and H, with 5 being the optimum number of PLS components with a fragment size of 7-10. It is interesting to note that the best model contains hydrogen atoms as the fragment distinction, indicating the importance of possible hydrogen bonds between the ligands and the binding site of the biological receptor.
Figure 5. Molecular alignment of all compounds studied. See online
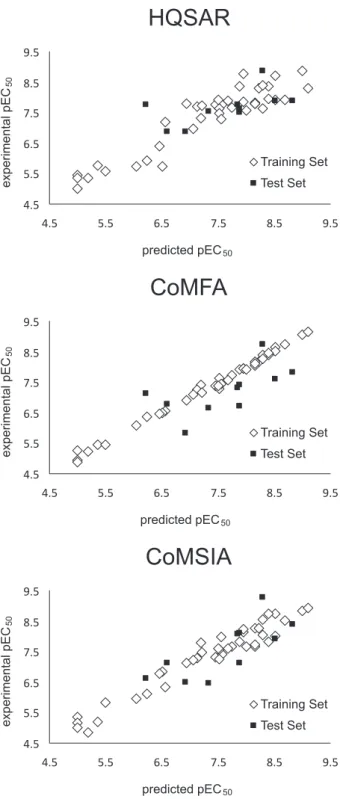
After the HQSAR model construction, the next step was employing an external validation process, in which the compounds in the test set were completely excluded during the training of the model, and the best model generated was used to predict the values of the biological property of the new compounds. Thus, the predictive power of the best HQSAR model (derived using the molecules from the training set; fragment distinction A/B/C/H; fragment size 7-10, Table 2) was assessed by predicting the pEC50 values
for the test set (42-51, Table 1). The prediction results are
listed in Table S1 (Supplementary Information) and Figure 6. It is possible to see that the test set compounds, which represent the different structural features incorporated within the training set, were well predicted by the best HQSAR model. From the low residual values, we can say that the HQSAR model obtained is robust and can be used in further medicinal chemistry studies.
3D QSAR analyses
After several analyses, the best CoMFA model was obtained by a focusing process using a weight of 0.5 and a distance of 1.0. This model shows q2 = 0.714 and
r2 = 0.993, with steric and electrostatic proportions of 34%
and 66%, respectively. Table S2 displays the statistical results from all CoMFA analyses. It is interesting to note that the electrostatic contribution for the CoMFA model is more important than the contributions from the steric data. This fact indicates that electrostatic interactions (e.g., hydrogen bonds) are important in describing and improving biological activity. According to experimental evidence, PPARδ has a polar cavity with 3 main amino acids (His323, His449 and Tyr473) to which activating ligands must bind.3 Therefore, the electrostatic forces are
more important than the steric ones because of the large
Table 2. HQSAR results using several fragment distinction combinations and fragment sizes
Model Fragment size Distinction q2 SEP r2 SEE HL N
1 4-7 A/B 0.488 0.881 0.799 0.552 151 5
2 4-7 A/B/C 0.577 0.812 0.869 0.451 83 6
3 4-7 A/B/C/H 0.555 0.833 0.878 0.437 59 6
4 4-7 A/B/C/H/Ch 0.496 0.849 0.759 0.588 401 3
5 4-7 A/B/C/H/Ch/DA 0.545 0.818 0.805 0.535 61 4
6 4-7 A/B/H 0.434 0.939 0.880 0.432 151 6
7 4-7 A/B/C/Ch 0.546 0.829 0.851 0.475 83 5
8 4-7 A/B/DA 0.607 0.783 0.834 0.509 53 6
9 4-7 A/B/C/DA 0.533 0.841 0.862 0.458 199 5
10 4-7 A/B/H/DA 0.497 0.861 0.780 0.569 53 4
11 4-7 A/B/C/Ch/DA 0.448 0.914 0.866 0.451 199 5
12 4-7 A/B/C/H/DA 0.490 0.866 0.781 0.568 61 4
13 4-7 A/B/H/Ch/DA 0.533 0.829 0.823 0.511 307 4
14 2-5 A/B/DA 0.412 0.957 0.748 0.627 307 6
15 3-6 A/B/DA 0.433 0.926 0.792 0.56 151 5
8 4-7 A/B/DA 0.607 0.783 0.834 0.509 53 6
16 5-8 A/B/DA 0.499 0.871 0.867 0.449 257 5
17 6-9 A/B/DA 0.489 0.879 0.884 0.419 257 5
18 7-10 A/B/DA 0.476 0.903 0.888 0.418 97 6
19 2-5 A/B/C 0.466 0.912 0.789 0.573 199 6
20 3-6 A/B/C 0.579 0.810 0.86 0.466 257 6
2 4-7 A/B/C 0.577 0.812 0.869 0.451 83 6
21 5-8 A/B/C 0.634 0.745 0.870 0.443 61 5
22 6-9 A/B/C 0.491 0.877 0.892 0.404 151 5
23 7-10 A/B/C 0.496 0.861 0.825 0.507 151 4
24 2-5 A/B/C/H 0.426 0.946 0.781 0.584 257 6
25 3-6 A/B/C/H 0.490 0.891 0.850 0.484 401 6
3 4-7 A/B/C/H 0.555 0.833 0.878 0.437 59 6
26 5-8 A/B/C/H 0.526 0.847 0.876 0.433 353 5
27 6-9 A/B/C/H 0.560 0.804 0.834 0.495 353 4
28 7-10 A/B/C/H 0.656 0.722 0.863 0.456 61 5
q2
LOO, leave-on-out cross-validated correlation coefficient; SEP, cross-validated standard error; r2, validated correlation coefficient; SEE,
size of the active site. In theory, many molecules can bind to the site in many positions.
Next, for the CoMFA model construction, we employed the compounds from the test set (42-51, Table 1) in order to
validate this model. The prediction results are listed in Table S1 and Figure 6. The analysis of the outcomes showed that the compounds in the test set were well predicted by the
best CoMFA model, indicating that this model has a high predictive power and can be used to obtain the interaction fields of new compounds.
To construct the CoMSIA model, we calculated several molecular fields (steric-S, electrostatic-E, hydrophobic-H, H-bond acceptor-A and donor-D) without using the focusing option, and the results are summarized in Table S3. From the best initial model (model 8, q2 = 0.229) based on
electrostatic and hydrophobic contributions, we employed the region focusing method to improve the predictive power of the model. The main results obtained after the focusing are shown in Table S4; it can be seen that the best CoMSIA model (q2 = 0.620 and r2 = 0.941) is composed
by electrostatic and hydrophobic fields (60.9 and 39.1%, respectively) and was obtained by a focusing process with a weight of 0.5 and a distance of 1.5. It is interesting to note that this model, as well as CoMFA one, has high electrostatic contribution. Furthermore, hydrophobic interactions are also important. PPARδ has a large active site that presents a small cavity with polar character; however, the other amino acids of the active site can participate in hydrophobic interactions. Therefore, the polar cavity is responsible for activating the receptor, and the hydrophobic pocket is responsible for stabilizing the ligands in the binding site. Because the polar interactions (e.g., hydrogen bonds) involve high energy, when compared to the hydrophobic interactions (e.g., van der Waals), it is expected that electrostatic effects have a high proportion on the obtained CoMSIA model.
Next, we used the compounds from the test set (42-51,
Table 1) to validate the generated CoMSIA model, and the prediction results are listed in Table S1 and Figure 6. After analyzing the outcomes, it was possible to conclude that the compounds from the test set were well predicted by the best CoMSIA model, indicating that this model is robust and can be used to plan new compounds.
Physicochemical discussion
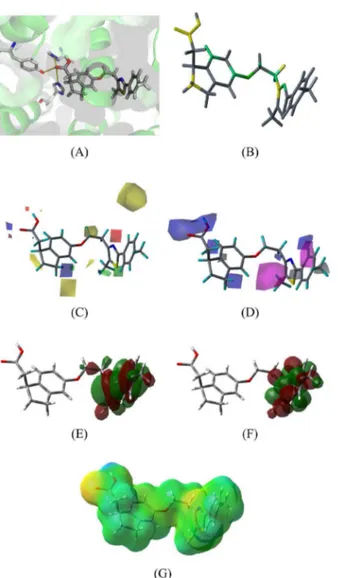
After the construction of 2D and 3D QSAR models, we performed theoretical calculations of some molecular properties, such as the maps of molecular orbitals (highest occupied molecular orbital - HOMO and lowest unoccupied molecular orbital - LUMO) and electrostatic surface potential (ESP), and correlated them to the 2D and 3D contribution maps obtained from the HQSAR, CoMFA and CoMSIA models. Figures 7 and 8 show all contribution maps obtained for the most (20) and the least potent (36)
compounds, respectively.
From Figures 7(A) and 8(A), we can observe that both molecules display polar contacts with the three main
Figure 6. Plots of experimental versus predicted pEC50 using HQSAR,
polar amino acids (His323, His449 and Tyr473), shown in yellow dotted lines. From the other maps calculated, we can note the following findings: (i) HQSAR maps show positive (green and yellow) and negative (orange and red) contributions. The central N atom from the five-atom ring contributes positively in both compounds. For the HQSAR map of compound 20 (the most potent), the COOH group
shows a positive contribution, indicating the importance of polar contacts to biological activity. For the 2D map of compound 36 (the less potent), the benzene ring and
o-methyl terminal group show a negative contribution. This may possibly be related to their steric hindrance. (ii) In our previous HQSAR study,22 we have noted that
polar groups linked to hydrophobic groups (m-methyl anthranilic acid) have influence on PPARδ affinity, but this can be improved using small polar groups. The most potent compound of previous study has pEC50 = 7.9 and
the most potent compound of this work (compound 20)
has pEC50 = 8.3. Therefore, this outcome corroborates
our HQSAR study. (iii) CoMFA electrostatic maps show positive (blue) and negative (red) contributions; CoMFA steric maps display positive (green) and negative (yellow) contributions. Analyzing the CoMFA maps for the least potent compound (36), it is possible to observe that the
steric contributions confirm the negative influence of the benzene ring and o-methyl group for biological activity. Therefore, this confirmed the HQSAR evidence for the negative contribution of these groups. The steric hindrance of these groups can possibly block the polar groups from approaching polar residues. From the docking of compound
36, we can note that the COOH group is more distant
from the polar residues than the polar group of compound
20. Furthermore, the COOH group in both molecules
has a positive electrostatic contribution, indicating the importance of the polar contacts. The substitution of the N atom on the imidazole ring (compound 36) by the S
atom (compound 20) causes an increase in electrostatic
Figure 7. Contribution maps for the most potent compound (20). (A) molecule docked into the active site; (B) HQSAR, (C) CoMFA, (D) CoMSIA, (E) HOMO, (F) LUMO and (G) ESP maps. See online for color image.
Figure 8. Contribution maps for the least potent compound (36). (A)
contribution, demonstrating the role of electronegative atoms in this position in improving the biological activity. (iv) CoMSIA maps show the same color systems as the electrostatic contributions used in the CoMFA analysis. Hydrophobic positive contributions are represented in white and negative contributions represented in magenta. For the most potent compound (20), the benzene and
methyl groups have positive hydrophobic contributions to the biological activity. Both molecules have a negative hydrophobic contribution in regards to the linker region [−O−(CH2)2−] and a positive electrostatic contribution to
the COOH region, which is in agreement to the HQSAR and CoMFA maps. (v) According Huang et al.,51 we note that polar groups (consequently, hydrogen bond donors and acceptors) as COOH head are important to PPARδ affinity. Huang et al.51 have performed a tridimensional
QSAR based on ligand alignment and they have obtained very similar results of electrostatic properties. So, in order to develop new PPARδ modulators, it is important to keep a COOH group or to use a bioisosterism technique to preserve electrostatic requirements. (vi) After analysis of the HOMO maps, we observe no difference among the compounds studied. However, the LUMO maps indicate a significant variation in the atomic contributions for this orbital, which can explain the differences in biological activity. For the most potent compound (20), the main
atomic LUMO contributions are located at hydrophobic tail while the least potent compound (36) has the main LUMO
contribution located at the COOH group. Since this orbital (LUMO) indicates the capacity to accept electrons,52 we
can identify the possible sites involved in charge transfer reactions between the ligand and the protein. (vii) ESP maps show the charge distribution into the molecular surfaces. There is a large difference of charge among the two compounds mainly in the region of polar contacts (COOH group). Compound 20 has the most negative surface and
compound 36 has the most positive surface located at the
COOH group. This may represent a low ability to accept H-bond in this region.
PPARδ activation depends on specific interactions, and the main ones involve hydrogen bonds with polar residues. As the polar interactions are the most energetic, they can better stabilize the ligand-receptor complex. Therefore, regardless of which residues are involved in the polar contacts, it is important that these interactions are strong, as well as hydrophobic, in order to stabilize the ligand in the binding site, which can be realized by the hydrophobic tail and the linker group.
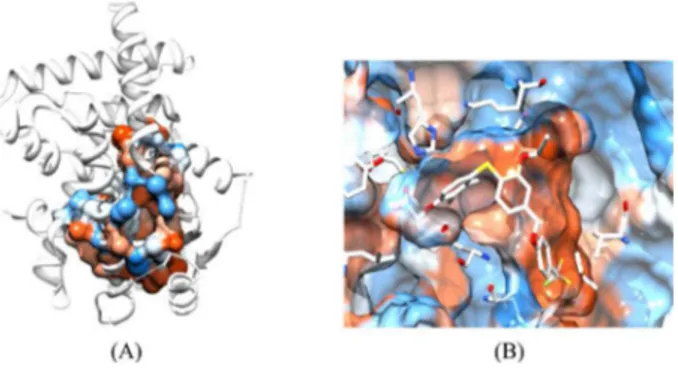
In order to obtain more detailed information on the main interactions into the binding site, we decided to calculate its volume and hydrophobic profile. The volume of the active
site was determined with FPocket package53,54 (available
on http://bioserv.rpbs.univ-paris-diderot.fr/fpocket/index. html) and Computed Atlas of Surface Topography of proteins (CASTp),55 available on http://sts.bioengr.uic.
edu/castp/index.php. The FPocket and CASTp packages provided a volume of 1896.2 Å3 and 1896.7 Å3, respectively.
This data indicates that the PPAR cavity is very large and can accommodate a large variety of ligands. From spheres generated by FPocket, we can plot the surface of active site colored by hydrophobic profile, by employing USFC Chimera program.56 Figure 9 shows the surface of binding
site, where blue color indicates polar areas and orange represents hydrophobic regions.
From Figure 9, it is possible to observe that the region near to COOH group of ligands (His323, His449 and Tyr473) has a polar surface and the entire cavity has a hydrophobic surface. In addition to QSAR studies, the results obtained from volume and hydrophobic profile of binding site provide an insight on the electrostatic and hydrophobic interactions with the main residues of the binding site, which are important to PPARδ activation.
Conclusions
The 2D and 3D QSAR models obtained in this work present good internal and external consistency (HQSAR: r2 = 0.863 and q2 = 0.656; CoMFA: q2 = 0.714 and
r2 = 0.993; CoMSIA: q2 = 0.620 and r2 = 0.941).Besides, an
external validation process has yielded a good correlation between experimental and predicted pEC50 values for the
test set compounds. Furthermore, CoMFA and CoMSIA maps as well as quantum chemical plots show a good physicochemical interpretation of the possible protein-ligand interactions. In addition to the generated maps, we can note the importance of the COOH group in the ligands with the polar contacts in the binding site and the influence of the linker group and the hydrophobic
Figure 9. (A) Cavity obtained from FPocket package; (B) binding site
tail used to stabilize the ligand in the active site. The presence of more electronegative atoms than nitrogen on the imidazole ring of hydrophobic tails increases the electrostatic positive contribution and significantly favors the biological activity. In order to obtain more detailed information on the main interactions into the binding site, we calculate its volume and hydrophobic profile, which indicate that the PPAR cavity is very large and can accommodate a large variety of ligands, as well as the entire cavity has a hydrophobic surface. From the findings of this study, we can conclude that the combination of QSAR studies with molecular modeling techniques is a powerful tool to propose molecular modifications in order to obtain new structural-based ligands for PPARδ, which can be used to treat diabetes, cardiovascular diseases and metabolic syndrome.
Supplementary Information
Supplementary data (Tables S1-S4) are available free of charge at http://jbcs.sbq.org.br, as PDF file.
Acknowledgments
The authors would like to thank FAPESP, CNPq and CAPES (Brazilian agencies) for their funding.
References
1. Berger, J.; Moller, D. E.; Annu. Rev. Med. 2002, 53, 409.
2. Robinson, E.; Grieve, D. J.; Pharmacol. Ther. 2009,122, 246. 3. Xu, H. E.; Lambert, M. H.; Montana, V. G.; Parks, D. J.;
Blanchard, S. G.; Brown, P. J.; Sternbach, D. D.; Lehmann, J. M.; Wisely, G. B.; Willson, T. M.; Kliewer, S. A.; Milburn, M. V.; Mol. Cell 1999,3, 397.
4. Miller, A. R.; Drug Dev. Res. 2006,67, 574.
5. Shi, Y.; Drug Discov. Today 2007,12, 440.
6. Cameron, A. J.; Shaw, J. E.; Zimmet, P. Z.; Endocrinol. Metab. Clin. 2004,33, 351.
7. Billin, A. N.; Expert Opin. Invest. Drugs 2008,17, 1465.
8. Patrick, J. B.; Am. J. Med. 2007,120, S12.
9. McLellan, K. C. P.; Barbalho, S. M.; Cattalini, M.; Lerario, A. M.; Rev. Nutr. 2007,20, 515.
10. Araújo, L. M. B.; Britto, M. M. D. S.; Porto da Cruz, T. R.; Arq. Bras. Endocrinol. Metab. 2000,44, 509.
11. Azevedo, A. P. D.; Papelbaum, M.; D’Elia, F.; Rev. Bras. Psiquiatr. 2002,24, 77.
12. Lombo, B.; Satizábal, C.; Villalobos, C.; Tique, C.; Kattah, W.; Acta Med. Colomb. 2007,32, 9.
13. Eckel, R. H.; Grundy, S. M.; Zimmet, P. Z.; Lancet 2005,365,
1415.
14. King, H.; Aubert, R. E.; Herman, W. H.; Diabetes Care 1998, 21, 1414.
15. Luquet, S.; Gaudel, C.; Holst, D.; Lopez-Soriano, J.; Jehl-Pietri, C.; Fredenrich, A.; Grimaldi, P. A.; BBA-Mol. Basis Dis. 2005,
1740, 313.
16. Fredenrich, A.; Grimaldi, P. A.; Diabetes Metab. 2005, 31, 23.
17. Gross, B.; Staels, B.; Best. Pract. Res. Cl. En. 2007, 21, 687. 18. Shearer, B. G.; Billin, A. N.; BBA-Mol. Cell Biol. L. 2007, 1771,
1082.
19. Honório, K. M.; Garratt, R. C.; Polikatpov, I.; Andricopulo, A. D.; J. Mol. Graphics Modell. 2007,25, 921.
20. Honório, K. M.; Garratt, R. C.; Polikatpov, I.; Andricopulo, A. D.; Lett. Drug Des. Discovery 2006,3, 261.
21. Da Silva, S. L.; Da Silva, A.; Honório, K. M.; Marangoni, S.; Toyama, M. H.; Da Silva, A. B. F.; THEOCHEM 2004,684, 1. 22. Garcia, T. S.; Honorio, K. M.; J. Braz. Chem. Soc. 2011, 22,
65.
23. Alves, C. N.; Pinheiro, J. C.; Camargo, A. J.; Ferreira, M. M. C.; Romero, R. A. F.; Da Silva, A. B. F.; THEOCHEM 2001, 541, 81.
24. Camargo, A. J.; Mercadante, R.; Honorio, K. M.; Alves, C. N.; Da Silva, A. B. F.; THEOCHEM 2002, 583, 105.
25. Molfetta, F. A.; Bruni, A. T.; Honorio, K. M.; Da Silva, A. B. F.; Eur. J. Med. Chem. 2005, 40, 329.
26. Alves, C. N.; Macedo, L. G. M.; Honorio, K. M.; Camargo, A. J.; Santos, L. S.; Jardim, I. N.; Barata, L. E. S.; Da Silva, A. B. F., J. Braz. Chem. Soc. 2002, 13, 300.
27. Calgarotto, A. K.; Miotto, S.; Honorio, K. M.; Da Silva, A. B. F.; Marangoni, S.; Silva, J. L.; Comar, M.; Oliveira, K. M. T.; da Silva, S. L.; THEOCHEM 2007, 808, 25.
28. Rudolph, J.; Chen, L.; Majumdar, D.; Bullock, W. H.; Burns, M.; Claus, T.; Dela Cruz, F. E.; Daly, M.; Ehrgott, F. J.; Johnson, J. S.; Livingston, J. N.; Schoenleber, R. W.; Shapiro, J.; Yang, L.; Tsutsumi, M.; Ma, X.; J. Med. Chem. 2007,50, 984.
29. Wickens, P.; Zhang, C.; Ma, X.; Zhao, Q.; Amatruda, J.; Bullock, W.; Burns, M.; Cantin, L. D.; Chuang, C. Y.; Claus, T.; Dai, M.; Dela Cruz, F.; Dickson, D.; Ehrgott, F. J.; Fan, D.; Heald, S.; Hentemann, M.; Iwuagwu, C. I.; Johnson, J. S.; Kumarasinghe, E.; Ladner, D.; Lavoie, R.; Liang, S.; Livingston, J. N.; Lowe, D.; Magnuson, S.; Mannelly, G.; Mugge, I.; Ogutu, H.; Pleasic-Williams, S.; Schoenleber, R. W.; Shapiro, J.; Shelekhin, T.; Sweet, L.; Town, C.; Tsutsumi, M.; Bioorg. Med. Chem. Lett.
2007,17, 4369.
30. Havranek, M.; Sauerberg, P.; Mogensen, J. P.; Kratina, P.; Jeppesen, C. B.; Pettersson, I.; Pihera, P.; Bioorg. Med. Chem. Lett. 2007,17, 4144.
D.; Potvain, F.; Poulain, G. R.; Ruault, C. C. B.; Saunders, M.; Toum, J. R. M.; Xu, H. E.; Xu, R. X.; Pianetti, P. M.; J. Med. Chem. 2007,50, 685.
32. Cantin, L. D.; Liang, S.; Ogutu, H.; Iwuagwu, C. I.; Boakye, K.; Bullock, W. H.; Burns, M.; Clark, R.; Claus, T.; dela Cruz, F. E.; Daly, M.; Ehrgott, F. J.; Johnson, J. S.; Keiper, C.; Livingston, J. N.; Schoenleber, R. W.; Shapiro, J.; Town, C.; Yang, L.; Tsutsumi, M.; Ma, X.; Bioorg. Med. Chem. Lett. 2007,17, 1056.
33. The PyMOL Molecular Graphics System, v0.99; DeLano Scientific LLC: South San Francisco, California, 2006. 34. Connors, R. V.; Wang, Z.; Harrison, M.; Zhang, A.; Wanska,
M.; Hiscock, S.; Fox, B.; Dore, M.; Labelle, M.; Sudom, A.; Johnstone, S.; Liu, J.; Walker, N. P. C.; Chai, A.; Siegler, K.; Li, Y.; Coward, P.; Bioorg. Med. Chem. Lett. 2009,19, 3550.
35. Nascimento, A. S.; Biochimie 2010, 92, 499.
36. Pochetti, G.; Godio, C.; Mitro, N.; Caruso, D.; Galmozzi, A.; Scurati, S.; Loiodice, F.; Fracchiolla, G.; Tortorella, P.; Laghezza, A.; Lavecchia, A.; Novellino, E.; Mazza, F.; Crestani, M.; J. Biol. Chem. 2007,282, 17314.
37. Sybyl 8.1; Tripos Inc.: St. Louis, MO, USA, 2008. 38. James, J. P. S.; J. Comput. Chem. 1989,10, 209. 39. James, J. P. S.; J. Comput. Chem. 1989,10, 221.
40. Gotwals, R. R.; Sendlinger, S. C.; A Chemistry Educator’s Guide to Molecular Modeling; The North Carolina School of Science and Mathematics: Durham, 2007.
41. Maltarollo, V. G.; Homem-de-Mello, P.; Honório, K. M.; J. Mol. Model. 2010, 16, 799.
42. Honorio, K. M.; da Silva, A. B. F.; J. Mol. Model. 2005, 11,
200.
43. Weber, K. C.; Honório, K. M.; Da Silva, S. L.; Mercadante, R.; Da Silva, A. B. F.; Int. J. Quantum Chem. 2005,103, 731. 44. Weber, K. C.; Honório, K. M.; Bruni, A. T.; Andricopulo, A.
D.; da Silva, A. B. F.; Struct. Chem. 2006,17, 307.
45. Frisch, M. J.; Trucks, G. W.; Schlegel, H. B.; Scuseria, G. E.; Robb, M. A.; Cheeseman, J. R.; Scalmani, G.; Barone, V.; Mennucci, B.; Petersson, G. A.; Nakatsuji, H.; Caricato, M.; Li, X.; Hratchian, H. P.; Izmaylov, A. F.; Bloino, J.; Zheng, G.; Sonnenberg, J. L.; Hada, M.; Ehara, M.; Toyota, K.; Fukuda, R.; Hasegawa, J.; Ishida, M.; Nakajima, T.; Honda,
Y.; Kitao, O.; Nakai, H.; Vreven, T.; Montgomery, Jr., J. A.; Peralta, J. E.; Ogliaro, F.; Bearpark, M.; Heyd, J. J.; Brothers, E.; Kudin, K. N.; Staroverov, V. N.; Kobayashi, R.; Normand, J.; Raghavachari, K.; Rendell, A.; Burant, J. C.; Iyengar, S. S.; Tomasi, J.; Cossi, M.; Rega, N.; Millam, N. J.; Klene, M.; Knox, J. E.; Cross, J. B.; Bakken, V.; Adamo, C.; Jaramillo, J.; Gomperts, R.; Stratmann, R. E.; Yazyev, O.; Austin, A. J.; Cammi, R.; Pomelli, C.; Ochterski, J. W.; Martin, R. L.; Morokuma, K.; Zakrzewski, V. G.; Voth, G. A.; Salvador, P.; Dannenberg, J. J.; Dapprich, S.; Daniels, A. D.; Farkas, Ö.; Foresman, J. B.; Ortiz, J. V.; Cioslowski, J.; Fox, D. J.; Gaussian 09, Revision, Gaussian, Inc.: Wallingford CT, 2009.
46. Becke, A. D.; J. Chem. Phys. 1993,98, 1372.
47. Lee, C.; Yang, W.; Parr, R. G.; Phys. Rev. B: Condens. Matter Mater. Phys. 1988,37, 785.
48. Sosa, C.; Andzelm, J.; Elkin, B. C.; Wimmer, E.; Dobbs, K. D.; Dixon, D. A.; J. Phys. Chem. 1992, 96, 6630.
49. Godbout, N.; Slahub, D. R.; Andzelm, J.; Wimmer, E.; Can. J. Chem. 1992, 70, 560.
50. Maltarollo, V. G.; Mello, P. H.; Honório, K. M.; J. Mol. Model.
2011, 17, 2549.
51. Huang, H.-J.; Lee, K.-J.; Yu, H. W.; Chen, H.-Y.; Tsai, F.-J.; Chen, C. Y.-C.; J. Biomol. Struc. Dyn. 2010, 28, 187. 52. Arroio, A.; Honório, K. M.; da Silva, A. B. F.; Quim. Nova
2010,33, 694.
53. Schmidtke, P.; Le Guilloux, V.; Maupetit, J.; Tuffery, P.; Nucleic Acids Res. 2010, 38, W582.
54. Le Guilloux, V.; Schmidtke, P.; Tuffery, P.; BMC Bioinformatics
2009, 10, 168.
55. Dundas, J.; Ouyang, Z.; Tseng, J.; Binkowski, A.; Turpaz, Y.; Liang, J.; Nucleic Acid Res. 2006, 34, W116.
56. Pettersen, E. F.; Goddard, T. D.; Huang, C. C.; Couch, G. S.; Greenblatt, D. M.; Meng, E. C.; Ferrin, T. E.; J. Comput. Chem.
2004, 13, 1605.
Submitted: April 5, 2011
Published online: October 20, 2011
Supplementary Information
Printed in Brazil - ©2012 Sociedade Brasileira de Química0103 - 5053 $6.00+0.00S
I
*e-mail: [email protected]
Advanced QSAR Studies on PPAR
δ
Ligands Related to Metabolic Diseases
Vinícius G. Maltarollo,a Danielle C. Silvaa and Káthia M. Honório*,a,b
aUniversidade Federal do ABC, Santo André-SP, Brazil
bEscola de Artes, Ciências e Humanidades, Universidade de São Paulo, São Paulo-SP, Brazil
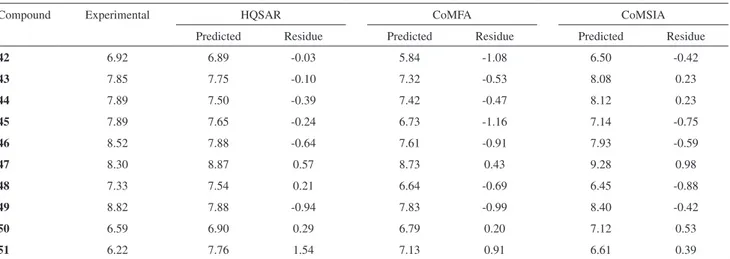
Table S1. Values of experimental and predicted pEC50 from HQSAR, CoMFA and CoMSIA models for test set
Compound Experimental HQSAR CoMFA CoMSIA
Predicted Residue Predicted Residue Predicted Residue
42 6.92 6.89 -0.03 5.84 -1.08 6.50 -0.42
43 7.85 7.75 -0.10 7.32 -0.53 8.08 0.23
44 7.89 7.50 -0.39 7.42 -0.47 8.12 0.23
45 7.89 7.65 -0.24 6.73 -1.16 7.14 -0.75
46 8.52 7.88 -0.64 7.61 -0.91 7.93 -0.59
47 8.30 8.87 0.57 8.73 0.43 9.28 0.98
48 7.33 7.54 0.21 6.64 -0.69 6.45 -0.88
49 8.82 7.88 -0.94 7.83 -0.99 8.40 -0.42
50 6.59 6.90 0.29 6.79 0.20 7.12 0.53
51 6.22 7.76 1.54 7.13 0.91 6.61 0.39
Table S2. Statistical results of the CoMFA analyses
no focus
w = 0.3 w = 0.5 w = 0.7 w = 0.9
d = 0.5 d = 1.0 d = 1.5 d = 0.5 d = 1.0 d = 1.5 d = 0.5 d = 1.0 d = 1.5 d = 0.5 d = 1.0 d = 1.5
LOO q2 0.104 0.109 0.495 0.467 0.450 0.714 0.427 0.16 0.521 0.163 0.107 0.265 -0.236
SEP 1.181 1.115 0.874 0.911 0.925 0.668 0.945 1.082 0.839 1.11 1.179 1.055 1.312
N 6 2 5 6 6 6 6 2 4 4 6 5 2
CV q2 0.046 0.221 0.541 0.419 0.484 0.747 0.339 0.242 0.553 -0.127 0.063 0.183 0.018
SEP 1.201 1.056 0.833 0.951 0.896 0.627 1.015 1.071 0.822 1.237 1.158 1.128 1.219
N 5 3 5 6 6 6 6 5 5 1 3 6 5
NV r2 0.982 0.983 0.991 0.988 0.992 0.993 0.909 0.949 0.979 0.768 0.816 0.773 0.496
SEE 0.168 0.160 0.119 0.136 0.114 0.103 0.376 0.283 0.180 0.601 0.535 0.595 0.886
S* 0.322 0.335 0.356 0.358 0.316 0.340 0.352 0.460 0.390 0.321 0.436 0.465 0.576 E* 0.678 0.665 0.644 0.642 0.684 0.660 0.648 0.540 0.610 0.679 0.564 0.535 0.424
*S (steric) and E (electrostatic) contribuiton. Region focusing was weighted by standard deviation coefficient values (w); cross-validated correlation coefficient (q2); cross-validated standard error (SEP); optimal number of components (N); noncross-validated correlation coefficient (r2); noncross-validated
Table S3. CoMSIA models using no focusing option
Model 1 2 3 4 5 6 7 8 9 10
S/E/H S/E/H/D S/E S/E/H/A S/E/H/D/A S/H S/H/D E/H E/H/A E/H/D
LOO q2 0.203 0.129 0.153 0.136 0.074 0.156 0.113 0.229 0.067 0.101
SEP 1.114 1.102 1.101 1.143 1.136 1.085 1.112 1.096 1.14 1.119
N 6 2 3 5 2 2 2 6 2 2
CV q2 0.16 0.185 0.154 0.121 0.032 0.224 0.107 0.261 0.12 0.063
SEP 1.068 1.066 1.086 1.107 1.161 1.04 1.116 1.073 1.107 1.142
N 1 2 2 2 2 2 2 6 2 2
NV r2 0.951 0.955 0.937 0.949 0.948 0.874 0.915 0.953 0.944 0.953
SEE 0.277 0.265 0.313 0.281 0.284 0.443 0.364 0.272 0.295 0.272
S 0.139 0.101 0.228 0.115 0.092 0.297 0.168 - -
-E 0.525 0.342 0.772 0.383 0.273 - - 0.603 0.431 0.389
H 0.336 0.240 - 0.258 0.197 0.703 0.365 0.397 0.299 0.276
D - 0.316 - - 0.253 - 0.467 - - 0.335
A - - - 0.244 0.185 - - - 0.270
-Cross-validated correlation coefficient (q2); cross-validated standard error (SEP); optimal number of components (N); noncross-validated correlation
coefficient (r2); noncross-validated standard error (SEE).
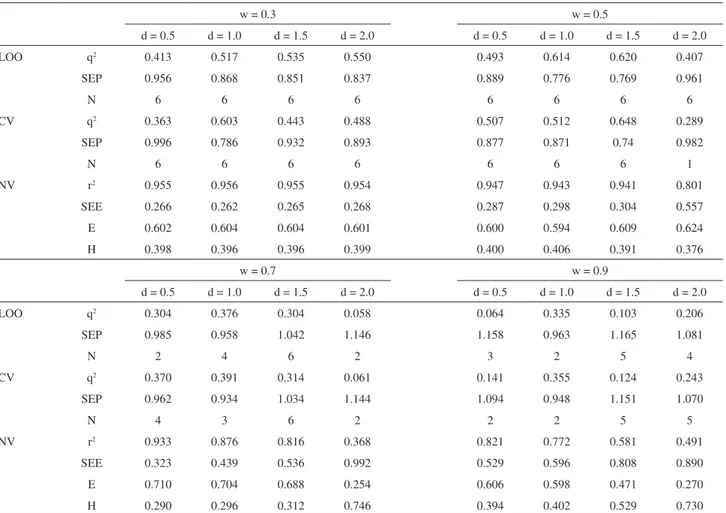
Table S4. Focused CoMSIA models based on electrostatic and hydrophobic fields
w = 0.3 w = 0.5
d = 0.5 d = 1.0 d = 1.5 d = 2.0 d = 0.5 d = 1.0 d = 1.5 d = 2.0
LOO q2 0.413 0.517 0.535 0.550 0.493 0.614 0.620 0.407
SEP 0.956 0.868 0.851 0.837 0.889 0.776 0.769 0.961
N 6 6 6 6 6 6 6 6
CV q2 0.363 0.603 0.443 0.488 0.507 0.512 0.648 0.289
SEP 0.996 0.786 0.932 0.893 0.877 0.871 0.74 0.982
N 6 6 6 6 6 6 6 1
NV r2 0.955 0.956 0.955 0.954 0.947 0.943 0.941 0.801
SEE 0.266 0.262 0.265 0.268 0.287 0.298 0.304 0.557
E 0.602 0.604 0.604 0.601 0.600 0.594 0.609 0.624
H 0.398 0.396 0.396 0.399 0.400 0.406 0.391 0.376
w = 0.7 w = 0.9
d = 0.5 d = 1.0 d = 1.5 d = 2.0 d = 0.5 d = 1.0 d = 1.5 d = 2.0
LOO q2 0.304 0.376 0.304 0.058 0.064 0.335 0.103 0.206
SEP 0.985 0.958 1.042 1.146 1.158 0.963 1.165 1.081
N 2 4 6 2 3 2 5 4
CV q2 0.370 0.391 0.314 0.061 0.141 0.355 0.124 0.243
SEP 0.962 0.934 1.034 1.144 1.094 0.948 1.151 1.070
N 4 3 6 2 2 2 5 5
NV r2 0.933 0.876 0.816 0.368 0.821 0.772 0.581 0.491
SEE 0.323 0.439 0.536 0.992 0.529 0.596 0.808 0.890
E 0.710 0.704 0.688 0.254 0.606 0.598 0.471 0.270
H 0.290 0.296 0.312 0.746 0.394 0.402 0.529 0.730
Region focusing was weighted by standard deviation coefficient values (w); cross-validated correlation coefficient (q2); cross-validated standard error