DWESD
5, 333–349, 2012Mississippi flood hazard in New
Orleans
T. L. A. Driessen and M. van Ledden
Title Page
Abstract Introduction
Conclusions References
Tables Figures
◭ ◮
◭ ◮
Back Close
Full Screen / Esc
Printer-friendly Version Interactive Discussion
Discussion
P
a
per
|
Dis
cussion
P
a
per
|
Discussion
P
a
per
|
Discussio
n
P
a
per
|
Drink. Water Eng. Sci. Discuss., 5, 333–349, 2012 www.drink-water-eng-sci-discuss.net/5/333/2012/ doi:10.5194/dwesd-5-333-2012
© Author(s) 2012. CC Attribution 3.0 License.
Drinking Water
Engineering and Science
Discussions
O
p
en
Acc
e
s
s
This discussion paper is/has been under review for the journal Drinking Water Engineering and Science (DWES). Please refer to the corresponding final paper in DWES if available.
The large-scale impact of climate change
to Mississippi flood hazard in New
Orleans
T. L. A. Driessen1and M. van Ledden2
1
Royal HaskoningDHV, Business Line Rivers, Deltas & Coasts, Nijmegen, The Netherlands
2
Royal HaskoningDHV, Business Line Rivers, Deltas & Coasts, Rotterdam, The Netherlands
Received: 1 June 2012 – Accepted: 16 June 2012 – Published: 5 July 2012
Correspondence to: T. L. A. Driessen ([email protected])
DWESD
5, 333–349, 2012Mississippi flood hazard in New
Orleans
T. L. A. Driessen and M. van Ledden
Title Page
Abstract Introduction
Conclusions References
Tables Figures
◭ ◮
◭ ◮
Back Close
Full Screen / Esc
Printer-friendly Version Interactive Discussion
Discussion
P
a
per
|
Dis
cussion
P
a
per
|
Discussion
P
a
per
|
Discussio
n
P
a
per
|
Abstract
The objective of this paper is to describe the impact of climate change on the Missis-sippi River flood hazard in the New Orleans area. This city has a unique flood risk man-agement challenge, heavily influenced by climate change, since it faces flood hazards from multiple geographical locations (e.g. Lake Pontchartrain and Mississippi River)
5
and multiple sources (hurricane, river, rainfall). Also the low elevation and significant subsidence rate of the Greater New Orleans area poses a high risk and challenges the water management of this urban area. Its vulnerability to flooding became dramati-cally apparent during Hurricane Katrina in 2005 with huge economic losses and a large number of casualties.
10
A SOBEK Rural 1DFLOW model was set up to simulate the general hydrodynamics. This improved model includes two important spillways that are operated during high flow conditions. Subsequently, a weighted multi-criteria calibration procedure was per-formed to calibrate the model for high flows. Validation for floods in 2011 indicates a very reasonable performance for high flows and clearly demonstrates the necessity of
15
the spillways.
32 different scenarios are defined which includes the relatively large sea level rise
and the changing discharge regime that is expected due to climate change. The impact of these scenarios is analysed by the hydrodynamic model. Results show that during
high flows New Orleans will not be affected by varying discharge regimes, since the
20
presence of the spillways ensures a constant discharge through the city. In contrary,
sea level rise is expected to push water levels upwards. The effect of sea level rise will
be noticeable even more than 470 km upstream. Climate change impacts necessitate a more frequent use of the spillways and opening strategies that are based on stages. Potential alternatives on how to cope with the flood hazard of this river in the long term,
25
DWESD
5, 333–349, 2012Mississippi flood hazard in New
Orleans
T. L. A. Driessen and M. van Ledden
Title Page
Abstract Introduction
Conclusions References
Tables Figures
◭ ◮
◭ ◮
Back Close
Full Screen / Esc
Printer-friendly Version Interactive Discussion
Discussion
P
a
per
|
Dis
cussion
P
a
per
|
Discussion
P
a
per
|
Discussio
n
P
a
per
|
1 Introduction
The Mississippi River has the third largest river basin of the world and drains, in all its greatness, 41 % of the United States. The flood risk of the Mississippi River imposed on urban areas, like Baton Rouge and New Orleans, became apparent during the great flood in 1927 which was the most destructive river flood in the history of the United
5
States (Barry, 1998). The river, discharging more than 85 000 m3s−1, caused levee
failures at numerous places, displaced over 600 000 people and flooded almost 70 000
km2causing damage for $ 400 million.
The devastating impact of hurricane Katrina in 2005 made the flood hazard and its social impact in deltaic urban areas even more apparent. The hurricane killed over 1800
10
people, caused ca. 245 000 inhabitants of New Orleans to migrate to other regions (Krupa, 2011) and had a total property damage estimate of $ 108 billion (Knabb et al., 2011).
Looking ahead, climate change is expected to affect the river discharge due to
al-terations in the water cycle. Ericson et al. (2006) found that the relative vulnerability
15
of the Mississippi delta, compared to 39 other deltas, is extreme and is demonstrated by the population potentially being displaced by current sea level trends to 2050. US-GCRP (2000) shows significant increases in the heaviest precipitation events and notes that changes in streamflow follow these changes in precipitation, but are amplified by about a factor three. Additionally, climate change induced sea level rise in
combina-20
tion with the local subsidence of the Mississippi River Delta causes the projected local
relative sea level rise in 50 yr to range between+0.5 m and+0.9 m for different rates
of sea level rise (USACE, 2009; NOAA, 2011). The uncertainty in these projections is large, since the local subsidence rates vary strongly throughout the delta. Altogether,
relative sea level rise is expected to affect river stages further upstream in the future.
25
DWESD
5, 333–349, 2012Mississippi flood hazard in New
Orleans
T. L. A. Driessen and M. van Ledden
Title Page
Abstract Introduction
Conclusions References
Tables Figures
◭ ◮
◭ ◮
Back Close
Full Screen / Esc
Printer-friendly Version Interactive Discussion
Discussion
P
a
per
|
Dis
cussion
P
a
per
|
Discussion
P
a
per
|
Discussio
n
P
a
per
|
In view of future changes there are various management challenges in the Missis-sippi River Delta to be dealt with in order to sustain the economic benefits for society, reduce the flood risk of urban areas, such as New Orleans, and to preserve the en-vironmental value of the wetlands. Many of these issues are interrelated which each other. As an example, the high river levees prevent the river overflowing into the
his-5
toric flood plains and therefore withhold fertile river sediment being deposited in the floodplains. This sediment starvation induces coastal marsh deterioration. Since the
1930s some 4900 km2 of coastal wetlands have already disappeared in the Gulf of
Mexico and this process continues at a rate of 65 km2 per year (Bourne Jr., 2004).
This process is enhanced by the strong subsidence in the area and increases the
po-10
tential for inundation (Nicholls, et al., 2007). Another water management challenge is more closely related to flood hazard in City of New Orleans. The Mississippi River lev-ees downstream of Baton Rouge, LA, do not have large floodplains to overflow when the bankfull discharge is exceeded. This results in a steep discharge-stage relation compared to a river system that has large floodplains available on the riverside of the
15
levees. Near New Orleans a river stage of+5.18 m above the North American Vertical
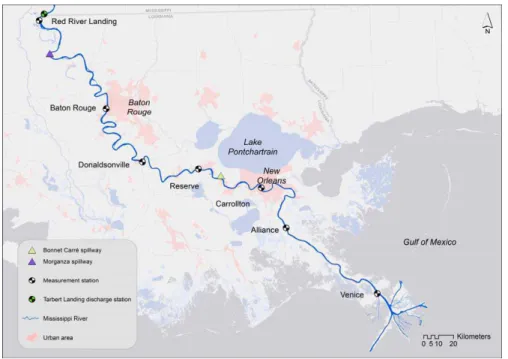
Datum of 1988 epoch 2004.65 (NAVD88) is used as the safe water elevation. In order to prevent exceedance of this river stage near New Orleans two important spillways have been constructed further upstream: the Bonnet Carre Spillway and the Morganza Spillway (see Fig. 1). The latter diverts water to the Atchafalya River basin which is
20
located to the west of the Mississippi River, and was opened for the second time in spring 2011. The question is how this system of levees and spillways can be adapted in view of future changes.
The objective of this article is to address the future changes in the Mississippi River stages in the context of climate change. For this purpose, a hydraulic model and an
25
DWESD
5, 333–349, 2012Mississippi flood hazard in New
Orleans
T. L. A. Driessen and M. van Ledden
Title Page
Abstract Introduction
Conclusions References
Tables Figures
◭ ◮
◭ ◮
Back Close
Full Screen / Esc
Printer-friendly Version Interactive Discussion
Discussion
P
a
per
|
Dis
cussion
P
a
per
|
Discussion
P
a
per
|
Discussio
n
P
a
per
|
2 Methods
2.1 Hydrodynamic model
An improved one-dimensional hydraulic model was set up to describe the general hy-drodynamics of the river and to simulate stages for the lower reach of the Mississippi River, which includes the cities Baton Rouge and New Orleans. This includes a model
5
of the last 492 km of the river before it enters the Gulf of Mexico (see Fig. 1). This model was subsequently used to perform a sensitivity analysis on the response of the river stage to climate change.
A HEC-RAS geometry is used that was provided by the Hydraulics and Hydrologic Branch of the US Army Corps of Engineers (USACE) New Orleans District and is based
10
on a survey done in 2002 and 2003. This geometry is imported in the SOBEK Rural Ad-vanced Version 2.11.002c software (Deltares, 2010) and provides 164 cross-sections between the upstream boundary at Tarbert Landing and the downstream boundary at Venice (see Fig. 1). The modelled reach will hardly receive any significant lateral in-flow due to precipitation which validates the use of the hydrodynamic 1DFLOW module
15
within SOBEK Rural and the exclusion of a rainfall-runoffmodule.
Daily discharge at Tarbert Landing is used for setting the upstream boundary con-dition for unsteady flow computations. A stage-discharge relation is used to compute the daily discharge based on observed daily stages. A fixed water level, representing the yearly averaged stage, is applied at the downstream boundary condition at Venice,
20
since no hourly data was available to incorporate the tidal signal. Although the tidal
signal may have a pronounced effect on the stages in the Mississippi River during low
DWESD
5, 333–349, 2012Mississippi flood hazard in New
Orleans
T. L. A. Driessen and M. van Ledden
Title Page
Abstract Introduction
Conclusions References
Tables Figures
◭ ◮
◭ ◮
Back Close
Full Screen / Esc
Printer-friendly Version Interactive Discussion
Discussion
P
a
per
|
Dis
cussion
P
a
per
|
Discussion
P
a
per
|
Discussio
n
P
a
per
|
2.2 Calibration
The model needs to be calibrated which means that the parameters that are known to be uncertain, are systematically varied in order to find the right setting for the specific study area. Calibration of the model is performed by a weighted multi-criteria procedure for the main channel friction (Manning) parameter. Such a detailed calibration
proce-5
dure is new for the Lower Mississippi river. The model is calibrated with a particular interest for high flow conditions. In order to include a realistic opening of the earlier mentioned Bonnet Carre Spillway stage a discharge time series originating from 1997 is used for the calibration procedure. Ten discharge bins are defined based on the min-imum and maxmin-imum discharge of that year. Based on the frequency of days that
fea-10
tures each bin a certain weighting factor is defined for the daily discharges in each bin, so that each bin has an equal weight (10 %) in the calculation of the statistical param-eters. These weighting factors are higher for higher discharges, since their occurrence is lower. A multi-criteria procedure is used, since one parameter does not indicate
ev-ery aspect of a time series. An optimal friction coefficient is expected by compromising
15
between multiple calibration parameters, such as the Nash-Sutcliffe coefficient (Nash
and Sutcliffe, 1970), the weighted linear regression coefficient, the weighted absolute
error and the weighted root square error. For six different segments along the
Missis-sippi River the Manning friction value in the main channel is calibrated based on the simulated stages.
20
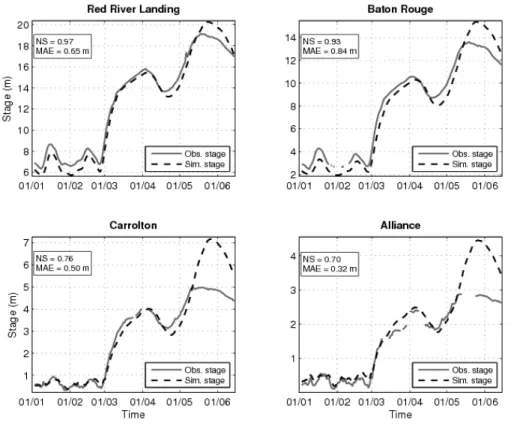
Figure 2 presents the results of the calibration procedure. The Nash-Sutcliffe
co-efficient and the mean absolute error are given for each location. The Nash-Sutcliffe
coefficient assesses the predictive power of a hydrological model and its optimum value
is 1. It is calculated by one minus the residual variance divided by the data variance. The model results show an overestimation of the maximum discharge peak for all six
25
measurement stations that are used. For the calibration period, the performance of the model to simulate water levels at Carrolton (New Orleans) is described with an 10th
DWESD
5, 333–349, 2012Mississippi flood hazard in New
Orleans
T. L. A. Driessen and M. van Ledden
Title Page
Abstract Introduction
Conclusions References
Tables Figures
◭ ◮
◭ ◮
Back Close
Full Screen / Esc
Printer-friendly Version Interactive Discussion
Discussion
P
a
per
|
Dis
cussion
P
a
per
|
Discussion
P
a
per
|
Discussio
n
P
a
per
|
are relatively large and are partly caused by the tidal signal that is dominant at this location under low flow conditions. The error becomes relatively larger in downstream direction.
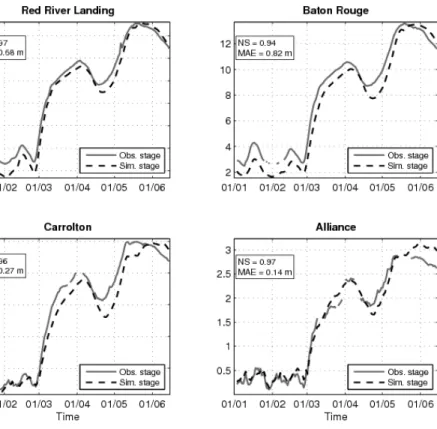
2.3 Validation
After the calibration procedure is completed a validation of the model needs to be
per-5
formed. It means that the model’s performance is investigated by using the calibrated
model parameters and by running the model for a different time period. Validation of
the model is performed using the Mississippi River flood of 2011. In this year there was
an exceptionally high discharge of 45 845 m3s−1 measured at Tarbert Landing
(US-ACE, 2011) that required the opening of the Bonnet Carre and Morganza Spillway for
10
several days. The validation run simulates stages for the time period 1 January 2011 to 14 June 2011. The validation results are given in Fig. 3 and show a good repre-sentation of the flood that occurred in May. Both the Bonnet Carre Spillway and the Morganza Spillway were opened during this flood. The latter flooded an area as large
as 7700 km2and caused the displacement of ca. 25 000 people.
15
At Carrolton (New Orleans) the mean absolute error of the model simulation is 0.31 m. The maximum peak stages are simulated exceptionally well. At Red River
Landing and Carrolton the difference of maximum stage is less than 0.01 m, while at
Baton Rouge the maximum stage is underestimated with 0.09 m. At Alliance the maxi-mum stage is overestimated with 0.25 m. The simulated hydrographs have a shift with
20
respect to the observed hydrographs. This is explained due to the fact that the veloci-ties in the model are underestimated. However, the model errors described above are relatively small considering the stage range of the Carrolton gage. Its average annual
lowest and highest stages are respectively NAVD88−0.01 m and NAVD88 +4.34 m.
The model demonstrates to be capable of simulating the hydrodynamics and,
there-25
fore, allows a legitimate use of the model for a comparative analysis.
DWESD
5, 333–349, 2012Mississippi flood hazard in New
Orleans
T. L. A. Driessen and M. van Ledden
Title Page
Abstract Introduction
Conclusions References
Tables Figures
◭ ◮
◭ ◮
Back Close
Full Screen / Esc
Printer-friendly Version Interactive Discussion
Discussion
P
a
per
|
Dis
cussion
P
a
per
|
Discussion
P
a
per
|
Discussio
n
P
a
per
|
especially of interest. The peak stage for this situation is projected to be NAVD88
+7.17 m, while the levee heights at Carrolton are ca. NAVD88 +7.30 m. This clearly
demonstrates the benefit that the spillways have in reducing flood hazard for the urban area of New Orleans.
2.4 Climate change projections 5
The climate change impact on the Mississippi river stages is investigated by using
different scenarios of sea level rise and upstream discharges. Based on the earlier
mentioned projections and the practical application of sea level rise, four situations are
used: no sea level rise,+0.45 m,+0.70 m and+1.00 m sea level rise. These scenarios
are within the limits of the appropriate USACE directive (USACE, 2009). Four
projec-10
tions of the upstream discharges are formulated by shifting the discharge hydrograph by a factor 0.95, 1.05, 1.10 and 1.15. Both the mean and standard deviation change
according to this factor. Three other projections are formulated by multiplying the diff
er-ence to the mean with a factor 1.1, 1.2 and 1.3. Hereby, the stages above and below
the mean are exaggerated. This does not affect the mean, but increases the standard
15
deviation by the used factors. Tweaking the hydrograph in aforementioned way finally results in four sea level rise projections and eight upstream discharge projections when a reference discharge projection is taken into account. Hence, 32 scenarios are used to assess the sensitivity of the Mississippi River stages to climate change.
3 Results 20
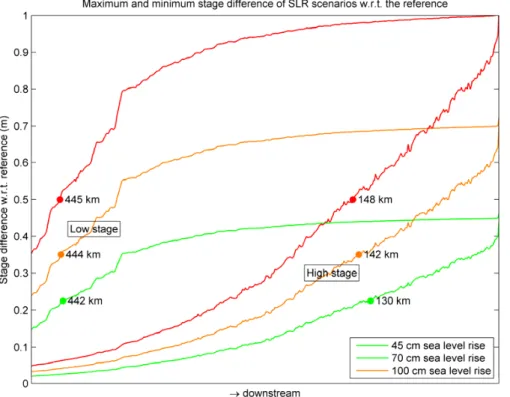
The defined scenarios are used to get an insight in the potential future behaviour of the Lower Mississippi system. By looking at the sea level rise scenarios where no discharge change is expected it can be concluded that the distance to the Gulf of
Mexico, the position where the effect of sea level rise is halved, becomes larger with
increasing sea level rise. The minimum stage difference with respect to the reference
DWESD
5, 333–349, 2012Mississippi flood hazard in New
Orleans
T. L. A. Driessen and M. van Ledden
Title Page
Abstract Introduction
Conclusions References
Tables Figures
◭ ◮
◭ ◮
Back Close
Full Screen / Esc
Printer-friendly Version Interactive Discussion
Discussion
P
a
per
|
Dis
cussion
P
a
per
|
Discussion
P
a
per
|
Discussio
n
P
a
per
|
scenario occurs during high flow conditions when the stage is predominantly depen-dent on the discharge. Then, the sea level rise is halved at 130 km, 142 km and 148 km
from the downstream boundary for respectively+0.45 m,+0.7 m and+1.0 m sea level
rise as can be seen in Fig. 5. The minimum increase of stage at Carrolton becomes
+0.21 m,+0.34 m and+0.50 m for all discharge regimes except the “−5 %”-scenario.
5
During low flow conditions the sea level has a stronger influence on the river stages. In this case the sea level rise is halved at 442 km, 444 km and 445 km for respectively the same three sea level rise projections. It is found that the stages along the entire
modelled reach are affected by sea level rise for the three projections. The maximum
stage increase at Carrolton is dependent on the type of discharge regime as well as
10
the strength of sea level rise.
Changes in discharge characteristics do not affect the stages downstream of Bonnet
Carre Spillway when it is closed, since a constant discharge is passed through.
How-ever, changes in the upstream discharge would affect the frequency and duration for
opening of the spillways. Their effect on the water level near Carrolton is demonstrated
15
in Figs. 3 and 4. The increase of stages in the downstream section is predominantly caused by the sea level rise. Currently, the threshold for a spillway opening is defined by the upstream discharge at Tarbert Landing. Sea level rise causes an increase in stage that changes the stage-discharge relationship. Thus in order to not exceed the
NAVD88+5.18 m threshold at Carrolton it is likely that a lower discharge threshold is
20
needed for opening the spillways.
The relative steep stage-discharge relation due to the confined levees causes a strong increase in stages when upstream discharges increase. A solution for this could be the diversion of water from the Mississippi River by a number of spillways or small-scale river diversions to surrounding water bodies, such as the Atchafalaya
25
River. Therefore, the cross-sectional area of the river is enlarged and stages near ur-ban areas are attenuated. During high flows the sediment volumes in particular are
known to be high in the Mississippi River. Small-scale diversions at different locations
DWESD
5, 333–349, 2012Mississippi flood hazard in New
Orleans
T. L. A. Driessen and M. van Ledden
Title Page
Abstract Introduction
Conclusions References
Tables Figures
◭ ◮
◭ ◮
Back Close
Full Screen / Esc
Printer-friendly Version Interactive Discussion
Discussion
P
a
per
|
Dis
cussion
P
a
per
|
Discussion
P
a
per
|
Discussio
n
P
a
per
|
on the Mississippi River is combined with counterbalancing sediment starvation, sub-sidence and indirectly salt intrusion. Therefore, these diversions could be opened on a yearly basis during the high flow period in spring. This would also keep the awareness of these diversions high among the people. Lowering of the stages near the urban ar-eas can also be reached by incrar-easing the flooded cross-section further downstream
5
(e.g. relocation of levees, river bypasses).
4 Conclusions
The work that is described above addresses the future changes in the Mississippi River stages regarding “climate change”-induced changes of upstream discharge and sea level. The weighted multi-criteria calibration procedure has provided a
hydrody-10
namic model that is capable of simulating high flows in the Mississippi River within an acceptable error margin and can be used legitimately for a comparative analysis.
The presence of the two spillways has proven to be of vital importance to reduce the flood hazard risk of the city New Orleans. In the future their role will be even more important. The challenges of the Mississippi River delta become even more apparent
15
with expected climate change impacts. All of them increase the flood hazard in the Greater New Orleans area, which is already situated in a flood-prone area. This study shows that sea level rise is likely to be dominant on the downstream end of the Bonnet Carre Spillway which has a strong influence on the stages near New Orleans. At the same time the increased upstream discharge increases the frequency and duration of
20
spillway openings.
Small-scale river diversions and enlarging cross-sectional area in downstream sec-tions are proposed solusec-tions for reducing flood hazard in urban areas. The feasibility of these solutions should be studied, because the urban and industrial areas are lo-cated tightly to the river levees and possible impacts on navigation and environment
25
DWESD
5, 333–349, 2012Mississippi flood hazard in New
Orleans
T. L. A. Driessen and M. van Ledden
Title Page
Abstract Introduction
Conclusions References
Tables Figures
◭ ◮
◭ ◮
Back Close
Full Screen / Esc
Printer-friendly Version Interactive Discussion
Discussion
P
a
per
|
Dis
cussion
P
a
per
|
Discussion
P
a
per
|
Discussio
n
P
a
per
|
updated bathymetry and a morphological module would be an added value for these investigations.
References
Barry, J.: Rising Tide – The Great Mississippi Flood of 1927 and How it Changed America, Simon & Schuster, New York, 1998.
5
Bourne Jr., J. K.: Gone with the water, National Geographic Magazine, 2004, from National Ge-ographic.com: http://ngm.nationalgeographic.com/ngm/0410/feature5/, retrieved May 2009. Deltares: Design and analysis tools – SOBEK suite, from Deltares Systems: http://www.
deltaressystems.com/hydro/product/108282/sobek-suite, 2010 Retrieved October 2011.
Ericson, J., V ¨or ¨osmarty, C., Dingman, S., Ward, L., and Meybeck, M.: Effective sea-level rise
10
and deltas – Causes of change and human dimension implications, Global Planet. Change, 50, 63–82, 2006.
Knabb, R., Rhome, J., and Brown, D.: Tropical Cyclone Report Hurricane Katrina, 2011, from NOAA: http://www.nhc.noaa.gov/pdf/TCR-AL122005 Katrina.pdf, retrieved 11 October 2011.
15
Krupa, M.: New Orleans’ official 2010 census population is 343,829 agency reports, 2011,
from Nola.com: http://www.nola.com/politics/index.ssf/2011/02/new orleans officials 2010
pop.html, retrieved October 2011.
Nash, J. I. and Sutcliffe, I. V.: River flow forecasting through conceptual models: Part I – A
discussion of principles, J. Hydrol., 10, 282–290, 1970. 20
Nicholls, R. J., Wong, P. P., Burkett, V. R., Codignotto, J., Hay, J., McLean, R., Ragoonaden,
S., and Woodroffe, C. D.: Coastal systems and low-lying areas, in: Climate change 2007:
im-pacts, adaptation and vulnerability. Contribution of Working Group II to the fourth assessment report of the Intergovernmental Panel on Climate Change, edited by: Parry, M. L., Canziani, O. F., Palutikof, J. P., van der Linden, P. J., and Hanson, C. E., Cambridge, UK, Cambridge 25
University Press, 315–356, 2007.
NOAA: Sea Levels Online, 2011, from NOAA Tides and Currents: http://tidesandcurrents.noaa. gov/sltrends/sltrends.shtml, retrieved 28 August 2011.
DWESD
5, 333–349, 2012Mississippi flood hazard in New
Orleans
T. L. A. Driessen and M. van Ledden
Title Page
Abstract Introduction
Conclusions References
Tables Figures
◭ ◮
◭ ◮
Back Close
Full Screen / Esc
Printer-friendly Version Interactive Discussion
Discussion
P
a
per
|
Dis
cussion
P
a
per
|
Discussion
P
a
per
|
Discussio
n
P
a
per
|
lars: http://140.194.76.129/publications/eng-circulars/ec1165-2-211/entire.pdf, retrieved 28 August 2011.
US Army Corps of Engineers: Discharge Data; Mississippi River at Tarbert Landing, MS, 2011: http://www.mvn.usace.army.mil/cgi-bin/wcmanual.pl?01100, retrieved 11 October 2011. USGCRP: Climate change impacts on the United States – The potential consequences of 5
DWESD
5, 333–349, 2012Mississippi flood hazard in New
Orleans
T. L. A. Driessen and M. van Ledden
Title Page
Abstract Introduction
Conclusions References
Tables Figures
◭ ◮
◭ ◮
Back Close
Full Screen / Esc
Printer-friendly Version Interactive Discussion
Discussion
P
a
per
|
Dis
cussion
P
a
per
|
Discussion
P
a
per
|
Discussio
n
P
a
per
|