Human Gastroenteropancreatic Expression of
Melatonin and Its Receptors MT1 and MT2
Fanny Söderquist1, Per M. Hellström2, Janet L. Cunningham1*
1Department of Neuroscience, Psychiatry, Uppsala University, Uppsala, Sweden,2Department of Medical Sciences, Gastroenterology/Hepatology, Uppsala University, Uppsala, Sweden
Abstract
Background and Aim
The largest source of melatonin, according to animal studies, is the gastrointestinal (GI) tract but this is not yet thoroughly characterized in humans. This study aims to map the ex-pression of melatonin and its two receptors in human GI tract and pancreas using microar-ray analysis and immunohistochemistry.
Method
Gene expression data from normal intestine and pancreas and inflamed colon tissue due to ulcerative colitis were analyzed for expression of enzymes relevant for serotonin and mela-tonin production and their receptors. Sections from paraffin-embedded normal tissue from 42 individuals, representing the different parts of the GI tract (n=39) and pancreas (n=3) were studied with immunohistochemistry using antibodies with specificity for melatonin, MT1and MT2receptors and serotonin.
Results
Enzymes needed for production of melatonin are expressed in both GI tract and pancreas tissue. Strong melatonin immunoreactivity (IR) was seen in enterochromaffin (EC) cells par-tially co-localized with serotonin IR. Melatonin IR was also seen in pancreas islets. MT1and
MT2IR were both found in the intestinal epithelium, in the submucosal and myenteric
plex-us, and in vessels in the GI tract as well as in pancreatic islets. MT1and MT2IR was
stron-gest in the epithelium of the large intestine. In the other cell types, both MT2gene
expression and IR were generally elevated compared to MT1. Strong MT2, IR was noted in
EC cells but not MT1IR. Changes in gene expression that may result in reduced levels of
melatonin were seen in relation to inflammation.
Conclusion
Widespread gastroenteropancreatic expression of melatonin and its receptors in the GI tract and pancreas is in agreement with the multiple roles ascribed to melatonin, which
OPEN ACCESS
Citation:Söderquist F, Hellström PM, Cunningham
JL (2015) Human Gastroenteropancreatic Expression of Melatonin and Its Receptors MT1 and MT2. PLoS ONE 10(3): e0120195. doi:10.1371/journal. pone.0120195
Academic Editor:Andrzej T Slominski, University of
Tennessee, UNITED STATES
Received:January 12, 2015
Accepted:February 5, 2015
Published:March 30, 2015
Copyright:© 2015 Söderquist et al. This is an open
access article distributed under the terms of the Creative Commons Attribution License, which permits unrestricted use, distribution, and reproduction in any medium, provided the original author and source are credited.
Data Availability Statement:The following data sets
were used and are freely available: GEO Series GSE9576, GEO series GSE16515, GEO series GSE15471, GEO Series GSE3842, GEO series GSE11223. All other relevant data are within the paper and its Supporting Information files.
Funding:This work was funded by grants from Erik,
include regulation of gastrointestinal motility, epithelial permeability as well as enteropan-creatic cross-talk with plausible impact on metabolic control.
Introduction
Melatonin is well known as a pineal gland hormone that regulates sleep and circadian rhythm but there is also evidence for additional important regulatory functions [1]. Recent publications indicate that melatonin and its receptors regulate circulating glucose levels via insulin and glu-cagon secretion [2–4]. In the immune system, melatonin acts as an immunomodulator [5,6] and both melatonin and its derivatives are powerful antioxidants, acting as scavengers of free radicals [7–9] for example protecting skin from UVR-induced damage [10]. Melatonin has been shown to promote cell survival in normal tissues [11–13], but to have oncostatic effects in various types of cancer [14–17]. While not widely known, it has previously been demonstrated in animal studies that the largest source of melatonin is the gastrointestinal (GI) mucosa [18]. The total amount of GI melatonin is estimated to be 400 times greater than that present in the pineal gland [18].
There are two receptors for melatonin, type 1A (MT1) and type 1B (MT2), both of which are
G-protein coupled with high affinity in the nanomolar range [19]. Melatonin can also bind to retinoid related orphan nuclear hormone receptors (RZR/RORalfa)[20]. Subtypes of this nuclear receptor family display tissue specificity but their function is largely unknown [21]. There is a pu-tative strong-affinity MT3 binding site that has been identified as a quinone reductase 2 [22], but its exact function, which involves NADP+/NADPH redox steps, remains to be determined [23].
In rats, mRNA transcripts of both MT1and MT2have been detected in the small intestine
and colon [24,25]. The highest expression of MT1mRNA was detected in the subepithelial
lay-ers (muscularis externa and serosa) of the duodenum while the highest density of MT2protein
(using immunohistochemistry and western blot) was found in the colon, primarily in the smooth muscle layers [26]. One recent study has demonstrated MT1immunoreactivity (IR) in
human colon using immunohistochemistry (IHC) [27]. Another study on human duodenum showed melatonin, through MT2receptors to be active on intracellular calcium storage [28].
Both rat MIN6 pseudoislets (beta cells) and human islets express mRNAs coding for MT1and
MT2receptors, although human islet MT2 mRNA expression was low in this study [2]. Thus it
seems that the presence of melatonin and its receptors in human GI tract and pancreas has not yet been fully characterized.
Melatonin in the GI tract appears to dampen intestinal motility [29,30]. Levels of melatonin vary in relation to fasting and food intake. In pinealectomized rats, melatonin levels in the por-tal vein increase after tryptophan administration [31]. In humans and pigs, levels of melatonin do not follow a circadian rhythm but are elevated after food intake [32]. Short-term fasting in humans for two days reduces nocturnal concentrations of melatonin in serum [33]. In mice, fasting for 24 and 48 hours resulted in increased levels of melatonin in GI tissue, particularly in the stomach [34]. In rats, melatonin has been shown to release bicarbonate secretion and pro-tect the mucosa [35]. Melatonin may also influence other hormones regulating hunger and sa-tiety such as leptin and ghrelin [36,37].
Our present study aims to localize the presence of melatonin and its receptors, MT1and
MT2,at the cellular level in human GI tract and pancreas, using IHC and microarray
expres-sion analysis. This provides a basis for upcoming research on the regulatory function of mela-tonin in the upper and lower GI tract in man.
study design, data collection and analysis, decision to publish, or preparation of the manuscript.
Competing Interests:The authors have declared
Materials and Methods
Ethics
The study was approved by the Regional Ethics Committee in Uppsala (Number: 2007/143, with decisions 2007-06-13 and 2012-09-14). Written informed consent was obtained for mate-rial collection but not this specific study on normal tissue as the data were analyzed anony-mously with the purpose of method development and samples cannot be traced back to individuals. The Regional Ethics Committee waived the need for consent in this case in accor-dance with Swedish law.
Microarray expression analysis
From the public gene expression data archive Gene Expression Omnibus (GEO) [38], raw data in the form of CEL-files from small intestinal epithelium GEO Series GSE9576 [39] and from human pancreas from the GEO Series GSE16515 [40] (n = 16) and GSE15471 [41] (n = 39) were extracted. The data in GSE9576 is based on RNA from immunolaser capture microdis-sected cells derived from three snap frozen histopathologically normal small intestinal epitheli-um specimens sectioned 10μm thick and labeled with chromogranin A, where it is estimated
that 25% of the captured cells are endocrine [39]. The data in GSE16515 and GSE15471 are histopathologically normal whole pancreas tissue from persons with pancreatic cancer [40,41]. The normal samples from the above-mentioned datasets, all run on the same microarray plat-form“Affymetrix Human Genome U133 Plus 2.0 Array”(GEO Accession GPL570), were im-ported into Expression Console provided by Affymetrix (http://www.affymetrix.com). Normalization was performed using the robust multi-array average (RMA) method first sug-gested by Li and Wong in 2001[42,43]. One sample“GSM388111”, from the GEO Series GSE15471, was excluded from further analysis as it failed the housekeeping gene control in-cluded on the array. Normalized Log2 expression signals were finally extracted from Expres-sion Console including annotations.
Moreover the normal pancreatic islet samples from the GEO Series GSE3842[44] (n = 54), obtained from microarray analysis on the Affymetrix Human Gene 1.0 ST Array (GEO Acces-sion GPL6244), were imported into ExpresAcces-sion Console and further normalized as previously described. This data is based on RNA isolated islets from non-diabetic cadaver donors [44].
Further analysis was performed in the statistical computing language R ( http://www.r-project.org), where the gene expression data for the key enzymes involved in production of melatonin from tryptophan, as well as receptors for serotonin and melatonin were extracted in-cluding annotations depicted inS1andS2Tables. Expression signals for parathyroid hormone (PTH) were used as a negative control. When the features could not be matched to the probe set ID, as in the case with the latter data set that is provided by a different microarray platform, matching was done based on Gene Symbol. The expression values for each feature were finally averaged for each GEO series separately and the results were visualized in separate plots.
The Linear Models for Microarray Analysis (limma) R package on GEO2R (http://www.
Histology
Control tissues. Human tissue, representing different parts of the GI tract, was obtained from resection tissue margins removed from adult patients during surgery for malignancies; the margins were located at least 2 cm away from the neoplasm. Only tissue with normal macro- and microscopic morphological appearance were included in the study. The identity and their clinical data of the patients are not known and are not included in the analysis. Mate-rial from the GI tract of 39 individuals and from the pancreas of 3 individuals. (17 purchased from Asterand, Detroit, MI, USA and 25 from the Department of Pathology, Uppsala Universi-ty Hospital, Uppsala, Sweden). Positive controls for MT1and MT2were performed on tissues
from skin (2) (obtained from the Department of Immunology, Genetics and Pathology, Upp-sala University Hospital) were studied.
Immunohistochemistry and microscopic assessments. Tissue specimens were fixed in 4% buffered formalin for 1–2 days, dehydrated, and embedded in paraffin wax. Sections, 4μm
thick, were attached to positively charged glass superfrost slides (Menzel-Gläser, Braunschweig, Germany). Sections were deparaffinized in xylene and rehydrated using decreasing concentra-tions of ethanol to distilled water. Antigen retrieval was performed using pressure cooker treat-ment for 10 minutes in citrate buffer pH 6. For MT1, sections were incubated for 30 minutes in
0.1% H2O2to quench endogenous peroxidase, washed in phosphate-buffered saline (PBS), and
then incubated with normal horse serum diluted 1:5 for 30 minutes. (Vector Laboratories, Bur-lingame, CA, USA). The sections were then incubated overnight at 4°C with a polyclonal goat anti-human MT1antibody (Anti-MTR-1A, (N-20), sc13179, Santa Cruz Biotechnology, Dallas,
Texas, USA diluted 1:500). Sections were washed thrice in PBS and then incubated with bioti-nylated horse anti-goat antibody (BA-9500, Vector Laboratories). Thereafter, sections were in-cubated for 30 minutes with avidin-biotin—horseradish peroxidase (PK-6100, Vectastain Elite ABC kit, Vector Laboratories). Rabbit anti-melatonin (0100–0203 AbD Serotec, Kidlington, UK, diluted 1/500), rabbit anti-melatonin receptor 1B (ABIN122307, Antibodies-online GmbH, Aachen, Germany diluted 1:100) and monoclonal mouse anti-serotonin (Clone 5HT-H209 DAKO Sweden AB, Stockholm, Sweden, diluted 1/100) antibodies were diluted in PBS with 1% bovine serum albumin (BSA). The DAKO EnVision™systems for rabbit and for
mouse (DAKO Sweden AB, Stockholm, Sweden) were used for antibody detection according to the manufacturer’s instructions. Diaminobenzidine was used as chromogen. For visualiza-tion of nuclei, the secvisualiza-tions were counterstained with Mayer’s haematoxylin.
The specimens were altogether from 42 patients, 12 from stomach (fundus (n = 1), corpus (n = 5), antrum (n = 3) and pylorus (n = 3)), 11 from small intestine (duodenum (n = 3) and ileum (n = 8)), 3 from appendix, 13 from large intestine (cecum (n = 1), colon (n = 8), rectum (n = 4)) and 3 from pancreas. All specimens were coded and examined by two independent ob-servers (FS and JLC) on two separate occasions. Staining intensity was classified as negative, weak, medium or strong for MT1and MT2and the cellular and intracellular localization was
documented. The evaluators were in agreement in 92% of the cases. When disagreement oc-curred sections were reexamined and consensus reached. Sections from skin were used as a positive control for MT1and MT2. Differences between melatonin expression in the different
parts of the gastrointestinal tract was tested with the Kruskal-Wallis Test and the Mann Whit-ney was used as a post-hoc test.
secondary antibody, diluted 1:10 in PBS with 1% BSA. The secondary antibodies used were: tet-ramethyl rhodamine isothiocyanate (TRITC)-conjugated rabbit anti-goat TRITC (Alexa 555 A 21431) fluorescein isothiocyanate (FITC)-conjugated goat anti-mouse (Alexa 488 A 11001) TRITC-conjugated goat rabbit (Alexa 555 A 21428) and FITC-conjugated rabbit anti-mouse (Alexa 488 A 11059) all from Life Technologies Europe BV (Stockholm, Sweden). The incubation time for the secondary antisera was 30 minutes at room temperature. The sections were examined in a Zeiss 510 confocal microscope and photographed with an AxioCam cam-era employing ZEN 2012 imaging software (Carl Zeiss AB, Stockholm, Sweden) and a 40X plan-apochromat objective. Co-localization studies were performed on tissue sections from the pylorus (n = 2) and ileum (n = 2).
Antibody specificity tests. A neutralization test was performed for melatonin antibodies using saturated (0.1 mg/mL) solutions of melatonin and serotonin (0.1 mg/mL) in PBS with 1% BSA. Specificity tests were performed for the MT1and MT2antibodies using IHC. Control
immunostaining included omission of the primary antisera, and replacement of the primary antibody by non-immune serum at the same dilution as the primary antibody in question and in the same diluent. A neutralization test was conducted by means of 24-hour incubation of primary antiserum with the relevant antigen (sc-13179P, Santa Cruz Biotechnology, Dallas, Texas, USA and SP4391CP, 10 nmol antigen per mL, diluted 1:100 antibody solution) before application to the sections.
Results
Microarray expression analysis
Gene expression data for key enzymes in tryptophan metabolism as well as for serotonin and melatonin receptors were analyzed in data from small intestine epithelium enriched for entero-chomaffin cells, whole pancreas and pancreatic islets (seeS1andS2Tables). The data distribu-tion, visualized with a histogram, showed that expression (log2)<3 provided an indication of
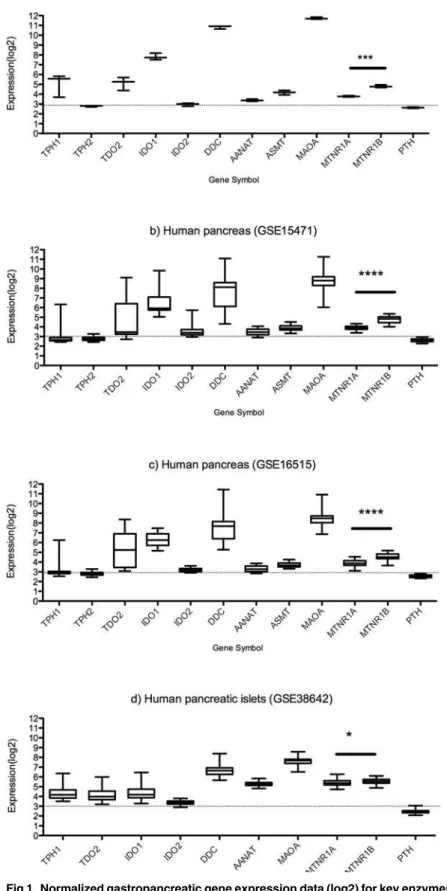
very low or absent expression. Additionally, RNA levels of PTH were used as a negative control (seeFig. 1).
In the samples from small intestine, tryptophan hydroxylase 1 (TPH1) and DOPA decar-boxylase (DDC) were expressed and DCC levels were very high (log2expression>10). Gene
expression of the enzymes needed for the production of melatonin from serotonin, arylalkyla-mine N-acetyltransferase (AANAT) and acetylserotonin O-methyltransferase (ASMT or HIOMT) were present. Both of the melatonin receptors were expressed with MT2expression
higher than of MT1(p = 0.0003) in small intestinal mucosa, as found also with IHC analysis
(see below).
Two sets of data from normal whole pancreas were analyzed with nearly identical results. TPH1 expression was generally low but there were some individuals with elevated levels, while DDC expression was high in all cases. AANAT and ASMT were present but at low levels. MTNR1A (MT1) and MTNR2B (MT2) were expressed at levels comparable to those of the small
intestine. The levels of MTNR2B exceeded levels of MTNR1A in both data sets (p<0.0001).
In pancreatic islets, the expression patterns for TPH1 and DDC resembled those of whole pancreas. AANAT, MTNR1A and MTNR2B were all expressed at similar levels, data for TPH2 and ASMT was not available in this set. Levels of MTNR2B were higher than for MTNR1A (p = 0.02).
Fig 1. Normalized gastropancreatic gene expression data (log2) for key enzymes in tryptophan serotonin and melatonin metabolism and receptors for melatonin and serotonin.a) Human small intestinal epithelium (GSE9576) b) Human pancreas (GSE15471) c) Human pancreas (GSE16515) d) Human pancreatic islets (GSE38642). MT2expression levels exceed MT1levels in small intestine, whole
pancreas and islets. (*p<0.05,***p<0.001,****p<0.0001).
cells enriched for endocrine cells) and in pancreatic islets at the same level as TPH1, while IDO1 levels exceeded TPH1 levels in small intestine (p = 0.02) and were similar as TPH1 in pancreatic islets. IDO2 levels were low in the tissues studied.
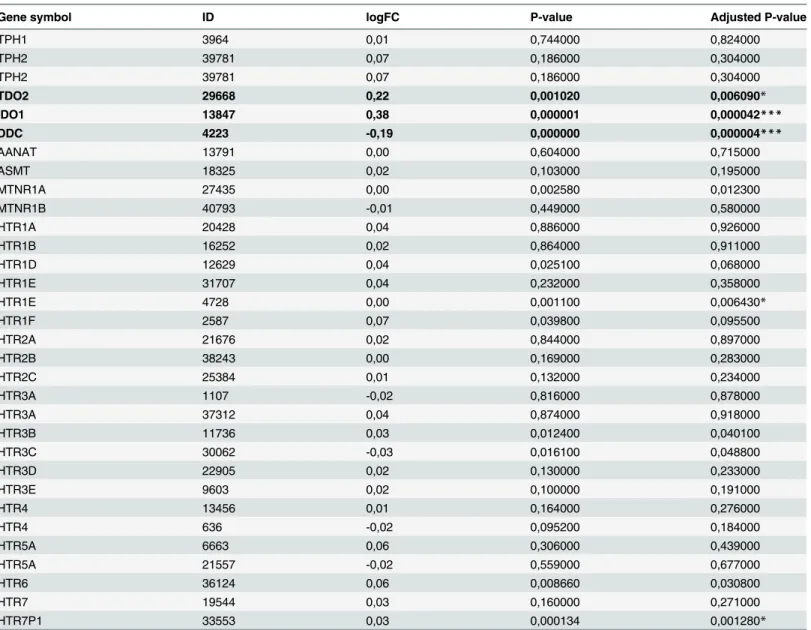
When inflamed tissue from ulcerative colitis was compared to controls regarding gene ex-pression of enzymes for melatonin synthesis and its receptors, no difference in gene exex-pression exceeding 1.5X (log2 fold change ± 0.6) was observed (seeTable 1). The largest difference ob-served in the gene set was for TDO2 (logFC 0.22, p<0.01), IDO1 (logFC 0.38, p = 0.0004) and
DDC (logFC -0.19, p = 0.000004).
Histology
Immunoreactive cells for melatonin and its receptors were found throughout the GI tract and pancreas. Staining with melatonin, MT1and MT2antibodies were completely blocked by
pre-incubation with the respective antigens. Prepre-incubation with serotonin partially blocked the melatonin immunostaining.
Intense melatonin IR was seen in enterochromaffin (EC) cells (SeeTable 2). In the stomach, five sections displayed plentiful EC cells with distinct serotonin and melatonin IR. Sections negative for serotonin also lacked melatonin. Throughout the remaining GI-tract numerous EC cells with distinct IR (seeFig. 2G-I) were identified. Co-localization studies showed that melatonin IR was diffusely spread in the cytoplasm and only partially co-localized with seroto-nin IR (seeFig. 3A-C). In a small fraction of EC cells, melatonin IR was much stronger than se-rotonin IR. Diffuse melatonin IR was found in the absence of sese-rotonin IR in the cytoplasm of surface columnar epithelium in both mucus-producing cells (mucous neck cells and goblet cells) and columnar enterocytes with weak intensity in few cases from the stomach, and small intestine. In contrast, epithelial expression was stronger in all but one case from the large intes-tine (seeFig. 2I). Melatonin IR was found in the cytoplasm of mononuclear immune cells in the lamina propria. Finally, strong melatonin IR was discovered in a majority of the endocrine cells in the pancreatic islets (3/3) (seeFig. 2J) while serotonin IR was absent.
MT1IR was found primarily in the cytoplasm of epithelium in both mucus-producing cells
(mucous neck cells and goblet cells) and columnar enterocytes (seeFig. 2AandTable 2). Weak to medium MT1IR was found in the stomach (7/12), small intestine (7/11) and appendix (3/3)
(seeFig. 2A, C and E). The most intense MT1IR was observed in the epithelium of the large
in-testine where all sections were positive. No relationship between EC cells and MT1IR was seen.
Weak MT1receptor IR was rarely found in the submucosal plexus of the small intestine (1/10)
or the appendix (1/3), and was found more often in the large intestine (8/13). Weak MT1
recep-tor IR was noted in the myenteric plexus in the small intestine (5/9), in the appendix (2/3) and in the large intestine (9/13) (seeFig. 3E). Smooth muscle cells were negative for the MT1IR. In
vascular structures, weak MT1IR was seen in endothelial cells in the distal parts of the GI tract;
the appendix (3/3) and the large intestine (12/13) (seeFig. 3G). EC cells were negative for MT1
IR (seeFig. 4D-F). In pancreatic tissue, MT1IR varied. In one case, strong IR was found in a
subset of cells in pancreatic islets and weaker IR was seen in pancreatic acini (seeFig. 2K). The remaining two cases were negative.
MT2IR was most prominent in the epithelium, localized to nuclei as well as cytoplasm of
enterocytes throughout the GI tract, with the strongest IR in the large intestine (seeFig. 3Band
Table 2). Additionally, all sections from the small and large intestine and 5 of 12 gastric sec-tions showed cytoplasmic MT2staining of endocrine cells in the crypts (seeFig. 2B, D and F).
Negative gastric sections were also negative for serotonin IR. Co-localization studies verified MT2IR and serotonin IR, a marker for EC cells, in the same cells but in different cytoplasmic
were also noted. Weak MT2staining was present in intestinal smooth muscle cells in all
sec-tions. Cytoplasmic MT2IR was noted in both the submucosal and myenteric plexuses
through-out the GI tract (seeFig. 3D and F). A small number of immune cells in the lamina propria also displayed nuclear and cytoplasmic MT2receptor IR (seeFig. 3B). MT2IR was observed in a
subset of cells in the vascular smooth muscle cells of all tissues studied (seeFig. 3H). Strong MT2IR was found in a subset of cells in the endocrine pancreas (3/3) and in cells lining the
pancreatic ducts, while IR in acinar cells was not seen (seeFig. 2L).Table 2summarizes the findings for MT1and MT2in different cell types.
Table 1. Data from GEO series GSE11223 was analyzed using the limma R package on GEO2R in order to find differentially expressed genes be-tween colon biopsies from UC patients (inflamed) and healthy controls (not inflamed).
Gene symbol ID logFC P-value Adjusted P-value
TPH1 3964 0,01 0,744000 0,824000
TPH2 39781 0,07 0,186000 0,304000
TPH2 39781 0,07 0,186000 0,304000
TDO2 29668 0,22 0,001020 0,006090*
IDO1 13847 0,38 0,000001 0,000042***
DDC 4223 -0,19 0,000000 0,000004***
AANAT 13791 0,00 0,604000 0,715000
ASMT 18325 0,02 0,103000 0,195000
MTNR1A 27435 0,00 0,002580 0,012300
MTNR1B 40793 -0,01 0,449000 0,580000
HTR1A 20428 0,04 0,886000 0,926000
HTR1B 16252 0,02 0,864000 0,911000
HTR1D 12629 0,04 0,025100 0,068000
HTR1E 31707 0,04 0,232000 0,358000
HTR1E 4728 0,00 0,001100 0,006430*
HTR1F 2587 0,07 0,039800 0,095500
HTR2A 21676 0,02 0,844000 0,897000
HTR2B 38243 0,00 0,169000 0,283000
HTR2C 25384 0,01 0,132000 0,234000
HTR3A 1107 -0,02 0,816000 0,878000
HTR3A 37312 0,04 0,874000 0,918000
HTR3B 11736 0,03 0,012400 0,040100
HTR3C 30062 -0,03 0,016100 0,048800
HTR3D 22905 0,02 0,130000 0,233000
HTR3E 9603 0,02 0,100000 0,191000
HTR4 13456 0,01 0,164000 0,276000
HTR4 636 -0,02 0,095200 0,184000
HTR5A 6663 0,06 0,306000 0,439000
HTR5A 21557 -0,02 0,559000 0,677000
HTR6 36124 0,06 0,008660 0,030800
HTR7 19544 0,03 0,160000 0,271000
HTR7P1 33553 0,03 0,000134 0,001280*
Genes with logFC>0.1 are marked in bold typeface and significance is indicated as follows: *p<0.01,
**p<0.005, ***p<0.0001.
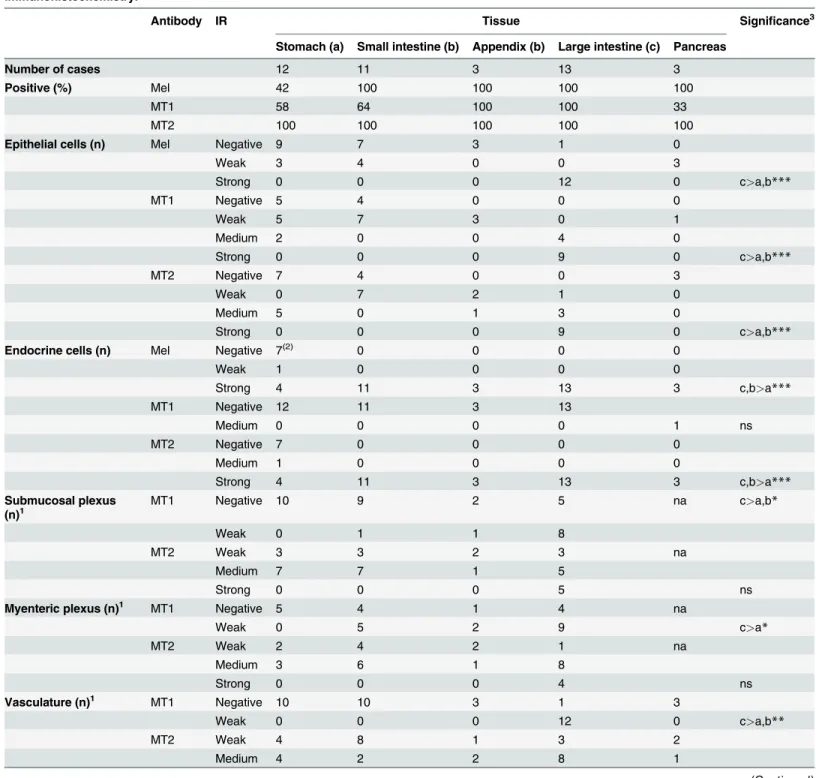
Table 2. Localization of melatonin (Mel) and receptors (MT1and MT2) in human gastrointestinal tract and pancreas assessed using
immunohistochemistry.
Antibody IR Tissue Significance3
Stomach (a) Small intestine (b) Appendix (b) Large intestine (c) Pancreas
Number of cases 12 11 3 13 3
Positive (%) Mel 42 100 100 100 100
MT1 58 64 100 100 33
MT2 100 100 100 100 100
Epithelial cells (n) Mel Negative 9 7 3 1 0
Weak 3 4 0 0 3
Strong 0 0 0 12 0 c>a,b***
MT1 Negative 5 4 0 0 0
Weak 5 7 3 0 1
Medium 2 0 0 4 0
Strong 0 0 0 9 0 c>a,b***
MT2 Negative 7 4 0 0 3
Weak 0 7 2 1 0
Medium 5 0 1 3 0
Strong 0 0 0 9 0 c>a,b***
Endocrine cells (n) Mel Negative 7(2) 0 0 0 0
Weak 1 0 0 0 0
Strong 4 11 3 13 3 c,b>a***
MT1 Negative 12 11 3 13
Medium 0 0 0 0 1 ns
MT2 Negative 7 0 0 0 0
Medium 1 0 0 0 0
Strong 4 11 3 13 3 c,b>a***
Submucosal plexus (n)1
MT1 Negative 10 9 2 5 na c>a,b*
Weak 0 1 1 8
MT2 Weak 3 3 2 3 na
Medium 7 7 1 5
Strong 0 0 0 5 ns
Myenteric plexus (n)1 MT1 Negative 5 4 1 4 na
Weak 0 5 2 9 c>a*
MT2 Weak 2 4 2 1 na
Medium 3 6 1 8
Strong 0 0 0 4 ns
Vasculature (n)1 MT1 Negative 10 10 3 1 3
Weak 0 0 0 12 0 c>a,b**
MT2 Weak 4 8 1 3 2
Medium 4 2 2 8 1
Discussion
Animal studies have established the presence of melatonin in the GI tract. Little data on human GI tract and pancreas is available. A limitation of our study and a general problem for many studies of human tissue is that histologically normal tissue is usually not obtained from healthy persons. In this study, tissue was obtained during surgery after standardized fasting or from cadavers, which may influence the expression of hormones and their receptors.
In the tissue, l-tryptophan is converted to serotonin with enzymes TPH1 (or TPH2 in neu-ronal cells) and DDC. Melatonin is then synthesized from serotonin through two enzymatic steps, AANAT and ASMT. It is, therefore, not surprising that melatonin was found throughout the gut. Our analysis of gene expression data show that AANAT and ASMT are expressed in the small intestine epithelial cells enriched for endocrine cells. The Human Protein Atlas also verified positive IHC staining for AANAT throughout the GI tract (http://www.proteinatlas. org/ENSG00000129673-AANAT/tissue) [46]. Interestingly, AANAT staining is located in the glandular cells of the mucosa and not restricted to endocrine cells. The lower expression levels for AANAT compared with ASMT (p = 0.0055) is in agreement with the indication that AANAT was the rate-limiting enzyme for melatonin production and ASMT catalyzing the final reaction in the synthesis of melatonin. The antibody against melatonin also displayed par-tial IR for N-acetyl serotonin (<0.01%). Hence, we cannot exclude the possibility of false
posi-tive melatonin IR in cells producing serotonin. This potential confounder was minimized through co-localization studies where the subcellular localizations for serotonin and melatonin only partially overlap (seeFig. 3A-C). Another indication that this finding is true was the pres-ence of EC cells where IR to melatonin greatly exceeded that to serotonin.
A large number of EC cells throughout the GI tract also displayed MT2IR. This is a different
finding from that found in the rat intestine where MT2immunolabeling was expressed
pre-dominantly within the muscular layers but not in the mucosa [26]. Co-localization studies with serotonin showed MT2receptor IR to be present in the cytoplasm in separate locations. MT1
receptor IR was generally not seen in EC cells, which is possibly due to periodicity in MT1
Table 2. (Continued)
Antibody IR Tissue Significance3
Stomach (a) Small intestine (b) Appendix (b) Large intestine (c) Pancreas
Strong 2 0 0 2 0 ns
Melatonin, MT1and MT2IR was strongest in the large intestine epithelium. At all levels of the gastrointestinal tract, the percentage of MT2-positive
epithelial cells varied greatly between cases (from 5% to>75). Melatonin and MT2and immunoreactivity (IR) is found in endocrine cells in the gut and pancreas. These cells are most plentiful in the small and large intestine. Melatonin IR was not assessed for plexus and vasculature. Nerve and vascular tissue showed both MT1and MT2IR although this was more frequent and stronger for MT2.Numbers of individuals where tissues were available for
assessment is indicated under N. Percentage of individuals where tissue showed IR and the tissue type where IR was found is indicated (n).“na”: not applicable
1
Shown for cases where sufficient tissue was available for evaluation.
2
Serotonin IR is also negative for these sections.
3
Differences between expression in stomach (a), small intestine and appendix (b) and large intestine (c). Significance tested with the Kruskal-Wallis Test and the Mann Whitney U Test was used as a post-hoc test,
*p<0.05, **p<0.005, ***p<0.0001, ns = not significant.
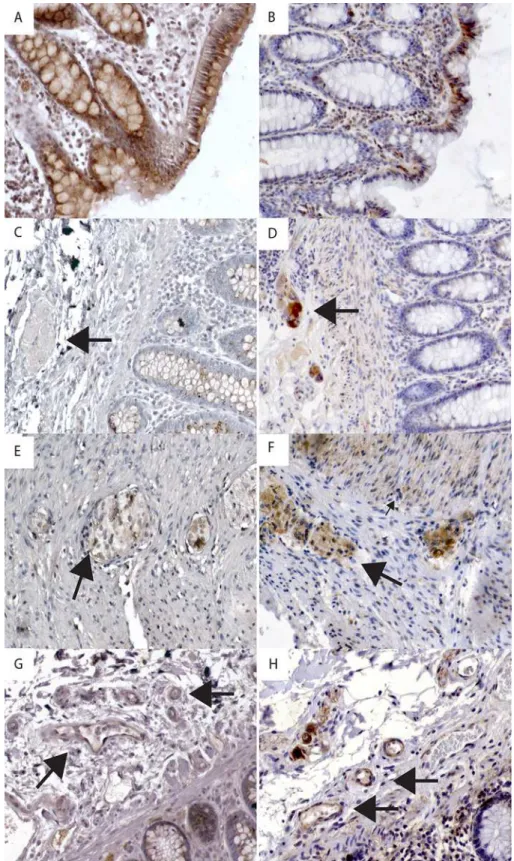
Fig 2. Immunohistochemical staining of gastrointestinal tract and pancreas tissue with antibodies against melatonin and receptors MT1and MT2.A) Strong MT1receptor immunoreactivity (IR) in epithelium
in pyloric mucosa. B) Strong MT2receptor IR in epithelium and endocrine cell (arrow) in pyloric mucosa. C)
Weak MT1receptor IR in epithelium in ileal mucosa. D) MT2receptor IR is negative in epithelial cells but
strong in endocrine cells (arrow) in duodenal mucosa E) Strong MT1receptor IR in epithelium of colon
mucosa. Insert shows neutralization test for MT1. F) Strong MT2receptor IR in epithelium and endocrine cells
(arrow) in colon mucosa. Insert shows neutralization test for MT2. G) Strong melatonin IR in endocrine cells in
receptor expression as described for MT1in the brain, where cAMP levels stimulates MT1
up-regulation and melatonin stimulates MT1down-regulation [47–50].
Melatonin is a fat-soluble compound that easily crosses cell membranes and the blood-brain barrier. Melatonin is not thought to be stored in cells upon production [18] but rather immediately released. In the intestine, high concentrations of luminal melatonin increase bi-carbonate secretion in the duodenum in response to acidic luminal contents via the MT2
recep-tor, theoretically protecting the intestinal mucosa [35]. We were therefore expecting staining of MT2in the distal duodenal mucosa but this was only found in few. One possible explanation
for this may be that proton pump inhibitor medication is commonly administered pre-surgery in order to diminish the risk of aspiration. Thus, a reduced acid load on the mucosa may have affected the expression of duodenal melatonin.
Epithelial melatonin staining was strongest in the colon and rectum. These same sections also displayed very strong epithelial expression of both MT1and MT2receptors. The MT1IR results
are in agreement with findings previously described for human colonic mucosa [27]. Recently, it was shown that very high doses of melatonin reduce epithelial paracellular permeability in rats and may prevent deleterious substances such as endotoxins from leaking in and causing inflam-mation [51]. An alleviating role has been ascribed to melatonin in the elusive interplay between different aggressive and protective factors in experimental colitis [52–54]. We tested the hypoth-esis that melatonin receptors and enzymes needed for synthhypoth-esis may be up-regulated in inflam-matory bowel disease compared to controls but found no large differences in mRNA expression. We did note small but significant changes in TDO2 (logFC = 0.22, p<0.01), IDO1
(logFC = 0.38, p = 0.0004) and DDC (logFC = -0.19, p = 0.000004). The cumulative effect of these changes indicates a shift in the tryptophan metabolism towards the kynurenine pathway.
The relationship between GI melatonin and circulating levels in the plasma appears to be bi-directional. It has been demonstrated that circulating melatonin and ingested melatonin accu-mulate in the GI tract [55,56]. In the gut, melatonin appears to act as a functional antagonist of serotonin [29] and dampens intestinal motility [30]. Accordingly, we found MT1and MT2
IR in both the submucosal and myenteric plexuses, which have both parasympathetic and sym-pathetic input. In vascular structures of the gut, weak MT1IR was seen in endothelial cells,
whereas more distinct MT2IR was found in vascular smooth muscle cells. In blood vessels,
melatonin activation of MT2causes vasodilation, while MT1mediates vasoconstriction [57].
There is also evidence that melatonin regulates endothelial permeability permitting leukocyte extravasation in the course of an immune challenge [58]. In support of this, melatonin and the MT2receptor were seen in mononuclear cells in the lamina propria. It has been suggested that
lymphocytes produce melatonin, which, in an autocrine and paracrine manner, promotes IL-2 production and proliferation of both T-cells and macrophages [58].
Melatonin IR in pancreatic islets was a surprising finding. Generally low TPH1 expression and some individuals with elevated levels, indicates that serotonin production may be regulated on the RNA level in the pancreas. Gene expression of TDO2 and IDO1 were higher in the whole pancreas samples compared to the islets. This finding is supported by data in the Human Protein Atlas where TDO2 and IDO1 are expressed primarily in the exocrine pancre-atic tissue (http://www.proteinatlas.org/ENSG00000151790-TDO2/tissue/pancreas) and (http://www.proteinatlas.org/ENSG00000131203-IDO1/tissue/pancreas).
cells and endocrine cells in colon mucosa. Insert shows neutralization test for melatonin. A-I: Magnification 100X. J) Strong melatonin IR in endocrine cells in pancreatic islets. Inset shows negative serotonin IR. K) Strong MT1receptor IR in endocrine cells in pancreatic islets. L) Strong MT2receptor IR in endocrine cells in
pancreatic islets and pancreatic ducts. (J-K: Magnification 200X).
Fig 3. Immunohistochemical staining of melatonin receptors in specific cell types.A) Positive melatonin receptor 1 (MT1) immunoreactivity (IR) in epithelial cells. B) Melatonin receptor 2 (MT2) IR in
epithelial cells. C) Arrow indicates negative MT1IR in the submucosal plexus. D) Arrow indicates positive
MT2IR in the submucosal plexus. E) Arrow indicates a cell showing positive MT1IR in the myenteric plexus;
indicates positive IR in muscle tissue. G) Large arrow indicates weak MT1IR in the endothelium of arterioles
and venules. H) Large arrow indicates MT2IR in the endothelium and smooth muscle of arterioles and
venules. Magnification 200X.
doi:10.1371/journal.pone.0120195.g003
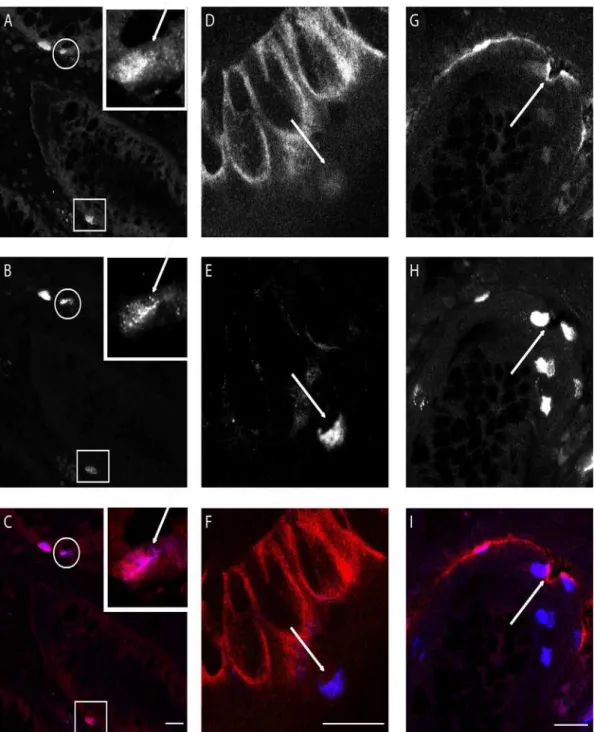
Fig 4. Confocal images of double immunofluorescence staining of crypts of Lieberkühn in ileum mucosa. A: Melatonin immunoreactive (IR) cells.B: Serotonin IR cells.C: MergeA-C; Inset: magnification of cell in circle. Arrow indicates structures positive for serotonin but not melatonin. Square indicates cell where melatonin IR is strong compared to serotonin IR.D: Melatonin receptor MT1IR in crypt epithelium.E: Serotonin IR cell.F: MergeD-F; Arrow indicates
serotonin IR cell negative for melatonin receptor MT1.G: Melatonin receptor MT2IR.H: Serotonin IR cells.I: MergeGI: Arrow indicates serotonin IR cell
positive for melatonin receptor MT2.White bar indicates 20μm.
Previous studies suggest that melatonin can be produced in pancreas. Gene expression of enzymes involved in the synthesis of melatonin, aralkylamine N-acetyltransferase and N-acet-ylserotonin O-methyltransferase, have been detected in rat pancreatic acinar cells [59] and human pancreas [60] giving support to our findings. It has also been shown that melatonin can influence transcription factors involved in insulin secretion in the pancreas in a receptor-de-pendent manner [61]. MT1and MT2were also demonstrated in pancreatic islets, which is in
agreement with melatonin’s newly described role in regulating circulating glucose levels via in-sulin and glucagon secretion [1–3]. The MT2IR was found to be the dominant expression,
which is a different result than previous studies of mRNA expression in human islets where MT1expression was suggested to be higher than MT2[2]. Our analyses of pancreas gene
ex-pression in three separate data sets performed on two different platforms and our IHC results are in agreement that the MT2expression levels exceed MT1. Notably, decreased melatonin
se-cretion is reported to increase the risk of developing type 2 diabetes [62], as well as genetic vari-ants of MT2that lead to impaired melatonin signaling [63]. MT1expression varied from strong
to absent in all sections available, and the reason for this variation is not clear.
Our study demonstrates the presence of melatonin and its receptors, MT1and MT2,
throughout the GI tract and in the pancreas. It seems that melatonin signaling may be auto-crine, paracrine and/or endocrine and the multiple roles ascribed to it are dependent on organ localization and physiological context. Our results are in agreement with conceivable actions of melatonin, which include regulation of GI motility, epithelial protection, epithelial permeabili-ty, vascular function as well as entero-pancreatic endocrine cross-talk with impact on metabol-ic control. Elucidating the role of melatonin receptors and regulation of their expression may help in understanding the previously described association between disturbances in melatonin signaling in GI and metabolic diseases.
Supporting Information
S1 Table. Gene expression data for key enzymes in tryptophan serotonin and melatonin metabolism and receptors for melatonin and serotonin in small intestinal epithelium and pancreas.
(DOCX)
S2 Table. Gene expression data for key enzymes in tryptophan serotonin and melatonin metabolism and receptors for melatonin and serotonin in pancreatic islets.
(DOCX)
Acknowledgments
The authors thank Åsa Forsberg for her excellent technical assistance and Prof. Bengt Gerdin and Prof. Eva Tiensuu Jansson at Uppsala University for providing work space. We thank Assoc. Prof. Valeria Giandomenico for fruitful scientific discussions. The Science for Life Labo-ratory BioVis and the Center for Image Analysis provided guidance in confocal imaging and image analysis. The Science for Life Laboratory Array and Analysis Facility provided assistance in the microarray analysis.
Author Contributions
References
1. Slominski RM, Reiter RJ, Schlabritz-Loutsevitch N, Ostrom RS, Slominski AT. Melatonin membrane re-ceptors in peripheral tissues: distribution and functions. Mol Cell Endocrinol, 2012. 351(2): p. 152–66. doi:10.1016/j.mce.2012.01.004PMID:22245784
2. Ramracheya RD, Muller DS, Squires PE, Brereton H, Sugden D, Huang GC, et al. Function and ex-pression of melatonin receptors on human pancreatic islets. J Pineal Res, 2008. 44(3): p. 273–9. doi: 10.1111/j.1600-079X.2007.00523.xPMID:18194202
3. Lyssenko V, Nagorny CL, Erdos MR, Wierup N, Jonsson A, Spegel P, et al. Common variant in MTNR1B associated with increased risk of type 2 diabetes and impaired early insulin secretion. Nat Genet, 2009. 41(1): p. 82–8. doi:10.1038/ng.288PMID:19060908
4. Bahr I, Muhlbauer E, Schucht H, Peschke E. Melatonin stimulates glucagon secretion in vitro and in vivo. J Pineal Res, 2011. 50(3): p. 336–44. doi:10.1111/j.1600-079X.2010.00848.xPMID:21244480
5. Calvo JR, Gonzalez-Yanes C, Maldonado MD. The role of melatonin in the cells of the innate immunity: a review. J Pineal Res, 2013. 55(2): p. 103–20. doi:10.1111/jpi.12075PMID:23889107
6. Wu CC, Lu KC, Lin GJ, Hsieh HY, Chu P, Lin SH, et al. Melatonin enhances endogenous heme oxyge-nase-1 and represses immune responses to ameliorate experimental murine membranous nephropa-thy. J Pineal Res, 2012. 52(4): p. 460–9. doi:10.1111/j.1600-079X.2011.00960.xPMID:22288898
7. Galano A, Tan DX, Reiter RJ. Melatonin as a natural ally against oxidative stress: a physicochemical ex-amination. J Pineal Res, 2011. 51(1): p. 1–16. doi:10.1111/j.1600-079X.2011.00916.xPMID:21752095
8. Galano A, Tan DX, Reiter RJ. On the free radical scavenging activities of melatonin's metabolites, AFMK and AMK. J Pineal Res, 2013. 54(3): p. 245–57. doi:10.1111/jpi.12010PMID:22998574
9. Janjetovic Z, Nahmias ZP, Hanna S, Jarrett SG, Kim TK, Reiter RJ, et al. Melatonin and its metabolites ameliorate ultraviolet B-induced damage in human epidermal keratinocytes. J Pineal Res, 2014. 57(1): p. 90–102. doi:10.1111/jpi.12146PMID:24867336
10. Slominski AT, Kleszczynski K, Semak I, Janjetovic Z, Zmijewski MA, Kim TK, et al. Local melatoniner-gic system as the protector of skin integrity. Int J Mol Sci, 2014. 15(10): p. 17705–32. doi:10.3390/ ijms151017705PMID:25272227
11. Das A, McDowell M, Pava MJ, Smith JA, Reiter RJ, Woodward JJ, et al. The inhibition of apoptosis by melatonin in VSC4.1 motoneurons exposed to oxidative stress, glutamate excitotoxicity, or TNF-alpha toxicity involves membrane melatonin receptors. J Pineal Res, 2010. 48(2): p. 157–69. doi:10.1111/j. 1600-079X.2009.00739.xPMID:20082663
12. Espino J, Bejarano I, Ortiz A, Lozano GM, Garcia JF, Pariente JA, et al. Melatonin as a potential tool against oxidative damage and apoptosis in ejaculated human spermatozoa. Fertil Steril, 2010. 94(5): p. 1915–7. doi:10.1016/j.fertnstert.2009.12.082PMID:20152967
13. Espino J, Bejarano I, Redondo PC, Rosado JA, Barriga C, Reiter RJ, et al. Melatonin reduces apoptosis induced by calcium signaling in human leukocytes: Evidence for the involvement of mitochondria and Bax activation. J Membr Biol, 2010. 233(1–3): p. 105–18. doi:10.1007/s00232-010-9226-9PMID: 20135104
14. Martin-Renedo J, Mauriz JL, Jorquera F, Ruiz-Andres O, Gonzalez P, Gonzalez-Gallego J. Melatonin induces cell cycle arrest and apoptosis in hepatocarcinoma HepG2 cell line. J Pineal Res, 2008. 45(4): p. 532–40. doi:10.1111/j.1600-079X.2008.00641.xPMID:19012662
15. Cucina A, Proietti S, D'Anselmi F, Coluccia P, Dinicola S, Frati L, et al. Evidence for a biphasic apoptotic pathway induced by melatonin in MCF-7 breast cancer cells. J Pineal Res, 2009. 46(2): p. 172–80. doi: 10.1111/j.1600-079X.2008.00645.xPMID:19175854
16. Meliska CJ, Martinez LF, Lopez AM, Sorenson DL, Nowakowski S, Kripke DF, et al. Antepartum de-pression severity is increased during seasonally longer nights: relationship to melatonin and cortisol timing and quantity. Chronobiol Int, 2013. 30(9): p. 1160–73. doi:10.3109/07420528.2013.808652 PMID:23998286
17. Fan L, Sun G, Ma T, Zhong F, Wei W. Melatonin overcomes apoptosis resistance in human hepatocel-lular carcinoma by targeting survivin and XIAP. J Pineal Res, 2013. 55(2): p. 174–83. doi:10.1111/jpi. 12060PMID:23679681
18. Bubenik GA. Thirty four years since the discovery of gastrointestinal melatonin. J Physiol Pharmacol, 2008. 59 Suppl 2: p. 33–51. PMID:18812627
19. Masana MI, Dubocovich ML. Melatonin receptor signaling: finding the path through the dark. Sci STKE, 2001. 2001(107): p. pe39. PMID:11698691
21. Smirnov AN. Nuclear melatonin receptors. Biochemistry (Mosc), 2001. 66(1): p. 19–26. PMID:11240388
22. Nosjean O, Ferro M, Coge F, Beauverger P, Henlin JM, Lefoulon F, et al. Identification of the melatonin-binding site MT3 as the quinone reductase 2. J Biol Chem, 2000. 275(40): p. 31311–7. PMID:10913150
23. Dubocovich ML, Markowska M. Functional MT1 and MT2 melatonin receptors in mammals. Endocrine, 2005. 27(2): p. 101–10. PMID:16217123
24. Sallinen P, Saarela S, Ilves M, Vakkuri O, Leppaluoto J. The expression of MT1 and MT2 melatonin re-ceptor mRNA in several rat tissues. Life Sci, 2005. 76(10): p. 1123–34. PMID:15620576
25. Sotak M, Mrnka L, Pacha J. Heterogeneous expression of melatonin receptor MT1 mRNA in the rat in-testine under control and fasting conditions. J Pineal Res, 2006. 41(2): p. 183–8. PMID:16879325
26. Stebelova K, Anttila K, Manttari S, Saarela S, Zeman M. Immunohistochemical definition of MT(2) re-ceptors and melatonin in the gastrointestinal tissues of rat. Acta Histochem, 2010. 112(1): p. 26–33. doi:10.1016/j.acthis.2008.03.004PMID:19004484
27. Nemeth C, Humpeler S, Kallay E, Mesteri I, Svoboda M, Rogelsperger O, et al. Decreased expression of the melatonin receptor 1 in human colorectal adenocarcinomas. J Biol Regul Homeost Agents, 2011. 25(4): p. 531–42. PMID:22217986
28. Sjoblom M, Safsten B, Flemstrom G. Melatonin-induced calcium signaling in clusters of human and rat duodenal enterocytes. Am J Physiol Gastrointest Liver Physiol, 2003. 284(6): p. G1034–44. PMID: 12584110
29. Thor PJ, Krolczyk G, Gil K, Zurowski D, Nowak L. Melatonin and serotonin effects on gastrointestinal motility. J Physiol Pharmacol, 2007. 58 Suppl 6: p. 97–103. PMID:18212403
30. Konturek SJ, Konturek PC, Brzozowska I, Pawlik M, Sliwowski Z, Czesnikiewicz-Guzik M, et al. Locali-zation and biological activities of melatonin in intact and diseased gastrointestinal tract (GIT). J Physiol Pharmacol, 2007. 58(3): p. 381–405. PMID:17928638
31. Huether G. Melatonin synthesis in the gastrointestinal tract and the impact of nutritional factors on circu-lating melatonin. Ann N Y Acad Sci, 1994. 719: p. 146–58. PMID:8010590
32. Bubenik GA, Pang SF, Cockshut JR, Smith PS, Grovum LW, Friendship RM, et al. Circadian variation of portal, arterial and venous blood levels of melatonin in pigs and its relationship to food intake and sleep. J Pineal Res, 2000. 28(1): p. 9–15. PMID:10626596
33. Rojdmark S, Wetterber L. Short-term fasting inhibits the nocturnal melatonin secretion in healthy man. Clin Endocrinol (Oxf), 1989. 30(4): p. 451–7. PMID:2598477
34. Bubenik GA, Ball RO, Pang SF. The effect of food deprivation on brain and gastrointestinal tissue levels of tryptophan, serotonin, 5-hydroxyindoleacetic acid, and melatonin. J Pineal Res, 1992. 12(1): p. 7– 16. PMID:1373446
35. Sjoblom M, Flemstrom G. Melatonin in the duodenal lumen is a potent stimulant of mucosal bicarbonate secretion. J Pineal Res, 2003. 34(4): p. 288–93. PMID:12662352
36. Wolden-Hanson T, Mitton DR, McCants RL, Yellon SM, Wilkinson CW, Matsumoto AM, et al. Daily mel-atonin administration to middle-aged male rats suppresses body weight, intraabdominal adiposity, and plasma leptin and insulin independent of food intake and total body fat. Endocrinology, 2000. 141(2): p. 487–97. PMID:10650927
37. Mustonen AM, Nieminen P, Hyvarinen H. Preliminary evidence that pharmacologic melatonin treatment decreases rat ghrelin levels. Endocrine, 2001. 16(1): p. 43–6. PMID:11822826
38. Barrett T, Wilhite SE, Ledoux P, Evangelista C, Kim IF, Tomashevsky M, et al. NCBI GEO: archive for functional genomics data sets—update. Nucleic Acids Res, 2013. 41(Database issue): p. D991–5. doi: 10.1093/nar/gks1193PMID:23193258
39. Leja J, Essaghir A, Essand M, Wester K, Oberg K, Totterman TH, et al. Novel markers for enterochro-maffin cells and gastrointestinal neuroendocrine carcinomas. Mod Pathol, 2009. 22(2): p. 261–72. doi: 10.1038/modpathol.2008.174PMID:18953328
40. Pei H, Li L, Fridley BL, Jenkins GD, Kalari KR, Lingle W, et al. FKBP51 affects cancer cell response to chemotherapy by negatively regulating Akt. Cancer Cell, 2009. 16(3): p. 259–66. doi:10.1016/j.ccr. 2009.07.016PMID:19732725
41. Badea L, Herlea V, Dima SO, Dumitrascu T, Popescu I. Combined gene expression analysis of whole-tissue and microdissected pancreatic ductal adenocarcinoma identifies genes specifically overex-pressed in tumor epithelia. Hepatogastroenterology, 2008. 55(88): p. 2016–27. PMID:19260470
42. Irizarry RA, Hobbs B, Collin F, Beazer-Barclay YD, Antonellis KJ, Scherf U, et al. Exploration, normali-zation, and summaries of high density oligonucleotide array probe level data. Biostatistics, 2003. 4(2): p. 249–64. PMID:12925520
44. Taneera J, Lang S, Sharma A, Fadista J, Zhou Y, Ahlqvist E, et al. A systems genetics approach identi-fies genes and pathways for type 2 diabetes in human islets. Cell Metab, 2012. 16(1): p. 122–34. doi: 10.1016/j.cmet.2012.06.006PMID:22768844
45. Noble CL, Abbas AR, Cornelius J, Lees CW, Ho GT, Toy K, et al. Regional variation in gene expression in the healthy colon is dysregulated in ulcerative colitis. Gut, 2008. 57(10): p. 1398–405. doi:10.1136/ gut.2008.148395PMID:18523026
46. Uhlen M, Oksvold P, Fagerberg L, Lundberg E, Jonasson K, Forsberg M, et al. Towards a knowledge-based Human Protein Atlas. Nat Biotechnol, 2010. 28(12): p. 1248–50. doi:10.1038/nbt1210-1248 PMID:21139605
47. Ross AW, Webster CA, Thompson M, Barrett P, Morgan PJ. A novel interaction between inhibitory mel-atonin receptors and protein kinase C-dependent signal transduction in ovine pars tuberalis cells. En-docrinology, 1998. 139(4): p. 1723–30. PMID:9528955
48. Barrett P, Davidson G, Hazlerigg DG, Morris MA, Ross AW, Morgan PJ. Mel 1a melatonin receptor ex-pression is regulated by protein kinase C and an additional pathway addressed by the protein kinase C in-hibitor Ro 31–8220 in ovine pars tuberalis cells. Endocrinology, 1998. 139(1): p. 163–71. PMID:9421411
49. Lanfumey L, Mongeau R, Hamon M. Biological rhythms and melatonin in mood disorders and their treatments. Pharmacol Ther, 2013. 138(2): p. 176–84. doi:10.1016/j.pharmthera.2013.01.005PMID: 23348014
50. Lungwitz E, Gannon RL. Serotonin1A-mediated amplification of light-induced phase advances of circa-dian rhythms in the Syrian hamster: post-light effects. Brain Res, 2009. 1250: p. 157–63. doi:10.1016/ j.brainres.2008.11.010PMID:19041294
51. Sommansson A, Nylander O, Sjoblom M. Melatonin decreases duodenal epithelial paracellular perme-ability via a nicotinic receptor-dependent pathway in rats in vivo. J Pineal Res, 2012.
52. Tahan G, Gramignoli R, Marongiu F, Aktolga S, Cetinkaya A, Tahan V, et al. Melatonin expresses power-ful anti-inflammatory and antioxidant activities resulting in complete improvement of acetic-acid-induced colitis in rats. Dig Dis Sci, 2011. 56(3): p. 715–20. doi:10.1007/s10620-010-1364-5PMID:20676767
53. Chojnacki C, Wisniewska-Jarosinska M, Kulig G, Majsterek I, Reiter RJ, Chojnacki J. Evaluation of en-terochromaffin cells and melatonin secretion exponents in ulcerative colitis. World J Gastroenterol, 2013. 19(23): p. 3602–7. doi:10.3748/wjg.v19.i23.3602PMID:23801861
54. Sayyed HG, Jaumdally RJ, Idriss NK, El Sers DA, Blann A. The effect of melatonin on plasma markers of inflammation and on expression of nuclear factor-kappa beta in acetic acid-induced colitis in the rat. Dig Dis Sci, 2013. 58(11): p. 3156–64. doi:10.1007/s10620-013-2811-xPMID:23925818
55. Messner M, Hardeland R, Rodenbeck A, Huether G. Tissue retention and subcellular distribution of continuously infused melatonin in rats under near physiological conditions. J Pineal Res, 1998. 25(4): p. 251–9. PMID:9885995
56. Bubenik GA. Localization, physiological significance and possible clinical implication of gastrointestinal melatonin. Biol Signals Recept, 2001. 10(6): p. 350–66. PMID:11721091
57. Masana MI, Doolen S, Ersahin C, Al-Ghoul WM, Duckles SP, Dubocovich ML, et al. MT(2) melatonin receptors are present and functional in rat caudal artery. J Pharmacol Exp Ther, 2002. 302(3): p. 1295–302. PMID:12183692
58. Radogna F, Diederich M, Ghibelli L. Melatonin: a pleiotropic molecule regulating inflammation. Bio-chem Pharmacol, 2010. 80(12): p. 1844–52. doi:10.1016/j.bcp.2010.07.041PMID:20696138
59. Jaworek J, Konturek SJ, Tomaszewska R, Leja-Szpak A, Bonior J, Nawrot K, et al. The circadian rhythm of melatonin modulates the severity of caerulein-induced pancreatitis in the rat. J Pineal Res, 2004. 37(3): p. 161–70. PMID:15357660
60. Jaworek J, Nawrot-Porabka K, Leja-Szpak A, Bonior J, Szklarczyk J, Kot M, et al. Melatonin as modula-tor of pancreatic enzyme secretion and pancreatoprotecmodula-tor. J Physiol Pharmacol, 2007. 58 Suppl 6: p. 65–80. PMID:18212401
61. Bazwinsky-Wutschke I, Wolgast S, Muhlbauer E, Albrecht E, Peschke E. Phosphorylation of cyclic AMP-response element-binding protein (CREB) is influenced by melatonin treatment in pancreatic rat insulinoma beta-cells (INS-1). J Pineal Res, 2012. 53(4): p. 344–57. doi:10.1111/j.1600-079X.2012. 01004.xPMID:22616931
62. McMullan CJ, Schernhammer ES, Rimm EB, Hu FB, Forman JP. Melatonin secretion and the incidence of type 2 diabetes. JAMA, 2013. 309(13): p. 1388–96. doi:10.1001/jama.2013.2710PMID:23549584