The hepatic ectonucleotide pyrophosphatase/
phosphodiesterase 1 gene mRNA abundance is
reduced by insulin and induced by dexamethasone
Huiwen Ma
2, Ping Wang
3, Dan Jin
4, Ting Jia
1, Hong Mao
1, Jiandi Zhang
5and Shi Zhao
1 1Department of Endocrinology, Wuhan Central Hospital, Wuhan, Hubei, China 2
Yantai Center for Animal Disease Control, Yantai, Shandong, China 3
Department of Anesthesiology, Shandong Provincial Hospital, Jinan, Shandong, China 4
Department of Laboratory Medicine, Hubei University of Chinese Medicine, Wuhan, Hubei, China 5
Yantai Zestern Biotechnique Co. Ltd., Yantai, Shandong, China
Abstract
Hormones regulate hepatic gene expressions to maintain metabolic homeostasis. Ectonucleotide pyrophosphatase/ phosphodiesterase 1 has been thought to interfere with insulin signaling. To determine its potential role in the regulation of metabolism, we analyzed its gene (Enpp1) expression in the liver of rats experiencing fasting and refeeding cycles, and in primary rat hepatocytes and human hepatoma HepG2 cells treated with insulin and dexamethasone using northern blot and real-time PCR techniques. HepaticEnpp1expression was induced by fasting and reduced by refeeding in the rat liver. In primary rat hepatocytes and HepG2 hepatoma cells, insulin reduced Enpp1mRNA abundance, whereas dexamethasone induced it. Dexamethasone disrupted the insulin-reducedEnpp1expression in primary hepatocytes. This is in contrast to the responses of the expression of the cytosolic form of phosphoenolpyruvate carboxykinase gene to the same hormones, where insulin reduced it significantly in the process. In addition, the dexamethasone-inducedEnpp1gene expression was attenuated in the presence of 8-Br-cAMP. In conclusion, we demonstrated for thefirst time that hepaticEnpp1is regulated in the cycle of fasting and refeeding, a process that might be attributed to insulin-reducedEnpp1expression. This insulin-reduced Enpp1
expression might play a role in the development of complications in diabetic patients.
Key words: Ectonucleotide pyrophosphatase/phosphodiesterase 1; Insulin; Dexamethasone; Hepatocytes; Regulation of gene expression
Introduction
Rapid global economic development and improvement of living standards is associated with the increasing inci-dence of obesity and other human metabolic diseases, such as type 2 diabetes (1), which has become a public health concern. Human obesity and type 2 diabetes are associated with profound changes of hepatic lipid and glucose metabolism, attributed partially to the altered expression of hepatic genes (2). Insulin is essential for the control of blood glucose homeostasis, partly through the regulation of gene expressions in a variety of tissues and organs.
It has been shown that insulin-regulated gene expres-sion contributes to glycolysis, glycogenesis, lipogenesis (fatty acid biosynthesis), and gluconeogenesis (glucose production) in the liver. For instance, insulin increases the hepatic expression of glucokinase gene (Gck) (3), thefirst enzyme for hepatic glycolysis. On the other hand, insulin
reduces the expression of the cytosolic form of phos-phoenolpyruvate carboxykinase gene (Pck1) (4), the rate limiting enzyme for gluconeogenesis. In addition, the hepatic expression ofPck1gene can be induced by glucocorticoids and activation of protein kinase A pathway (4). The development of insulin resistance is associated with the disruption of insulin-regulated hepatic gene expression (5). Therefore, understanding the mechanism of insulin resist-ance is urgent.
One protein that has been implicated to cause insulin resistance is ectonucleotide pyrophosphatase/phospho-diesterase 1 (ENPP1) or plasma cell membrane glyco-protein 1, which is thought to hydrolyze ATP to generate inorganic pyrophosphate (PPi) plus AMP or inorganic phosphate (Pi) plus ADP (6). ENPP1 is a member of nucleotide pyrophosphatases/phosphodiesterases family with 5 members, and it can exist as a soluble form (7).
Correspondence: Shi Zhao:<[email protected]>
Additionally, it has been shown that ENPP1 isolated from the mouse liver also catalyzes the hydrolysis of 2030
-cGAMP (8). The main physiological function of ENPP1 has been related to bone mineralization, asEnpp1/ mice demonstrate defects in bone mineralization process (9,10). Mutations within this gene lead to artery calcification (11). Another member of the family, ENPP2, also known as autotaxin, has been considered a secreted lysophospholi-pase D that is produced in adipocytes and is responsible for the synthesis of lysophosphatidic acid. ENPP2 has been implied to affect insulin sensitivity and induce development of obesity (12).
Originally, ENPP1 was identified as an antigen to analyze the specificity of polyclonal allo-antisera raised in DBA/2 mice against the BALB/c myeloma cell line MOPC-70A (13). In that study, positive interactions of the antiserum with antigens in the homogenates of liver, brain, spleen, kidney, and lymph node cells were observed (13). An immunohistochemistry study also showed that ENPP1 can be detected in these tissues (14). Genetic variations and polymorphisms of ENPP1 have been associated with insulin resistance in human subjects (15,16). However, a study including 8,089 UK Caucasians with type 2 diabetes and obesity did not find association between variants of ENPP1 and these diseases (17).
On the other hand, experimental results have indicated that ENPP1 might contribute to insulin resistance. Trans-genic mice over-expressing the human ENPP1 driven by the CMV promoter had hyperglycemia and hyperinsulinemia with impaired glucose tolerance test, and reduced glucose uptake in the muscle (18). Elevated ENPP1 protein level and alkaline phosphodiesterase I activity were reported in liver, muscle, and brain, but not adipose tissue (18). When recombinant adenovirus was used to express human ENPP1, its over-expression in the liver caused the impair-ment of glucose tolerance test, reduction of insulin signaling, and elevation of mRNA abundance levels of gluconeogenic genes (19). The mechanism of ENPP1 action has been attributed to its interaction with the insulin receptorasubunit in MCF-7 cells (20). However, this view was challenged as in NIH-3T3 fibroblasts with stable overexpression of insulin receptor, neither wild-type ENPP1 nor the K173Q mutant in transiently transfected condition has the ability to interact with insulin receptor (21). Moreover, the over-expression of ENPP1 did not change the insulin receptor autophospho-rylation status shown in immunoblot (21).
Given the fact that ENPP1 is detected in the liver and its hepatic over-expression leads to insulin resistance, we aimed to investigate the regulation of hepaticEnpp1
expression.
Material and Methods
General reagents
Various cell culture reagents, including DMEM medium, M199 medium, sodium penicillin, streptomycin sulfate, fetal
bovine serum, MEM medium, and RNase-free DNase were purchased from Thermo Fisher Scientific (USA). Liver perfusion buffer and liver digestion buffer were obtained from Invitrogen, currently Thermo Fisher Scientific. Dex-amethasone, 8-bromoadenosine 30,50-cyclic
monophos-phate (8-Br-cAMP, cell permeable cAMP analog), 3,30,
5-tri-iodothyronine (T3), insulin, RNA loading buffer, and formamide were purchased from Sigma (USA). Reagents for cDNA synthesis and 2 SYBR Green PCR Master
Mix were obtained from Applied Biosystems (USA). RNA STAT 60 was from TEL-TEST Inc. (USA). Rat tail collagen I-coated 60-mm dishes were obtained from BD Biosciences Discovery Labware (USA).
Animal maintenance and studies
Male Sprague-Dawley rats were obtained from the animal laboratory at Tongji Medical College (Wuhan, China) for the fasting and refeeding study, and from Harlan Breeders (USA) for hepatocyte isolation as published previously (22). They were housed in colony cages, maintained on a 12-h light/12-h dark cycle. All animal experiments were performed with the approval of Institutional Animal Care and Research Advisory Committee of respective institutions.
For the fasting and refeeding studies, two studies were conducted. In experiment #1, four Sprague-Dawley rats (200–250 g) were fasted for 36 h. Then, 2 animals received
the chow diet for 12 h, and the remaining 2 were fasted during this period. In experiment #2, 15 Sprague-Dawley rats at around 250 g were divided into three groups, ad libitum, fasting and refeeding groups. For fasting and refeeding groups, rats were fasted for 36 h and then the refeeding group received a chow diet for 12 h while the fasting group remained fasted during this period. Rats in ad libitum group had free access to the diet during the exper-iment period. All experexper-imental animals had free access to water during the experimental period before euthanasia.
Cell culture
HepG2 cells were maintained in MEM supplemented with 10% fetal bovine serum, 100 units/mL sodium penicillin, and 100mg/mL streptomycin sulfate before they were set up for experiments.
Rat primary hepatocytes were isolated from non-fasting 250-g Sprague-Dawley male rats by the collagenase method with minor modifications. Animals were anesthe-tized with halothane, and each liver was perfusedin situ
100 units/mL of penicillin, and 100mg/mL of streptomycin. The cells were pelleted and washed twice at 4°C with the same buffer. Aliquots of 2106cells were plated onto 60-mm rat collagen I-coated dishes (BD Biosciences Discovery Labware) in the same DMEM supplemented with 5% (v/v) fetal calf serum, 100 nM tri-iodothyronine, 100 units/mL penicillin, 100 mg/mL streptomycin, and 0.1 mg/mL gentamycin. After incubation for 3 to 4 h, the attached cells were washed once with 4 mL of PBS, and incubated in medium 199 supplemented with 100 nM dexamethasone, 100 nM T3, 100 units/mL penicillin, and 100mg/mL streptomycin sulfate plus 1 nM insulin for 14–16 h
until being used for the indicated experiments. Cell viability, as measured by trypan blue exclusion, was always greater than 85%. After incubation for 16 h, the cells were ready for treatment.
RNA isolation and DNase treatment
To isolate RNA from cultured cells, culture media were removed from culture dishes by aspiration. For each 60-mm dish, 1 mL of RNA STAT 60 was added and swirled to insure coverage. Dishes were kept at room temperature for at least 10 min. Lysates were transferred into 1.5 mL micro-centrifuge tubes by scraping. After adding 0.2 mL of chloroform, the tube was shaken vigorously for 15 s and kept at room temperature for at least 2 min. Samples were spun at about 16,000 g for 20 min in a desktop micro-centrifuge at 4°C. About 0.5 mL of upper phase was trans-ferred into a fresh 1.5 mL micro-centrifuge tube containing 0.5 mL of 100% isopropanol. Total RNA was precipitated by centrifugation at 16,000gfor 20 min at 4°C. RNA pellet was washed twice with 1 mL of 70% ethanol and dissolved in 88mL of nuclease-free water. To remove contaminated DNA, total RNA was treated with 4 units of RNase-free DNase for 30 min at 37°C in a final reaction volume of 100 mL. The buffer condition is 10 mM Tris-HCl pH 7.5, 2.5 mM MgCl2and 0.5 mM CaCl2. After DNase digestion, 10mL of DNase inactivation resin was added, mixed and spun down. The DNA-free RNA was transferred into a fresh microcentrifuge tube and its RNA content was determined by Spectronic Genesys 5 spectrophotometer (Thermo Fisher Scientific). The total liver RNA samples were extracted and pooled together for northern blot analysis. RNA samples were stored at–80°C until used.
Northern blot analysis
Methods for northern blot have been described pre-viously (23). Briefly, about 20 mg of total RNA was suspended into RNA loading buffer, separated by 1% agarose-formaldehyde gel and transferred onto nylon membrane (Hybond-N+). For preparation ofEnpp1probe, PCR primers, 50-GAAAGACCACACTTTTACACTC-30
(for-ward) and 50-TTACAACTGCCTTGTTCCATGCC-30(reverse),
derived from ratEnpp1mRNA sequence (NCBI Reference Sequence: NM_053535.1) were used to amplify rat hepatic cDNA. The resulting amplicon of 211 bp containingEnpp1
mRNA sequence was inserted into the TA cloning vector pCR2.1 (Thermo Fisher Scientific). The plasmid was cut with EcoRI to release the insert, which was purified on agarose gels. The cDNA probes for detecting apolipopro-tein E (Apoe), fatty acid synthase (Fas), Gck, insulin-like growth factor-binding protein (Igfbp-1), and Pck1 genes have been published previously (23). The cDNA probes were labeled with [a-32P] dCTP using a random primer labelling kit (GE Healthcare Life Sciences, USA). Hybridi-zation was performed at 65°C in ExpressHyb hybridiza-tion soluhybridiza-tion (BD Bioscience Clontech, USA) according to the manufacturer’s instructions. Membranes were exposed to an X-ray film at either 25°C or –80°C to
obtain the bands.
cDNA synthesis and quantitative real-time PCR
First strand cDNA was synthesized from 2mg of DNA-free RNA with random hexamer primers using the cDNA synthesis kit in a final volume of 100 mL. The levels of mRNA transcripts were measured by quantitative real-time PCR. The sequences of primer sets used are for ratEnpp150-CCAAGTCATCCCAAAGAAGAG-30(forward)
and 50-GAAGTCCATGATCGGCACAA-30 (reverse); for rat
36B4 (acidic ribosomal phosphoprotein, P0) 50-TTCCCACT
GGCTGAAAAGGT-30(forward) 50
-CGCAGCCGCAAATGC-30 (reverse); for human ENPP1 primer 50-CGATTTTGCC
GATTGAGGATT-30 (forward) and 50-AAACTGGTGCTGG
GAAAGAAGACA-30 (reverse); for human 36B4 primer 50
-AACATGCTCAACATCTCCCC-30 (forward) and 50-CCGAC
TCCTCCGACTCTTC-30(reverse). Each real-time PCR
reac-tion contains, in afinal volume of 14mL, cDNA from 14 ng of reverse transcribed total RNA, 2.33 pmol forward and reverse primers, and 7 mL of 2 SYBR Green PCR Master Mix (Applied Biosystems). PCR was carried out in 96-well plates using the 7300 Real Time PCR System (Applied Biosys-tems). All reactions were done in triplicate. The PCR conditions are 50°C for 2 min, 95°C for 10 min, followed by 40 cycles of 95°C for 15 s and 60°C for 1 min. The relative amounts of all transcripts in real-time PCR experi-ment were calculated using the comparative CT method as described earlier (5) using 36B4 as the invariant control. The contents of 36B4 and Enpp1 transcripts at time 0 were arbitrarily assigned as 1.
Statistical analysis
Statistical analysis was performed using the SPSS (version 11.0, SPSS Inc, USA). Data are reported as means±SE. The number of experiments represented
Results
The experimental groups are shown in Figure 1A. Compared with fasting state, the hepatic Enpp1 mRNA level in the refeeding state dropped significantly. As the invariable control gene, the mRNA levels ofApoegene did not change. This observation was further confirmed with other rats under ad libitum, fasting, and refeeding condi-tions as shown in Figure 1B. The success of the fasting and refeeding procedure was confirmed by examining the expression levels of the cytosolic form ofPck1,Fas,Igfbp-1
andGckgenes, which are known to be regulated during the cycle of fasting and refeeding (23). Consistent with the results in the literature (4), the mRNA levels ofPck1
andIgfbp-1genes were indeed up-regulated in the fasting state, and they were reduced after refeeding for 12 h. On the other hand, the mRNA levels of Gck and Fas were reduced in the fasting state and increased significantly after refeeding. As the invariable control, the mRNA levels ofApoe gene in ad libitum, fasting, and refeeding states were not different from each other.
Figure 2A shows that the treatments of insulin and insulin combined with T3 for 6 h significantly reduced the
Enpp1 expression whereas T3 alone did not affect its expression. On the other hand, the presence of dexa-methasone appeared to disturb the insulin-reducedEnpp1
expression, suggesting the potential role of dexamethasone on the induction of hepatic Enpp1expression. Indeed, the northern blot data shown in Figure 2B demonstrated that the
Enpp1mRNA level was either slightly reduced or increased in primary hepatocytes treated with 100 nM insulin or 100 nM dexamethasone for 12 h, respectively. As expected, insulin and dexamethasone respectively reduced and induced the
Pck1expression in the same experiment. The treatment of 100 nM dexamethasone inducedEnpp1expression even in the presence of 100 nM insulin, while thePck1expression was inhibited under the same treatment. These results demonstrated the dominant role of dexamethasone in the induction of hepaticEnpp1expression.
To further examine the role of dexamethasone in the induction of Enpp1expression, we measured its expres-sion in primary rat hepatocytes treated with increasing concentrations of dexamethasone (0, 1, 10, and 100 nM) and either 20 nM 8-Br-cAMP or 20 nM 8-Br-cAMP with 100 nM dexamethasone for 6 h. As shown in Figure 3A, dexamethasone at 100 nM, but not 1 and 10 nM, induced the Enpp1 expression, confirming the data shown in Figure 2A. However, this induction was blunted in the presence of 20 nM 8-Br-cAMP, which itself did not affect theEnpp1expression. Figure 3B shows that dexametha-sone induced Enpp1 expression as early as 4 h, and this induction remained for at least 16 h in the current experimental settings.
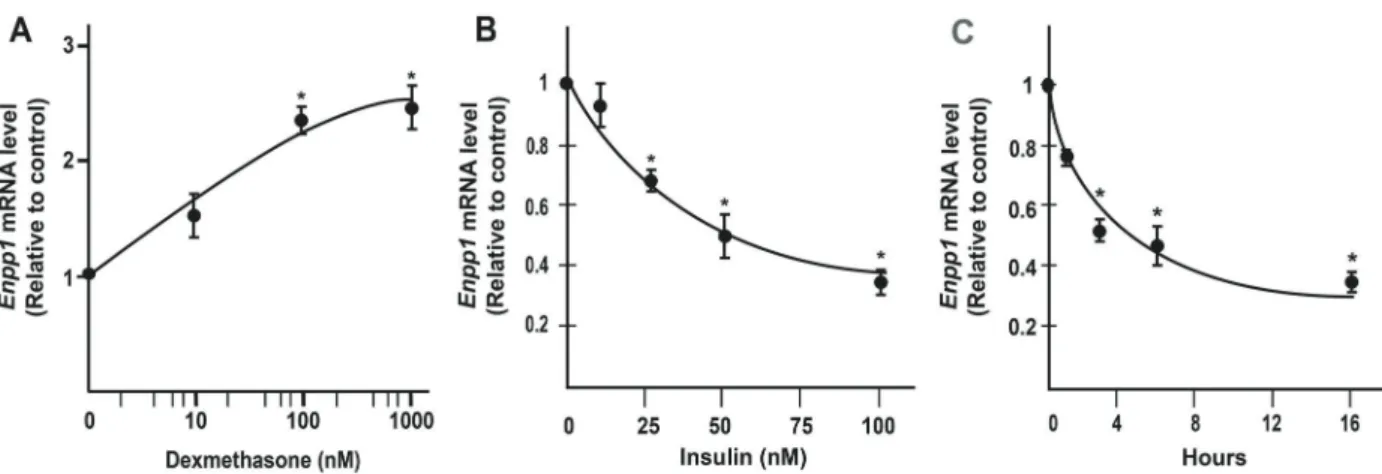
To determine whether the observed hormonal regula-tions are not limited to primary rat hepatocytes, we used real-time PCR to examine the effects of insulin and dex-amethasone on the Enpp1mRNA abundance in HepG2 cells, a human hepatoma cell line. HepG2 cells have been known for their response to insulin treatment, and have been widely used in metabolic studies. In fact, a recent search of HepG2 and insulin yielded more than 1000 papers in PubMed database. Cells were treated with increasing concentrations of dexamethasone (Figure 4A) or insulin (Figure 4B) for 12 h. As shown in Figure 4A, consistent with our observations in rat primary hepatocytes, the Enpp1
mRNA level in HepG2 cells started to be induced in a dose-dependent manner by dexamethasone at 100 and 1000 nM, but not at 10 nM. In addition, its expression began to be reduced in a dose-dependent manner by insulin at 25 nM with half maximal inhibition at 50 nM insulin. In the same experiment, the Pck1 mRNA abundance started to be reduced in a dose-dependent manner by insulin at 5 nM and more. Figure 4C shows the time course of insulin-mediated suppression of Enpp1 mRNA in HepG2 cells. Insulin treatment significantly reducedEnpp1expression as early as 3 h, and reduced totalEnpp1mRNA abundance level by 60% at 16 h.
Discussion
In this study, the mRNA expression level ofEnpp1was examined in the liver samples of rats going through fasting
and refeeding cycles, and in primary rat hepatocytes and human hepatoma cells treated with insulin and dexa-methasone. The fact that the rat liver expressesEnpp1is consistent with the original observation that the ENPP1 antiserum recognized certain antigens in the homogenate of the mouse liver (13). The results of in vivo animal studies prompted us to further investigate the roles of hormones such as insulin and dexamethasone in the regulation of Enpp1 expression as these hormones are major players in the regulation of expressions of hepatic genes for the glucose and lipid metabolism The Enpp1
mRNA level was clearly up-regulated by dexamethasone and inhibited by insulin treatments in primary rat hepato-cytes and HepG2 human hepatoma cells. In addition, the activation of the cAMP pathway also seems to attenuate the dexamethasone-induced Enpp1 expression, demon-strating the complexity ofEnpp1regulation.
In hepatocytes, insulin regulates the expression levels of a variety of genes that are important for the control of hepatic glucose and lipid metabolism. As the enzymatic activity of ENPP1 seems to be needed for its inhibitory effect on insulin signaling (24), the suppression ofEnpp1
mRNA abundance by insulin in primary rat hepatocytes and human hepatoma cells was expected. Insulin-reduced gene expression has been attributed to a heptanucleotide
sequence, TGTTTTG, in promoter of genes such asPck1
and insulin-receptor substrate 2 as shown in Zhang et al. (22). After looking through the genomic sequence of human
ENPP1 gene promoter, we found one heptanucleotide. Whether this element is responsible for the insulin-mediated suppression of Enpp1 gene expression remains to be determined. This insulin-reduced Enpp1 expression may facilitate the transduction of insulin signals in hepatocytes. Indeed, when a recombinant adenovirus expressing a short hairpin RNA against mouse ENPP1 to reduce its expres-sion was introduced todb/dbmice, the treatment success-fully reduced plasma glucose levels and improved the oral glucose tolerance test, suggesting the improvement of insulin sensitivity in those animals (25).
The inhibitory effect of insulin on Enpp1 expression is not as robust as that onPck1expression as shown in this study. This is especially obvious when the insulin-reduced expressions of both of them are compared in the presence of other hormonal and signal transduction pathways (Figures 2 and 3). The presence of insulin completely blunted dexamethasone-induced Pck1 ex-pression, but not Enpp1 expression. Interestingly, the dexamethasone-induced Enpp1 expression is disturbed when the protein kinase A pathway is activated, a result of increased intracellular cAMP level. As shown in Figure 3B,
the treatment of 20 nM 8-Br-cAMP alone did not affect the
Enpp1in hepatocytes. However, the presence of 20 nM 8-Br-cAMP prevented the dexamethasone-inducedEnpp1
expression in the same experiment. All these results indicated that the hepatic expression of Enpp1 can be affected positively and negatively by multiple hormonal pathways. The expression of Enpp1 in response to the cycle of fasting and refeeding probably is the combined effect of multiple hormonal pathways. The underlying regulatory mechanism ofEnpp1expression in hepatocytes deserves further investigation, especially in the context of metabolic diseases such as obesity and diabetes.
Another interesting observation is the lack of synergistic effect of cAMP and dexamethasone in the regulation of
Enpp1expression. In fact, the synergistic effect of cAMP
and dexamethasone are commonly observed in a series of insulin-regulated genes such as Pck1(26). However,
Enpp1 expression level was clearly not up-regulated by the co-treatment of 8-Br-cAMP and dexamethasone, as shown in Figure 3B. The presence of 8-Br-cAMP antago-nized the dexamethasone effect on Enpp1 expression, while these two synergized to induce thePck1expression in the same experiment. This observation again empha-sizes the complicated hormonal regulation of Enpp1 in the context of various metabolic states including obesity and diabetes. Chronic human metabolic diseases such as obesity and type 2 diabetes are always associated with insulin resistance and profound changes of glucose and lipid metabolic homeostasis (2). As ENPP1 has been implied to interfere with insulin signaling, it is reasonable to suggest that ENPP1 or its family members such as ENPP2 (12) play roles in the pathophysiological changes associated with insulin resistance such as hyperglycemia through elevated hepatic gluconeogenesis. Our data indi-cated that insulin and dexamethasone, the two hormones involved in hepatic glucose and lipid metabolism, regulate the hepatic Enpp1 gene expression. This mutual infl u-ence and regulation between insulin and ENPP1 seem to further suggest that ENPP1 might contribute to insulin resistance through the down-regulation of insulin action and promoting hepatic gluconeogenesis. These hypoth-eses all remain to be investigated.
It is worth noting that in one study, ENPP1 protein level was not linked with endogenous insulin level (27). In that study, the expression level of ENPP1 protein in normal individuals was compared with that in insulinoma patients who were shown to have persistently high levels of endog-enous insulin. The normal individuals were further separated into healthy, insulin resistant, and healthy insulin-sensitive individuals based on the rate of insulin-stimulated glucose disposal (M value). There was no statistical difference in endogenous ENPP1 protein levels between insulinoma patients and healthy insulin-sensitive individuals.
One potential limitation of this study is that all the biopsies were likely obtained during the fasting state, a prerequisite for most surgical operations. At this state, insulin was at its lowest level in both groups, and it is difficult to demonstrate any regulatory effect of insulin on theEnpp1
expression in either group, especially among insulin-sensitive individuals. In addition, unlike the normal individuals, the endogenous ENPP1 protein levels were similar among insulinoma patients except in one case, consistent with our hypothesis of the suppressive effect of high level of endogenous insulin onEnpp1expression in these patients. In addition,Enpp1/ mice demonstrate defects in
bone mineralization and health (9,10). In osteosarcoma cells, basicfibroblast growth factor induces the expression level of ENPP1 (28).Enpp1gene expression can also be upregulated by tumor growth factorbin chondrocytes and osteoblasts, a process that can be inhibited by interleukin-1bas reviewed by Goding et al. (29). On the other hand,
insulin has been considered an anabolic signal in bone development (30). Insulin-like growth factor 1 (IGF-1) signal-ing pathway also plays a critical role in the development of chondrocytes and functions of osteoblasts such as energy metabolism, which in turn regulates bone remodeling and skeletal physiology as reviewed by Guntur et al. (31). Interestingly, insulin signaling pathway is also observed in osteoblasts and is critical for bone remodeling and energy metabolism (32,33). As IGF-1 and insulin signaling path-ways share common components (31), they may contribute to bone health through the regulation ofEnpp1expression or activity directly or indirectly.
ENPP1 plays a role in the production of extracellular PPi, which regulates bone density. There are some interesting observations regarding aberrant bone mineral densities in diabetic patients (34). Low bone density is commonly observed in type 1 and some later stage type 2 diabetic patients while increased vascular calcification and bone mineral density is documented in type 2 diabetic patients. If we assume that this insulin-regulated ENPP1 expression exists in cells responsible for bone health, we probably can come up with a hypothesis to explain part of the bone health problems in patients with diabetes.
As shown in Figure 5A, the deficiency of insulin and elevation of glucocorticoids in patients with type 1 diabetes may lead to increasedEnpp1expression, resulting in the accumulation of PPi. As an antagonist of bone ment, accumulated PPi interferes with the bone develop-mental process in these patients, leading to reduced bone mineral density (35,36). However, this could not be used to explain the increased bone density in patient with type 2 diabetes. As it has been reviewed, elevated ENPP1 protein level and enzymatic activity are associated with insulin resistance and type 2 diabetes (29–37). This probably can
be attributed to the reduced insulin action in patients with
type 2 diabetes as shown in Figure 5B. In that case, an increase of PPi production and a reduction of bone density in the patients with type 2 diabetes would have been antic-ipated. In contrast to that, both vascular calcification and increased bone mineral density are commonly observed in some patients with type 2 diabetes, a phenomenon that could not be explained by the increase ofEnpp1 expres-sion. Whether the increases of ENPP1 protein and bone density in insulin resistant type 2 diabetes patients is asso-ciated with changes of PPi production, and whether other factors regulate PPi production or increase of bone density without the contribution of ENPP1 remains to be determined.
Figure 4. Expression levels ofEnpp1 mRNA in HepG2 cells.A, Enpp1mRNA in HepG2 cells treated with 10, 100, or 1000 nM dexamethasone for 16 h.B,Enpp1mRNA levels in HepG2 cells treated with 5, 25, 75, or 100 nM insulin overnight.C,Enpp1mRNA levels in HepG2 cells treated with 100 nM insulin for 4, 8, 12, and 16 h. Total RNA was isolated and subjected to real-time PCR analysis (n=3 independent treatments). Data are reported as means±SE. *Po0.05, compared to untreated controls forAandBor time 0 forC (Student’st-test).
Recently, mice with a mutation of myeloid-lineage leu-kemia gene (Mll2), a histone methyltransferase function-ing durfunction-ing development, have been shown to develop hyperinsulinemia and have lowered hepaticEnpp1 expres-sion compared with the wildtype controls, suggesting the regulation of its expression by histone modification (38). Both histone methylation and DNA modification contribute to the gene expression pattern during development (39). It has been shown that dynamic changes of metabolites in mouse hepatocytes in response to injections of glucose and glutamate altered hepatic 5-methylcytosine hydroxyla-tion level through ten-eleven translocahydroxyla-tion (TET) family of dioxygenases (40). The glucose injection was associated with the change of 5-methylcytosine hydroxylation profile in the promoter of mouse hepatic Gck promoter (40). Interestingly, that study did not test the effect of insulin injection on the TET-mediated changes. As known and shown here, insulin induces Gck expression. Therefore, whether enzymes such as TET1 affect insulin-reduced or dexamethasone-inducedEnpp1expression deserves to be investigated.
In summary, we first observed the changes ofEnpp1
gene expression in the liver of rats submitted to the cycle of fasting and refeeding. This led us to observe that the expression of Enpp1in rat primary hepatocytes and human hepatoma cells is regulated by insulin and gluco-corticoid. Dexamethasone was found to induce Enpp1
gene expression, whereas insulin reduced it in primary hepatocytes and HepG2 cells. The implication of this observation is profound, as it may provide an important link between diabetes and abnormal bone mineral density in patients with diabetes. Further studies are needed to understand the regulatory mechanisms ofEnpp1 expres-sion in response to changes of hormones such as insulin, and genomic modifications such as methylation, and their physiological significances.
Acknowledgments
The authors thank the National Natural Science Foundation of China for financial support (No.81370942 to S. Zhao).
References
1. Eckel RH, Kahn SE, Ferrannini E, Goldfine AB, Nathan DM, Schwartz MW, et al. Obesity and type 2 diabetes: what can be unified and what needs to be individualized?Diabetes Care2011; 34: 1424–1430, doi: 10.2337/dc11-0447. 2. Brown MS, Goldstein JL. Selective versus total insulin
resistance: a pathogenic paradox.Cell Metab2008; 7: 95–96, doi: 10.1016/j.cmet.2007.12.009.
3. Iynedjian PB, Gjinovci A, Renold AE. Stimulation by insulin of glucokinase gene transcription in liver of diabetic rats, J Biol Chem1988; 263: 740–744.
4. Hanson RW, Reshef L. Regulation of phosphoenolpyruvate carboxykinase (GTP) gene expression.Annu Rev Biochem 1997; 66: 581–611, doi: 10.1146/annurev.biochem.66.1.581. 5. Zhang Y, Chen W, Li R, Li Y, Ge Y, Chen G. Insulin-regulated Srebp-1c and Pck1 mRNA expression in primary hepato-cytes from Zucker fatty but not lean rats is affected by feeding conditions.PLoS One2011; 6: e21342, doi: 10.1371/ journal.pone.0021342.
6. Mackenzie NCW, Huesa C, Rutsch F, MacRae VE. New insights into NPP1 function: Lessons from clinical and animal studies. Bone 2012; 51: 961–968, doi: 10.1016/ j.bone.2012.07.014.
7. Bollen M, Gijsbers R, Ceulemans H, Stalmans W, Stefan C. Nucleotide pyrophosphatases/phosphodiesterases on the move,Crit Rev Biochem Mol Biol2000; 35: 393–432, doi: 10.1080/10409230091169249.
8. Li L, Yin Q, Kuss P, Maliga Z, Millán JL, Wu H, et al. Hydrolysis of 2G 3G-cGAMP by ENPP1 and design of nonhydrolyzable analogs.Nat Chem Biol2014; 10: 1043– 1048, doi: 10.1038/nchembio.1661.
9. Anderson HC, Harmey D, Camacho NP, Garimella R, Sipe JB, Tague S, et al. Sustained osteomalacia of long bones despite major improvement in other hypophosphatasia-related mineral deficits in tissue nonspecific alkaline phosphatase/
nucleotide pyrophosphatase phosphodiesterase 1 double-deficient mice.Am J Pathol 2005; 166: 1711–1720, doi: 10.1016/S0002-9440(10)62481-9.
10. Mackenzie NCW, Zhu D, Milne EM, van’t Hof R, Martin A, Quarles DL, et al. Altered bone development and an increase in FGF-23 expression in Enpp1-/- mice. PLoS One2012; 7: e32177, doi: 10.1371/journal.pone.0032177. 11. Rutsch F, Ruf N, Vaingankar S, Toliat MR, Suk A, Hohne W,
et al. Mutations in ENPP1 are associated with‘idiopathic’ infantile arterial calcification,Nat Genet2003; 34: 379–381, doi: 10.1038/ng1221.
12. Rancoule C, Dusaulcy R, Tréguer K, Grès S, Attané C, Saulnier-Blache JS. Involvement of autotaxin/lysophospha-tidic acid signaling in obesity and impaired glucose home-ostasis.Biochimie2014; 96: 140–143, doi: 10.1016/j.biochi. 2013.04.010.
13. Takahashi T, Old LJ, Boyse EA. Surface alloantigens of plasma cells. J Exper Med 1970; 131: 1325–1341, doi: 10.1084/jem.131.6.1325.
14. Harahap AR, Goding JW. Distribution of the murine plasma cell antigen PC-1 in non-lymphoid tissues.J Immunol1988; 141: 2317–2320.
15. Frittitta L, Ercolino T, Bozzali M, Argiolas A, Graci S, Santagati MG, et al. A cluster of three single nucleotide polymorphisms in the 3’-untranslated region of human glycoprotein PC-1 gene stabilizes PC-1 mRNA and is associated with increased PC-1 protein content and insulin resistance-related abnormalities.Diabetes2001; 50: 1952– 1955, doi: 10.2337/diabetes.50.8.1952.
17. Weedon MN, Shields B, Hitman G, Walker M, McCarthy MI, Hattersley AT, et al. No evidence of association of ENPP1 variants with type 2 diabetes or obesity in a study of 8,089 U.K. Caucasians. Diabetes 2006; 55: 3175–3179, doi: 10.2337/db06-0410.
18. Maddux BA, Chang YN, Accili D, McGuinness OP, Youngren JF, Goldfine ID. Overexpression of the insulin receptor inhibitor PC-1/ENPP1 induces insulin resistance and hyper-glycemia.Am J Physiol Endocrinol Metab2006; 290: E746– E749, doi: 10.1152/ajpendo.00298.2005.
19. Dong H, Maddux BA, Altomonte J, Meseck M, Accili D, Terkeltaub R, et al. Increased hepatic levels of the insulin receptor inhibitor, PC-1/NPP1, induce insulin resistance and glucose intolerance. Diabetes 2005; 54: 367–372, doi: 10.2337/diabetes.54.2.367.
20. Maddux BA, Goldfine ID. Membrane glycoprotein PC-1 inhibition of insulin receptor function occurs via direct interaction with the receptor alpha-subunit.Diabetes2000; 49: 13–19, doi: 10.2337/diabetes.49.1.13.
21. Gijsbers R, Ceukemans H, Bollen M. Functional character-ization of the non-catalytic ectodomains of the nucleotide pyrophosphatase/phosphodiesterase NPP1.Biochem J2003; 371: 321–330, doi: 10.1042/bj20021943.
22. Zhang J, Ou J, Bashmakov Y, Horton JD, Brown MS, Goldstein JL. Insulin inhibits transcription of IRS-2 gene in rat liver through an insulin response element (IRE) that resembles IREs of other insulin-repressed genes.Proc Natl Acad Sci USA 2001; 98: 3756–3761, doi: 10.1073/pnas. 071054598.
23. Shimomura I, Matsuda M, Hammer RE, Bashmakov Y, Brown MS, Goldstein JL. Decreased IRS-2 and increased SREBP-1c lead to mixed insulin resistance and sensitivity in livers of lipodystrophic and ob/ob mice.Mol Cell2000; 6: 77–86, doi: 10.1016/S1097-2765(05)00010-9.
24. Chin CN, Dallas-Yang Q, Liu F, Ho T, Ellsworth K, Fischer P, et al. Evidence that inhibition of insulin receptor signaling activity by PC-1/ENPP1 is dependent on its enzyme activity, Eur J Pharmacol2009; 606: 17–24, doi: 10.1016/j.ejphar. 2009.01.016.
25. Zhou HH, Chin CN, Wu M, Ni W, Quan S, Liu F, et al. Suppression of PC-1/ENPP-1 expression improves insulin sensitivityin vitroandin vivo.Eur J Pharmacol2009; 616: 346–352, doi: 10.1016/j.ejphar.2009.06.057.
26. Imai E, Miner JN, Mitchell JA, Yamamoto KR, Granner DK. Glucocorticoid receptor-cAMP response element-binding protein interaction and the response of the phosphoenolpyr-uvate carboxykinase gene to glucocorticoids.J Biol Chem 1993; 268: 5353–5356.
27. Frittitta L, Sbraccia P, Costanzo BV, Tassi V, D’Adamo M, Spampinato D, et al. High insulin levels do not influence PC-1 gene expression and protein content in human muscle tissue and hepatoma cells.Diabetes Metab Res Rev2000; 16: 26– 32, doi: 10.1002/(SICI)1520-7560(200001/02)16:1o 26::AID-DMRR7843.0.CO;2-N.
28. Solan JL, Deftos LJ, Coding JW, Terkeltaub RA. Expression of the nucleoside triphosphate pyrophosphohydrolase PC-1 is induced by basic fibroblast growth factor (bFGF) and
modulated by activation of the protein kinase A and C pathways in osteoblast-like osteosarcoma cells. J Bone Mineral Res1996; 11: 183–192, doi: 10.1002/jbmr.56501 10207.
29. Goding JW, Grobben B, Slegers H. Physiological and pathophysiological functions of the ecto-nucleotide pyropho-sphatase/phosphodiesterase family.Biochim Biophys Acta 2003; 1638: 1–19, doi: 10.1016/S0925-4439(03)00058-9. 30. Thrailkill KM, Lumpkin CK, Bunn RC, Kemp SF, Fowlkes JL.
Is insulin an anabolic agent in bone? Dissecting the diabetic bone for clues.Am J Physiol Endocrinol Metab2005; 289: E735–E745, doi: 10.1152/ajpendo.00159.2005.
31. Guntur AR, Rosen CJ. IGF-1 regulation of key signaling pathways in bone.Bone Key Rep2013; 2: 437, doi: 10.1038/ bonekey.2013.171.
32. Ferron M, Wei J, Yoshizawa T, Del Fattore A, DePinho RA, Teti A, et al. Insulin Signaling in Osteoblasts Integrates Bone Remodeling and Energy Metabolism.Cell2010; 142: 296– 308, doi: 10.1016/j.cell.2010.06.003.
33. Fulzele K, Riddle RC, DiGirolamo DJ, Cao X, Wan C, Chen D, et al. Insulin receptor signaling in osteoblasts regulates postnatal bone acquisition and body composition.Cell2010; 142: 309–319, doi: 10.1016/j.cell.2010.06.002.
34. Leidig-Bruckner G, Grobholz S, Bruckner T, Scheidt-Nave C, Nawroth P, Schneider JG. Prevalence and determinants of osteoporosis in patients with type 1 and type 2 diabetes mellitus. BMC Endocr Disord 2014; 14: 33, doi: 10.1186/ 1472-6823-14-33.
35. Hessle L, Johnson KA, Anderson HC, Narisawa S, Sali A, Goding JW, et al. Tissue-nonspecific alkaline phosphatase and plasma cell membrane glycoprotein-1 are central anta-gonistic regulators of bone mineralization.Proc Natl Acad Sci USA 2002; 99: 9445–9449, doi: 10.1073/pnas.1420 63399.
36. Mastrandrea LD, Wactawski-Wende J, Donahue RP, Hovey KM, Clark A, Quattrin T. Young women with type 1 diabetes have lower bone mineral density that persists over time, Diabetes Care 2008; 31: 1729–1735, doi: 10.2337/dc07-2426.
37. Goldfine ID, Maddux BA, Youngren JF, Reaven G, Accili D, Trischitta V, et al. The role of membrane glycoprotein plasma cell antigen 1/ectonucleotide pyrophosphatase phospho-diesterase 1 in the pathogenesis of insulin resistance and related abnormalities. Endocr Rev 2008; 29: 62–75, doi: 10.1210/er.2007-0004.
38. Goldsworthy M, Absalom NL, Schröter D, Matthews HC, Bogani D, Moir L, et al. Mutations in Mll2, an H3K4 methyl-transferase, result in insulin resistance and impaired glucose tolerance in mice.PLoS One2013; 8: e61870, doi: 10.1371/ journal.pone.0061870.
39. Cedar H, Bergman Y. Linking DNA methylation and histone modification: patterns and paradigms,Nat Rev Genet2009; 10: 295–304, doi: 10.1038/nrg2540.