TATIANA FICHE SALLES TEIXEIRA
PERMEABILIDADE INTESTINAL E PARÂMETROS NUTRICIONAIS E BIOQUÍMICOS NA OBESIDADE
VIÇOSA
MINAS GERAIS – BRASIL 2010
Ficha catalográfica preparada pela Seção de Catalogação e Classificação da Biblioteca Central da UFV
T
Teixeira, Tatiana Fiche Salles, 1983-
T266p Permeabilidade intestinal e parâmetros nutricionais e bio-2010 químicos na obesidade / Tatiana Fiche Salles Teixeira.
– Viçosa, MG, 2010. ix, 64f. : il. ; 29cm.
Texto em inglês.
Orientador: Maria do Carmo Gouveia Peluzio.
Dissertação (mestrado) - Universidade Federal de Viçosa. Inclui bibliografia.
1. Intestinos - Doenças. 2. Obesidade. 3. Síndrome metabólica. 4. Resistência à insulina. 5. Ácidos graxos. I. Universidade Federal de Viçosa. II. Título.
TATIANA FICHE SALLES TEIXEIRA
PERMEABILIDADE INTESTINAL E PARÂMETROS NUTRICIONAIS E BIOQUÍMICOS NA OBESIDADE
APROVADA: 17 de dezembro 2010
______________________________ Profa. Célia Lúcia de Luces Fortes Ferreira
(Co-Orientadora)
_________________________________ Profa. Cristina Maria Ganns Chaves Dias
_________________________________ Profa. Maria do Carmo Gouveia Peluzio
(Orientadora)
D edico esta dissertação aos meus amados pais, Edson e Patrícia,
irmãos, Felipe e R odrigo e a todos os familiares e amigos por
fazerem parte da minha caminhada trazendo alegria, amor, apoio,
AGRADECIMENTOS
À Deus, por abrir meus caminhos, por me abençoar com tantas dádivas e por acalmar minhas inquietações sempre que me recorro à Ele.
À minha família pelo apoio incondicional e por sempre me confortar e aconchegar com tanto amor. Às minhas polaridades: minha mãe Patrícia pelas orações e busca espiritual, por ser exemplo de esposa, mãe e mulher e à meu pai Edson, pela racionalidade e por tornar viável muitas escolhas e desejos. Aos meus irmãos, pelo exemplo de coragem, dedicação e competência.
À minha orientadora, Profa. Maria do Carmo Gouveia Peluzio, por acreditar no meu
potencial desde a graduação, por tornar todo este trabalho possível, pelos conselhos, pelo positivismo, amizade e ensinamentos.
Às minhas conselheiras: Profa. Josefina Bressan por abrir as portas do Laboratório de Metabolismo Energético e Composição Corporal (LAMECC) e tornar a execução deste trabalho confortável para todos os voluntários e pelos conhecimentos transmitidos; Profa.Célia Lúcia de Luces Fortes Ferreira, pela atenção, conhecimentos transmitidos e por me incentivar a ir mais longe; Profa Cristina Maria Ganns Chaves Dias pelas contribuições neste trabalho e na minha formação.
À Profa. Sylvia do Carmo C. Franceschini, pelo aconselhamento estatístico e pela amizade.
Ao Prof. Henrique O. Gama Torres (UFMG) e equipe do Laboratório de Estudos da Barreira Gastrointestinal (UFMG) pela confiança, por direcionarem a execução do teste de permeabilidade e pelo empréstimo de reagentes.
À Fabíola pela ajuda fundamental na coleta de dados.
Ao meu professor de inglês, Rodrigo, por contribuir com o meu aprendizado.
À Graça e Rita, por todo apoio e providências tomadas.
À equipe da Divisão de Saúde, em especial, ao Alexandre Novelho, pela atenção e serviços prestados. À técnica de enfermagem, Elisângela, pelo bom trabalho. A todos os voluntários, por participarem deste trabalho.
Aos amigos de caminhada Caio, Zé, Raquel, Denise, Damiana, Cynthia, Lu, Carols, Sandra, Cristian, Leandro, pelas alegrias compartilhadas e por serem exemplos de dedicação e minha inspiração para continuar o caminho.
À minha amiga e companheira Livia, por fazer parte integral da minha vida em Viçosa, por conviver com a parte boa e ruim do meu ser, e me ensinar coisas sutis com o seu jeito de ser. À minha amiga Elis pela força e exemplo de organização, liderança e perseverança.
Ao Henrique Machado, pelo carinho, amor, apoio, exemplo de paciência e tranqüilidade.
ÍNDICE
RESUMO……… viii
ABSTRACT………... x
ARTIGO I: Altered intestinal permeability in obesity: what evidences and possible mechanisms support this hypothesis?... 1
Abstract………... 1
1. Introduction……… 2
2. Lactulose/Mannitol ratio: suitable for intestinal permeability assessment in obesity? ………. 3
3. Possible causes of altered intestinal permeability in obesity………. 5
3.1. Dysbiosis……… 5
3.2. Nutritional deficiencies ………. 5
4. Possible mechanisms that links altered intestinal permeability with metabolic consequences of obesity………. 6
4.1. Non-alcoholic fatty liver disease and insulin resistance……… 6
4.2. Low HDL levels………. 7
4.3. Hyperleptinemia………. 7
5. Future perspectives……… 9
6. References………... 12
ARTIGO II: Intestinal permeability parameters in obese patients are correlated with metabolic syndrome risk factors………. 21
Abstract………... 21
1. Introduction……… 22
2. Subjects and Methods………. 23
2.2. Study design………... 23
2.3. Intestinal permeability analysis……….. 24
2.4. Biochemical analysis……….. 24
2.5. Statistical Analysis………. 25
3. Results……… 26
3.1. Anthropometric, body composition variables and blood pressure……… 26
3.2. Biochemical analysis……….. 26
3.3. Intestinal permeability……… 26
4. Discussion……….. 35
5. References……….. 39
ARTIGO III: Increased short-chain fatty acid in feces of obese patients correlates with metabolic syndrome risk factors………. 44
Abstract………... 44
1. Introduction……… 45
2. Subjects and Methods………. 46
2.1. Subjects………... 46
2.2. Biochemical analysis………... 46
2.3. Fecal short-chain fatty acids analysis……….. 47
2.4. Statistical analysis………... 47
3. Results……… 48
3.1. Subjects characteristics………... 48
3.2. Fecal short-chain fatty acids……… 48
4. Discussion……….. 51
Appendix I………... 59
Appendix II………. 60
Appendix III……… 61
Appendix IV……… 62
RESUMO
TEIXEIRA, Tatiana Fiche Salles. M.Sc. Universidade Federal de Viçosa, Dezembro de 2010. Permeabilidade intestinal e parâmetros nutricionais e bioquímicos na obesidade. Orientadora: Maria do Carmo Gouveia Peluzio. Co-orientadoras: Josefina Bressan e Célia Lúcia de Luces Fortes Ferreira.
ABSTRACT
TEIXEIRA, Tatiana Fiche Salles. M.Sc. Universidade Federal de Viçosa, December, 2010. Intestinal permeability and nutritional and biochemical parameters in obesity. Advisor: Maria do Carmo Gouveia Peluzio. Co-advisors: Josefina Bressan and Célia Lúcia de Luces Fortes Ferreira.
ARTIGO I:
Altered intestinal permeability in obesity: what evidences and possible mechanisms
support this hypothesis?
Abstract
The importance of gut health for weight control and prevention of obesity has recently gained more attention. The gut harbors a complex cellular, immunological and neuroendocrine structure that can modulate mechanisms related to obesity. The aim of this review was to discuss mechanisms underlying possible altered intestinal permeability in obesity and its link with obesity-related comorbidities. The L/M ratio might not be the best marker of altered intestinal permeability because obese individuals might be absorbing proportionally higher quantities of both sugar probes, and this need to be explored. Dysbiosis and nutritional deficiencies can be pointed out as the main mechanisms underlying the causes of altered intestinal permeability. Studies evidences suggest that endotoxemia, through altered intestinal permeation of LPS, might explain some features of obesity such as non-alcoholic fatty liver, insulin resistance, low HDL levels and hyperleptinemia. Protection of intestinal barrier as a preventive or therapeutic approach is an area of clinical and experimental research barely explored, but that harbors a promising field for future development of innovative interventions.
1. Introduction
Many countries around the world have been experiencing increases in the prevalence of obesity since 1980s (James et al, 2001; Finkelstein et al, 2005; Ogden et al, 2007; Ford & Mokdad, 2008). Obesity can be defined as a disease in which excess body fat has accumulated such that health may be adversely affected, explaining why it is a medical and public health concern (Kopelman, 2000). It is considered a major risk factor for cardiovascular disease, once it is also related to hypertension, dyslipidemia and insulin resistance, and it is associated with increased risk of non-alcoholic fatty liver disease (NAFLD) and non-alcoholic steatohepatitis (Ogden et al, 2007).
The combination of genetic susceptibility (Cummings & Schwartz, 2003), decreased physical activity, increased consumption and availability of high-energy foods in modern society are blamed as the main causes of this global epidemic of obesity (Kopelman, 2000; Finkelstein et al, 2005).
Although obesity is considered a multifactorial condition, it is often viewed unidimensionally, described and studied as a simple issue of body weight (Ogden et al, 2007). But recently, the importance of gut health for weight control and prevention of obesity has gained more attention. The autointoxication theory guided the medical practice until the early twentieth century. This theory stated that toxins produced in the intestine by bacterial processing could be absorbed to the circulation and promote many symptoms and diseases (Whorton, 2000; Müller-Lissner et al, 2005). Thus, accumulating evidences point out to the need of, at least partially, reconsidering this old concept.
Altered intestinal permeability could be a reflex of obese dietary habits and microbiota (Cani et al, 2007), and animal models of obesity (ob/ob, db/db) suggest its relation to insulin sensitivity and fatty liver (Brun et al, 2006; Cani et al, 2009). The aim of this review was to discuss possible mechanisms underlying altered intestinal permeability in obesity and its link with obesity-related comorbidities.
2. Lactulose/Mannitol ratio: suitable for intestinal permeability assessment in
obesity?
Once it is a non-invasive methodology, measurement of intestinal permeability, through orally ingested macromolecular probes and their quantification in the urine, is the most widely accepted method for evaluation of intestinal barrier integrity in humans (Farhadi et al, 2003a). Under normal conditions, molecules the size of disaccharides (lactulose) are restricted from moving across the villus tip, whereas smaller molecules (mannitol) can do so with relative freedom as the smaller channels are concentrated at the villi tips (Arrieta et al, 2006). Thus, smaller molecules such as mannitol are expected to be present in urine in higher proportion than bigger molecules like lactulose. The calculation of the lactulose:mannitol (L/M) ratio is considered a good marker of small intestinal permeation (Farhadi et al, 2003b) and is meant to circumvent confounding factors as inter-individual variation of gastric emptying, intestinal transit and transport, blood distribution and renal clearance (Martínez-Augustin, 1995).
Theoretically, an increase in the L/M ratio may be caused by a decrease in mannitol absorption and/or an increase in lactulose absorption. Decreased mannitol absorption can be the result of a diminished absorptive area, while an increased permeation of lactulose may be due to a facilitated diffusion of this sugar into the crypt region as a consequence of decreased villous height or tight junction loosening (Hulst et al, 1998). This ratio is of particular importance in diseases where the villosity is lesioned, because from a clinical perspective in these cases there is a marked reduction in mature small intestinal surface area, such as celiac disease, and consequently a substantial reduction in the fractional excretion of small probes such as mannitol (Arrieta et al, 2006), what would result in an increased ratio.
could be pointed as possible mechanisms to support the belief that tight junction might be loosen in obesity, contributing to higher paracellular substances permeation, such as increased lactulose absorption. But the L/M ratio might not be the best marker of altered intestinal permeability because obese individuals might be absorbing proportionally higher quantities of mannitol, so that the increased excretion of lactulose does not appear with the calculation of the ratio. Two studies provide evidence to hold this hypothesis. Ferraris & Vinnakota (1995) showed in animal model that genetic obesity is associated with increased intestinal growth, which augments absorption of all types of nutrients. McRoberts et al (1990) showed in a cell culture model that the addition of insulin – which is a hormone usually increased in obese subjects (Kahn et al, 2006) - at the media to the serosal (basolateral membrane) induced a decline in transepithelial resistance while at the mucosal site (apical membrane) there was no significant effect, suggesting that the insulin-induced decline in transcellular resistance is receptor-mediated and that receptors are localized in the basolateral membrane. Increased mannitol flux was an observed effect paralled to this altered paracellular permeability.
Besides, D´Souza et al (2003) demonstrated that mannitol fluxes across Caco-2 cells cultured in high glucose media increased by 65% and it predominantly affected transepithelial transport of solutes permeating the cell barrier by paracellular and transcellular passive diffusion.The luminal content of glucose might be high in obese individuals due to the common pattern of high glycemic index foods consumption and added sugars (Ludwig et al, 1999; Jenkins et al, 2000; Wylie-Rosset et al, 2004; Drewnowski, 2007). Dietary glycemic index is positively associated with the HOMA index and the prevalence of metabolic syndrome (McKeown et al, 2004). The HOMA index and insulin values rise for insulin-resistant patients and insulin resistance is commonly associated with obesity (Keskin et al, 2005).
3. Possible causes of altered intestinal permeability in obesity
3.1. Dysbiosis
Dysbiosis can be characterized by an altered composition and/or distribution of the microbiota, and obesity has been characterized by both. The gut microbiota of obese mice and humans include fewer Bacteroidetes and correspondingly more Firmicutes than that of their lean counterparts (Ley et al, 2006; Dibaise et al, 2008). Furthermore, high prevalence of small intestinal bacterial overgrowth (SIBO) has been detected in severely obese patients (Sabaté et al, 2008). This also has been detected in diseases related to altered intestinal permeability (Parodi et al, 2009) supporting the principle that obesity is linked with an altered intestinal permeability.
The mechanism underlying the role of dysbiosis in the development of altered intestinal permeability is related to the altered immune responses due to disturbance of the partnership between the microbiota and the host immune system, ultimately leading to inflammatory disorders through cytokines secretion. The fact that the intestinal microbiota can exert both anti and pro-inflammatory effects (Round & Mazmanian, 2009), antibiotic therapy improves intestinal permeability (Cazzato et al, 2008) and that probiotic bacteria increases tight junctions resistance and reduces cellular permeability (Zareie et al, 2006) via modulation of cytokine production (Resta-Lenert & Barret, 2006) reinforce the importance of a balanced microbiota to a proper intestinal barrier function in obesity.
3.2. Nutritional deficiencies
The low intake or deficiencies of some nutrients have been reported in obesity: vitamin A (Ribot et al, 2001; Bonet et al, 2003; Zulet et al, 2008), zinc (Chen e Lin, 2000; Lee et al, 1998; Ozata, et al, 2002), vitamin D (Wortsman et al, 2000; Snijder, et al, 2005; Botella-Carretero et al, 2007) and calcium (Parikh & Yanovski, 2003; Schrager, 2005; Liu et al, 2006).
Vitamin D receptor plays a critical role in mucosal barrier homeostasis because of its ability to preserve junctional complexes integrity and stimulate epithelia renewal (Kong et al, 2008), and indirectly modulates the immune system (Deluca & Cantorna, 2001; Mathieu et al, 2004; van Etten & Mathieu, 2005). Vitamin D regulates calcium metabolism through its action on intestinal cells to increase calbidin expression and calcium absorption. Calbidin modulates the activity of calcium ATP-dependent pump located in the basolateral membrane of intestinal cells (Wood et al, 1998). An ATP depletion-repletion model for ischemia and reperfusion injury in kidney cells showed that lowering intracellular calcium during ATP depletion is associated with significant inhibition of the reestablishment of the permeability barrier following ATP repletion (Ye et al, 1999). This kind of mechanism should be investigated in intestinal cells.
4. Possible mechanisms that links altered intestinal permeability with
metabolic consequences of obesity
4.1. Non-alcoholic fatty liver disease and insulin resistance
The liver is an important organ of metabolism and its function can be altered in obesity due to insulin resistance and endotoxins (as lipopolyssacharides, LPS) (Cani et al, 2007). In ob/ob mice the molecules of activation of the inflammatory cascade as TNF-α, IKKß, NFkB, JNK are typically increased in the liver with insulin resistance (Li et al, 2003).
Hepatic insulin resistance is caused by fat accumulation in the liver (Samuel et al, 2004). Although the gold standard for diagnosis of non-alcoholic fatty liver disease (NAFLD) is liver biopsy, ALT and AST levels is an indirect measure of liver alterations, as elevated levels and obesity would indicate a risk factor to predict advanced liver disease (McCullough, 2004). Normal levels of ALT, AST can be observed in patients with NAFLD even if there are histological alterations in the liver (Mofrad et al, 2003; Poniachik et al, 2006). The incubation of these patient´s blood with lipopolysaccharide (LPS) showed a response of elevated production of IL-1α and TNF -α, and a positive correlation between the degree of steatosis and HOMA index (Poniachik et al, 2006).
attribute to dysfunctional fat cells, with unbalanced cytokine activity originated from oxidative stress, the link between metabolic and liver disorders. In ob/ob mice, intestinal barrier dysfunction is related to higher LPS levels in portal circulation, to an increased hepatic macrophage infiltration and to the expression of oxidative stress markers (Cani et al, 2009). On the other hand, Farhadi et al (2008) suggest that there is a susceptibility to gut leakiness in obese subjects with NASH, which may be the cause for the higher endotoxaemia (higher levels of LPS) and consequently to the progression of NAFLD to NASH and advanced fibrosis. The reduction of bacterial compounds (LPS) by the use of antibiotics reduces liver inflammation and levels of ALT and AST (Bigorgne et al, 2008).
4.2. Low HDL levels
High density lipoprotein (HDL) concentration below 50mg/dL is a criterium considered for metabolic syndrome diagnosis, and usually obesity is related to lower concentration of HDL (Alberti et al, 2009; Singh et al, 2009). Insulin resistance theory provides mechanistic explanations to the observed tendency to lower HDL-cholesterol concentrations (Laws & Reaven, 1992; Razani et al, 2008) observed in the obese group. The prevalence of lower HDL concentrations increases from the lowest to the highest quintile categories of HOMA values (McKeown et al, 2004).
There is epidemiologic evidence that endotoxemia constitutes a strong risk factor of early atherogenesis in subjects with chronic or recurrent bacterial infections (Wiedermann et al, 1999). It has been suggested that chronic infections and inflammatory states can impair reverse cholesterol transport exerted by the HDL lipoprotein. During these states one of the consequences is lowering of the HDL concentration and of the proteins involved in the efflux of cholesterol from cells like macrophages. Endotoxin (LPS), which could be increased in portal blood in cases of increased intestinal permeability (Brun et al, 2006; Cani et al, 2007), has been shown to down-regulate the expression of proteins in the liver and macrophages involved in the first step of reverse cholesterol transport (efflux of cholesterol from the cells) (Khovidhunkit et al, 2003) and to facilitate foam cell formation, which is a proatherogenic factor (Baranova et al, 2002).
4.3. Hyperleptinemia
receptor we hypothesized that it might exists a positive correlation between body fat and altered intestinal permeability once leptin levels are related to adiposity (Considine et al, 1996).
There is the hypothesis that the maintenance of a chronic low-grade inflammatory state at metabolically relevant sites, such as the liver and adipose tissue, is involved in the progression of obesity and its associated comorbidities. This inflammatory state can be the result of adipose synthesis of tumor necrosis factor-alpha (TNF-α and leptin, once they can induce the production of IL-6, CRP and other acute-phase reactants (Bulló et al, 2003). The majority of obese individuals exhibit an elevated serum leptin levels commensurate with their adipose mass (Considine et al, 1996) what has been thought as a consequence of leptin resistance once higher levels of the hormone in obese patients fail to modulate appetite and to prevent or mitigate obesity (Myers et al, 2008).
Increased levels of leptin could be a protective mechanism to cope with TNF-α toxicity (Takahashi et al, 1999). In humans, it was found a positive association between leptin, soluble receptors of TNF-α and insulin levels (Mantzoros et al, 1997). The abnormal production of TNF-α is of metabolic significance once its blockage results in improved insulin resistance (Hotamisligil, 2003). The expression of TNF-α in the adipose tissue is 7.5 fold higher in obese individuals than in lean individuals, and this is inversely related to insulin sensitivity (Kern et, 2001) and may contribute to obesity-related hyperleptinemia (Kirchgessner et al, 1997).
intake suppression (Grunfeld, 1996). But it is the chronic infusion of LPS at very low dose that leads to metabolic changes related to obesity (Cani et al, 2007).
Thus, if an altered intestinal permeability could contribute to a low dose of LPS absorption, although leptin expression could be marginally induced, its increase wouldn´t be enough to produce impact on appetite modulation. But as leptin expression reflects an increase in inflammatory cytokines such as TNF-α, a subclinical inflammatory state could be chronically being developed together with the metabolic changes.
Another point of future investigations is the possible role of leptin in intestinal permeability, once leptin receptors have been identified in enterocytes and the lack of leptin or resistance to leptin action in this site affects lipid handling with the reduction of the apolipoprotein AIV in the jejunum (Morton et al, 1998) and also influences sugar absorption in vivo. In the study of Pearson et al (2001) infusion of leptin to rats that underwent 80% small bowel resection increased the absorption of galactose and GLUT-5 band intensity. Systemic infusion of leptin increases substrate absorption and mucosal mass in normal small intestine of rats acting as a growth factor (Alavi et al, 2002). But it was also found that luminal leptin inhibited sugar absorption and did not modify in vivo intestinal permeability determined with 14C-mannitol (Iñigo et al, 2007).
Therefore it is suggested that the role of leptin on tight junction modulation and nutrient absorption should be investigated. If leptin increases due to LPS permeation (because of altered intestinal permeability, what would increase lactulose permeation and excretion) and if this increase act on intestinal mucosal to increase nutrient absorption (what would increase mannitol absorption and excretion), then the L/M ratio might not be adequate.
5. Future perspectives
innate immune system. This results in an increased production and secretion of a wide range of inflammatory molecules including TNF-α and interleukin-6 (IL-6), which may exert local effects on WAT physiology but also systemic effects on other organs as well (Bastard et al, 2006).
Systemic inflammatory disorders can develop from an immune dysregulation with an inappropriate immune system over-activation as a result of a disproportionate penetration of luminal components (Farhadi et al, 2003b; Hollander, 2009). This information has clinical importance in the context of intestinal permeability in obesity. Firstly, because cytokine mediated changes in paracellular permeability, especially TNF-α and interleukins contribute to a multitude of pathological conditions (Capaldo & Nusrat, 2009). Secondly, a higher lactulose absorption and excretion reflects a dysregulated function of tight junctions and a leaky gut or a higher flux of molecules through the paracellular route (Farhadi et al, 2003b). Thirdly, it was found that the mucosal barrier function was significantly impaired in two different animal models of obesity, due to abnormal distribution of tight junctions proteins, favoring endotoxin leakage into the portal blood (Brun et al, 2006). Fourth, metabolic endotoxemia is defined as an subclinical increase in plasma LPS and chronic infusion of LPS at very low doses leads to metabolic changes such as increased glucose and insulin levels, weight gain (total, liver and adipose tissue), increased markers of inflammation in adipose tissue and hepatic triglyceride content (Cani et al, 2007). Finally, the infiltration of macrophages in the WAT is one of the causes of this higher production of pro-inflammatory molecules in obesity (Bastard et al, 2006), and we can hypothesize that this infiltration of immune cells in the adipose tissue could be the result of its enrichment with material derived from gut bacteria (LPS) once they are transported in the lymph through chylomicrons and inflammatory responses can be induced in the target tissues of this lipoprotein (Goshal et al, 2009).
6. References
Alavi K, Schwartz M, Prasad R, O´Connor D, Funanage V. Leptin: a new growth factor for small intestine. J Pediatr Surg 2002; 37:327-330. doi:10.1053/jpsu.2002.30805. Alberti KGMM, Eckel RH, Grundy SM, Zimmet PZ, Cleeman JI, Donato KA, Fruchart
J-C, James WPT, Loria CM, Smith SC. Harmonizing the metabolic syndrome: a joint Interim Statement of the International Diabetes Federation Task Force on Epidemiology and Prevention; National Heart, Lung, and Blood Institute; American Heart Association; World Heart Federation; International Atherosclerosis Society; and International Association for the Study of Obesity. Circulation 2009; 120:1640-1645. doi: 10.1161/CIRCULATIONAHA.109.192644.
Bäckhed F. Changes in intestinal microflora in obesity: cause or consequence? J Pediatr Gastroenterol Nutr 2009; 48:S56-S57. doi: 10.1097/MPG.0b013e3181a11851.
Baranova I, Vishnyakova T, Bocharov A, Chen Z, Remaley AT, Stonik J, Eggerman TL, Patterson AP. Lipopolysaccharide down regulates both scavenger receptor B1 and ATP binding cassette transporter A1 in RAW cells. Infect Immun 2002; 70(6):2995-3003. doi: 10.1128/IAI.70.6.2995–3003.2002.
Bastard J-P, Maachi M, Lagathy C, Kim MJ, Caron M, Vidal H, Capeau J, Feve B. Recent adavances in the relationship between obesity, inflammation, and insulin resistance. Eur Cytokine Netw 2006; 17(1):4-12.
Bonet ML, Ribot J, Felipe F, Palou A. Vitamin A and the regulation of fat reserves. Cell Mol Life Sci 2003; 60:1311-1321.
Botella-Carretero JI, Alvarez-Blasco F, Villafruela JJ, Balsa JA, Vásquez C, Escobar-Morreale HF. Vitamin D deficiency is associated with the metabolic syndrome in
morbid obesity. Clinical Nutrition 2007; 26:573-580.
doi:10.1016/j.clnu.2007.05.009.
Bugianesi E, McCullough AJ, Marchesini G. Insulin resistance: a metabolic pathway to chronic liver disease. Hepatology 2005; 42:987-1000. doi: 10.1002/hep.20920. Bulló M, Gárcia-Lorda P, Megias I, Salas-Salvadó J. Systemic inflammtion, adipose
tissue tumor necrosis factor, and leptin expression. Obes Res 2003; 11(4):525-531. doi: 10.1038/oby.2003.74.
high-fat-induced diabetes in me through a mechanism associated with endotoxaemia. Diabetologia 2007; 50:2374-2383. doi:10.1007/s00125-007-0791-0.
Cani PD, Possemiers S, Wiele T V, Guiot Y, Everard A, Rottier O, Geurts L, Naslain D, Neyrinck A, Lambert DM, Muccioli GG, Delzenne NM. Changes in gut microbiota control inflammation in obese mice through a mechanism involving GLP-2-driven
improvement of gut permeability. Gut 2009; 58:1091-1103.
doi:10.1136/gut.2008.165886.
Carey DG, Jenkins AB, Campbell LV, Freund J, Chisholm DJ. Abdominal fat and insulin resistance in normal and overweight women: direct measurements reveal a strong relationship in subjects at both low and high risk of NIDDM. Diabetes 1996; 45(5):633-638. Doi: 10.2337/diabetes.45.5.633.
Chen P, Soares AM, Lima AAM, Gamble MV, Schorling JB, Conway M, Barrett LJ, Blaner WS, Guerrant RL. Association of vitamina A and zinc status with altered intestinal permeability:analyses of cohort data from northeastern brazil. J Health Popul Nutr 2003; 21(4):309-315.
Chen, M.-D.; Lin, P.-Y. Zinc-induced hyperleptinemia relates to the amelioration of sucrose-induced obesity with zinc repletion. Obes Res 2000; 8(7): 525-529. doi: 10.1038/oby.2000.65.
Considine RV, Sinha MK, Heiman ML, Kriauciunas A, Tephens TW, Nyce MR, Ohannesian JP, Marco CC, McKee, LJ, Bauer TL, Caro JF. Serum immunoreactive-leptin concentrations in normal-weight and obese humans. N Engl J Med 1996; 334:292-5.
Cummings DE, Schwartz MW. Genetics and pathophysiology of human obesity. Annu Rev Med 2003; 54:453-71. doi: 10.1146/annurev.med.54.101601.152403.
D´Souza VM, Shertzer HG, Menon AG, Pauletti GM. High glucose concentration in isotonic media alters Caco-2 cell permeability. AAPS PharmSci 2003; 5(3): 1-9. doi: 10.1208/ps050324.
Deluca HF, Cantorna MT. Vitamin D: its role and uses in immunology. FASEB J 2001; 15:2579-2585. doi: 10.1096/fj.01-0433rev.
Drewnowski A. The real contribution of added sugars and fats to obesity. Epidemiologic Rev 2007; 29(1):160-171. doi: 10.1093/epirev/mxm011.
Farhadi A, Gundlapalli S, Shaikh M, Frantzides C, Harrell L, Kwasny MM, Keshavarzian A. Susceptibility to gut leakiness: a possible mechanism for endotoxaemia in non-alcoholic steatohepatitis. Liver Int; 1026-1033, 2008c. doi:10.1111/j.1478-3231.2008.01723.x.
Farhadi A, Gundlapalli S, Shaikh M, Frantzides C, Harrell L, Kwasny MM, Keshavarzian A. Susceptibility to gut leakiness: a possible mechanism for endotoxaemia in non-alcoholic steatohepatitis. Liver Int 2008; 1026-1033. doi:10.1111/j.1478-3231.2008.01723.x.
Farhadi A, Keshavarzian A, Holmes EW, Fields J, Zhang L, Banan A. Gas chromatographic method for detection of urinary sucralose: application to the assessment of intestinal permeability. Journal of Chromatography B 2003; 784:145-154.
Feld JJ, Meddings J, Heathcote EJ. Abnormal intestinal permeability in primary biliary cirrhosis. Dig Dis Sci 2006; 51:1607-1613. doi 10.1007/s10620-006-9544-z.
Ferraris RP, Vinnakota RR. Intestinal nutrient transport in genetically obese mice. Am J Clin Nutr 1995; 62:540-6.
Finkelstein EA, Ruhm CJ, Kosa KM. Economic causes and consequences of obesity.
Annu Rev Public Health 2005; 26:239-57. doi:
10.1146/annurev.publhealth.26.021304.144628.
Ford ES, Mokdad AH. Epidemiology of obesity in the western hemisphere. J Clin Endocrinol Metab 2008; 93(11):s1-s8.
Goshal S, Witta J, Zhong J, Villiers W, Eckhardt E. Chylomicrons promote intestinal absorption of lipopolysaccharides. J Lipid Res 2009; 50:90-97. doi: 10.1194/jlr.M800156-JLR200.
Hotamisligil GS. Inflammatory pathways and insulin action. Int J Obes 2003; 27:S53-S55. doi:10.1038/sj.ijo.0802502.
Hulst RRWJV, Meyenfeldt MFV, Kreel BKV, Thunnissen FBJM, Brummer R-JM, Arends J-W, Soeters PB. Gut permeability, intestinal morphology, and nutritional depletion. Applied Nutritional Investigation 1998; 14(1): 1-16.
Iñigo C, Patel N, Kellet GL, Barber A, Lostao MP. Luminal leptin inhibits intestinal sugar absorption in vivo. Acta Physiol 2007; 190:303-310. doi: 10.1111/j.1748-1716.2007.01707.x.
James PT, Leach R, Kalamara E, Shayeghi M. The worldwide obesity epidemic. Obes res 2001; 9:228S-233S. doi: 10.1038/oby.2001.123.
Jenkins DJA, Kendall CWC, Augustin LSA, Franceschi S, Hamidi M, Marchie A, Jenkins AL, Axelsen M. Glycemic index: overview of implications in health and disease. Am J Clin Nutr 2002; 76(1):266S-273S.
Keskin M, Kurtoglu S, Kendirci M, Atabek ME, Yazici C. Homeostasis Model Assessment is more reliable than the fasting glucose/insulin ratio and quantitative insulin sensitivity check index for assessing insulin resistance among obese children and adolescents. Pediatrics 2005; 115:e500-e503. doi: 10.1542/peds.2004-1921.
Khovidhunkit W, Moser AH, Shigenaga JK, Grunfeld C, Feingold KR. Endotoxin down-regulates ABCG5 and ABCG8 in mouse liver and ABCA1 and ABCG1 in J774 murine macrophages: differential role of LXR. J Lipid Res 2003; 44:1728-1736. doi: 10.1194/jlr.M300100-JLR200.
Kong J, Zhang Z, Musch MW, Ning G, Sun J, Hart J, Bissonnette M, Li YC. Novel role of the vitamin D receptor in maintaining the integrity of the intestinal mucosal barrier. Am J Physiol Gastrointest Liver Physiol 2008; 294:G208-G216. doi: 10. 1152/ajpgi.00398.2007.
Konturek SJ, Konturek JW, Pawlik T, Brzozowki T. Brain-gut axis and its role in the control of food intake. J Physiol Pharmacol 2004; 55:137-154.
Laws A, Reaven GM. Evidence for an independent relationship between insulin resistance and fasting plasma HDL-cholesterol, triglyceride and insulin concentrations. J Intern Med 1992; 231(1):25-30. DOI: 10.1111/j.1365-2796.1992.tb00494.x. [Abstract]
Lee RG, Rains TM, Tovar-Palacio C, Beverly JL, Shay NF. Zinc deficiency increases hypothalamic neuropeptide Y and neuropeptide Y mRNA levels and does not block neuropeptide Y-induced feeding in rats. J Nutr 1998; 128(7): 1218-1223.
Ley RE, Bäckhed F, Turnbaugh P, Lozupone CA, Knight RD, Gordon JI. Obesity alters
gut microbial ecology. PNAS 2005; 102:11070-11075.
doi:10.1073/pnas.0504978102.
Li Z, Yang S, Lin H, Huang J, Watkins PA, Moser AB, Desimone C, Song X-Y, Diehl AM. Probiotics and antibodies to TNF inhibit inflammatory activity and improve nonalcoholic fatty liver disease. Hepatology 2003; 37:343-350.
Liu S, Song Y, Ford ES, Manson JE, Buring JE, Ridker PM. Dietary calcium, vitamin D, and the prevalence of metabolic syndrome in middle-aged and older U.S. women. Diabetes Care 2005; 28:2926-2932. doi:10.2337/diacare.28.12.2926.
Loffreda S, Yang SQ, Lin HZ, Karp CL, Brengman ML, Wang DJ, Klein AS, Bulkley GB, Bao C, Noble PW, Lane MD, Diehl AM. Leptin regulates proinflammatory immune responses. FASEB J 1998; 12:57-65.
Ludwig DS, Majzoub JA, Al-Zahrani A, Dallal GE, Blanco I, Roberts SB. High glycemic index foods, overeating and obesity. Pediatrics 1999; 103(3): 1-6. URL: http://www.pediatrics.org/cgi/content/full/103/3/e26.
Martínez-Augustin O, Boza JJ, Romera JM, Gil A. A rapid gas-liquid chromatography method for the determination of latulose and mannitol in urine: clinical application in studies of intestinal permeability. Clin Biochem 1995; 284:401-405. doi:10.1016/0009-9120(95)00015-2.
McCullough AJ. The clinical features, diagnosis and natural history of nonalcoholic fatty liver disease. Clin Liver Dis 2004; 8:521-533. doi:10.1016/j.cld.2004.04.004.
McKeown NM, Meigs JB, Liu S, Saltzman E, Wilson PWF, Jacques PF. Carbohydrate nutrition, insulin resistance, and the prevalence of the metabolic syndrome in the Framingham offspring cohort. Diabetes Care 2004; 27:538-546. doi: 10.2337/diacare.27.2.538.
McRoberts JA, Aranda R, Riley N, Kang H. Insulin regulates the paracellular permeability of cultured intestinal epithelial cell monolayers. J Clin Invest 1990; 85:1127-1134. doi: 10.1172/JCI114544.
Mofrad P, Contos MJ, Haque M, Sargeant C, Fisher RA, Luketic VA, Sterling RK, Shiffman ML, Stravitz RT, Sanval AL. Clinical and histologic spectrum of nonalcoholic fatty liver disease associated with normal ALT values. Hepatology 2003; 37:1286-1292. doi: 10.1053/jhep.2003.50229.
Morton NM, Emilsson V, Liu Y-L, Cawthorne MA. Leptin action intestinal cells. J Biol Chem 1998; 273(40):26194-26201. doi: 10.1074/jbc.273.40.26194.
Müller-Lissner S, Kamm MA, Scarpignato C, Wald A. Myths and misconceptions about chronic constipation. American Journal of Gastroenterology 2005; 100: 232-242. doi:10.1111/j.1572-0241.2005.40885.x.
Murphy KG, Dhillo WS, Bloom SR. Gut peptides in the regulation of food intake and energy homeostasis. Endocr Rev 2006; 27(7):719-727. doi:10.1210/er.2006-0028.
Myers MG, Cowley MA, Münzberg H. Mechanisms of leptin action and leptin resistance. Annu Rev Physiol 2008; 70:537-56.
O´Rourke RW. Inflammation in obesity-related diseases. Surgery 2009; 145:255-9. doi:10.1016/j.surg.2008.08.038.
Ogden CL, Yanovski SZ, Carroll MD, Flegal KM. The epidemiology of obesity. Gastroenterology 2007; 132:2087-2102. doi:10.1053/j.gastro.2007.03.052.
Ozata M, Mergen M, Oktenli C. et al. Increased oxidative stress and hypozincemia in male obesity. Clin Biochem 2002; 35:267-631. doi:10.1016/S0009-9120(02)00363-6.
Parikh S, Yanovski JA. Calcium intake and adiposity. Am J Clin Nutr 2003; 77(2):281-287.
Parodi A, Lauritano EC, Nardone G, Fontana L, Savarino V, Gasbarrini A. Small intestinal bacterial overgrowth. Digestive and Liver Disease Supplements 2009; 3:44-49. doi:10.1016/S1594-5804(09)60019-X .
Pearson PY, O´Connor DM, Schwartz MZ. Novel effect of leptin on small intestine adaptation. J Surg Res 2001; 97:192-195. doi:10.1006/jsre.2001.6153.
Razani B, Chakravarthy MV, Semenkovich CF. Insulin Resistance and atherosclerosis. Endocrinol Metab Clin N Am 2008; 37:603-621. doi:10.1016/j.ecl.2008.05.001.
Resta-Lenert S, Barret, KE. Probiotics and commensals reverse TNF-α and IFN-γ induced dysfunction in human intestinal epithelial cells. Gastroenterology 2006; 130:731-746. doi:10.1053/j.gastro.2005.12.015 .
Ribot J, Felipe F, Bonet ML, Palou A. Changes of adiposity in response to vitamin A status correlate with changes of PPARγ2 expression. Obes Res 2001; 9(8):500-509. doi: 10.1038/oby.2001.65.
Round JL, Mazmanian SK. The gut microbiota shapes intestinal immune responses during health and disease. Nature 2009; 9:313-323. doi:10.1038/nri2515.
Sabaté J-M, Jouët P, Harnois F, Mechler C, Msika S, Grossin M, Coffin B. High prevalence of small intestinal bacterial overgrowth in patients with morbid obesity: a contributor to severe hepatic steatosis. Obes Surg 2008; 18:371-377. doi: 10.1007/s11695-007-9398-2.
Samuel VT, Liu Z-X, Qu X, Elder BD, Bilz S, Befroy D, Romanelli AJ, Shulman GI. Mechanism of hepatic insulin resistance in non-alcoholic fatty liver disease. J Biol Chem 2004; 279:32345-32353. doi:10.1074/jbc.M313478200.
Singh B, Arora S, Goswami B, Mallika V. Metabolic Syndrome: a review of emerging markers and management. Diabetes & Metabolic Syndrome: Clinical Research & Reviews 2009; 3:240-254. doi:10.1016/j.dsx.2009.04.012.
Snijder MB, Dam RMV, Visser M, Deeg DJH, Dekker JM, Bounter LM, Seidell JC, Lips P . Adiposity in relation to vitamin D status and parathyroid hormone levels: a population-based study in older men and women. J Clin Endocrinol Metab 2005; 90:4119-4123. doi:10.1210/jc.2005-0216.
Sturniolo GC, Leo VD, Ferronato A, D´Odorico A, D´Incà. Zinc supplementation tightens “leaky gut” in Crohn’s disease. Inflammatory Bowel Diseases 2001; 7(2):94-98. doi: 10.1097/00054725-200105000-00003.
Takahashi N, Waelput W, Guisez Y. Leptin is an endogenous protective protein against the toxicity exerted by tumor necrosis factor. J Exp Med 1999; 189(1):207-212. doi: 10.1084/jem.189.1.207-a.
The American College of Gastroenterology. Obesity: a growing & dangerous public health challenge. Obesity do you know your GI risks? Obesity Initiative, 2008. p.1-35. http://obesitycampaign.org/obesity_facts.asp.
Van Etten E, mathieu C. Immunoregulation by 1,25-dihydroxyvitamin D3: basic
concepts. J Steroid Biochem Mol Biol 2005; 97:93-101.
doi:10.1016/j.jsbmb.2005.06.002 .
Whorton J. Civilisation and the colon: constipation as the disease of diseases. BMJ 2000; 321:1586-9. doi: 10.1136/bmj.321.7276.1586.
Wiedermann CJ, Kiechl S, Dunzendorfer S, Schratzberger P, Egger G, Oberhollenzer F, Willeit J. Association of endotoxemia with carotid atherosclerosis and cardiovascular disease. J Am Coll Cardiol 1999; 34:1975-81.
Wood RJ, Fleet JC, Cashman K, Bruns ME, Deluca, H.F. Intestinal calcium absorption in the aged rat: evidence of intestinal resistance to 1,25(OH)2 vitamin D. Endocrinology 1998; 3843-3848.
Wortsman J, Matsuoka LY, Chen TC, Lu Z, Holick MF. Decreased bioavailability of vitamin D in obesity. Am J Clin Nutr 2000; 72(3):690-693.
Ye J, Tsukamoto T, Sun A, Nigam S K. A role for intracellular calcium in tight junction reassembly after ATP depletion-repletion. Am J Physiol 1999; 277:F524-F532.
Zareie M, Johnson-Henry K, Jury I, Yang PC, Ngan BY, Mckay DM et al. Probiotics prevent bacterial translocation and improve intestinal barrier function in rats following chronic psychological stress. Gut 2006; 55:1553-1560. doi:10.1136/gut.2005.080739.
ARTIGO II:
Intestinal permeability parameters in obese patients are correlated with metabolic
syndrome risk factors
ABSTRACT
In humans, if there is any association of altered intestinal permeability with adiposity and insulin resistance, therapies aimed at correcting abnormally increased intestinal permeability may play a role in the context of obesity. The aim of this study was to assess intestinal permeability in obese women and verify if there is any association with anthropometric measurements, body composition and biochemical variables. Twenty lean and twenty obese females participated in the study. Anthropometric measurements, body composition and blood pressure were assessed. Blood samples were collected to determine total cholesterol and lipoproteins, fasting glucose, fasting insulin, HOMA index, AST, ALT. A solution (120 mL) containing 6.25g lactulose and 3g mannitol was given to volunteers and their urine was collected over a period of 5h. The presence of these sugars in urine was measured by gas chromatography. The obese group presented lower HDL (p<0.05), higher fasting glucose, insulin, HOMA index and lactulose excretion than the lean group (p<0.05). Lactulose excretion presented positive correlation (p<0.05) with waist and abdominal circumference. Blood insulin and the HOMA index also increased with the increase in mannitol and lactulose excretion and L/M ratio (p<0.05). L/M ratio presented a negative correlation with HDL concentration (p<0.05). We showed that intestinal permeability parameters in obese women are positively correlated to anthropometric measurements and metabolic variables. Therapeutic interventions focused on the intestine health and modulation of intestinal permeability should be explored in the context of obesity.
1. Introduction
Obesity is a worldwide epidemic problem (James et al, 2001; Ogden et al, 2007), and the metabolic syndrome is a common metabolic disorder resulting from this increased prevalence of obesity (Eckel et al, 2005). Insulin resistance, along with visceral adiposity, dyslipidemia and subclinical inflammatory state are the main features of this syndrome (Singh et al, 2009).
The intestinal barrier function has been viewed as an interface between health and disease (Farhadi et al, 2003a; Groschwitz & Hogan, 2009) and therapies toward correcting abnormally increased intestinal permeability may play a role in treating or preventing some diseases (Duerksen et al 2005; Arrieta et al, 2006; Vilela et al, 2007). Altered intestinal permeability has only been shown to affect obesity in animal models (Brun et al, 2006; Cani et al, 2009). Its reduction through the administration of prebiotic and changes in the microbiota improved systemic and hepatic inflammation, modulated gut peptides and adiposity (Cani et al, 2009) indicating that therapeutic approaches for improving intestinal permeability could positively impact on variables of metabolic syndrome.
2. Subjects and methods
2. 1. Subjects
Healthy women volunteers were recruited through written advertisements. Exclusion criteria were: younger than 18 years of age, pregnant or breast-feeding women, menopause, thyroid diseases, renal failure, cirrhosis, congestive heart failure, nephritic syndrome, diabetes, celiac disease, Crohn´s disease, irritable bowel syndrome, hepatitis, ulcers, use of vitamins/minerals supplements, use of non steroidal anti-inflammatory drugs, use of laxatives. According to a physical examination and a brief medical history, all subjects were in good health. Twenty lean females (BMI 19-24,99 kg/m2) and twenty obese females (BMI > 30 kg/m2) of similar age (mean age of the lean and obese group 28.5±7.6 vs 30.7 ± 6.5, p=0.33) participated in the study. None were taking any form of medication, except contraceptives pills. The study was approved by the ethical committee of Federal University of Viçosa and the participants provided written informed consent (protocol number 001/2010).
2.2. Study design
2.3. Intestinal permeability analysis
To quantify the sugars administered, urine samples were derivatized according to Farhadi et al. (2003b). Briefly, 200 µL of the urine samples were centrifuged for 20 minutes at 2250 rpm and 40µL of an internal standard solution was added (myo-inositol 20mg/mL (Fluka®, Switzerland) and phenyl-β-D-glucoside 20 mg/mL (Acrós Organics®, Belgium). The samples were then evaporated until dry at 70°C with continuous flux of nitrogen gas and ressuspended in 400µL of anhydrous pyridine (Sigma-Aldrich®, Germany) containing hydroxylamine (25 mg/mL, Sigma-Aldrich®, Germany). Next, it was heated to 70°C for one hour and centrifuged at 2250 rpm for 5 min. The supernatant (100 µL) was transferred to a vial and 200 µL of N-trimethylsilylimidazole (Acrós Organics®, Belgium) was added to react for 30 min at 70°C. From this derivative, 100 µL aliquot was transferred to an insert, and 1 µL was injected in a gas chromatograph (Shimadzu®, Japan) equipped with auto injector, flame ionization detector and capillary column (DB-5, 30m, 0,25mm x 0,25µm, J&W Scientific®, USA) for analysis. The parameters for sugar separation set in the gas chromatograph were adapted from Farhadi et al (2006) due to difficulties in lactulose detection using their original set conditions. Thus, the column temperature was set at 190°C for 5 minutes and then increased at a rate of 5°C/min for 12 minutes until reaching the final temperature of 250°C. This temperature was maintained for 15 minutes and the total run time was 32 minutes. The results were expressed as percentage of mannitol (%M) and lactulose (%L) excretion and as the Lactulose/Mannitol ratio (L/M).
2.4. Biochemical analysis
index were calculated as follow: fasting glucose (mmol/L) x fasting insulin (mU/L)/22,5 (Matthews et al, 1985; Oliveira et al, 2007).
2.5. Statistical Analysis
3. Results
3.1. Anthropometric and body composition variables and blood pressure
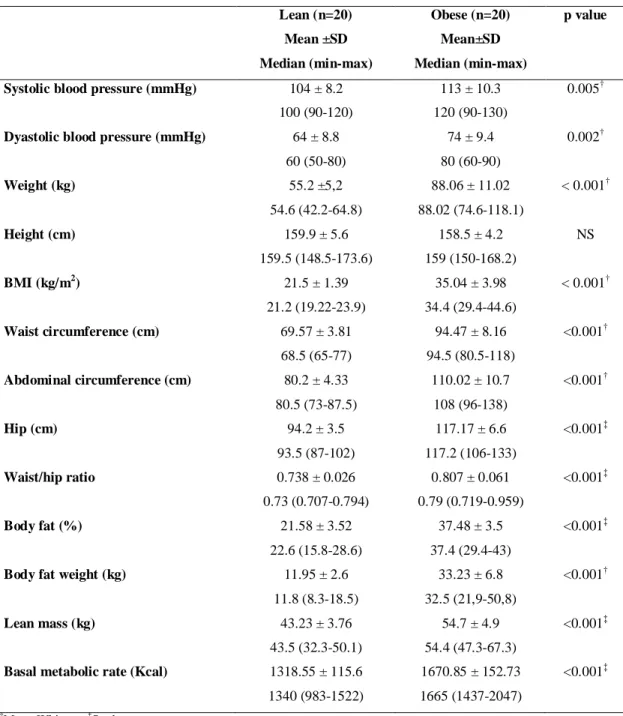
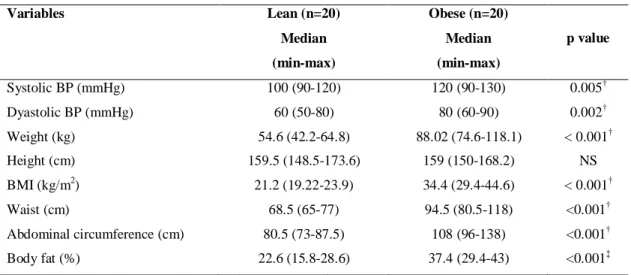
As shown in table 1, except for height that was similar in both groups, anthropometric and body composition variables and blood pressure differed between obese and lean groups as expected.
3.2. Biochemical analysis
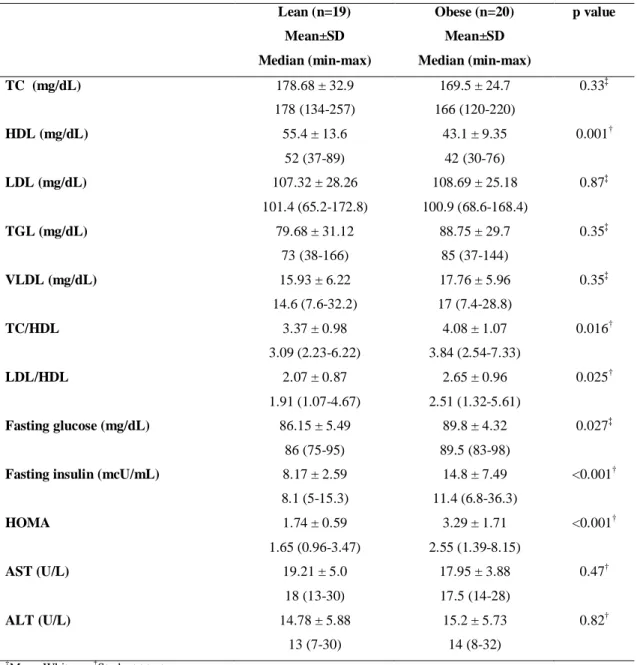
The collection of blood sample from one volunteer of the lean group wasn´t possible because of her difficult venous access. All the variables related to hemogram did not differ between the groups ( appendix I). Lipoprotein HDL was reduced in obese group, while the ratios of total cholesterol/HDL and LDL/HDL were increased (p<0.05). Fasting glucose, insulin and the HOMA index were also increased in the obese group (p<0.05) (table 2).
3.3. Intestinal permeability
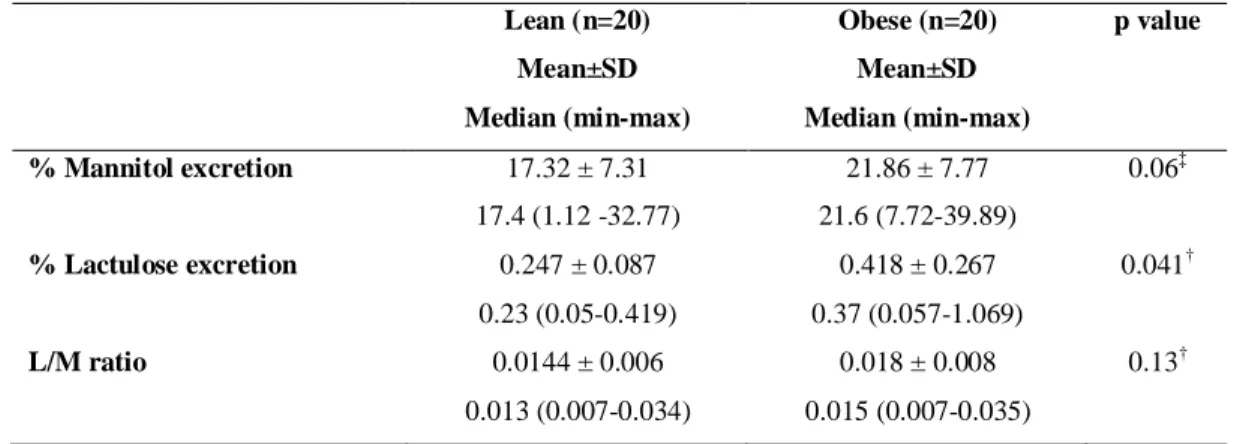
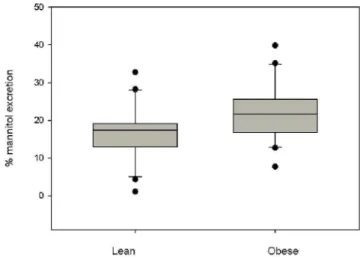
The parameters percentage of lactulose and mannitol excretion and the ratio L/M are represented graphically in figures 1, 2, 3 respectively. Mannitol excretion tended to be higher in the obese group, while lactulose excretion was higher in the obese group (p<0.05), but not sufficiently higher to significantly affect the L/M ratio (Table 3).
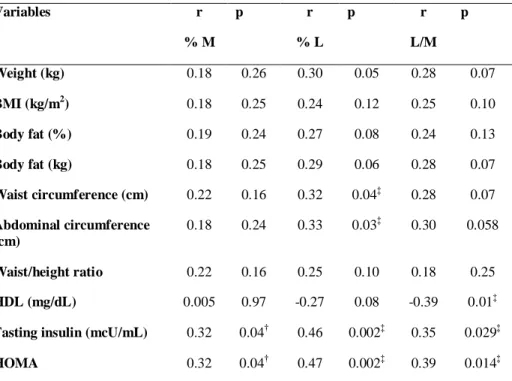
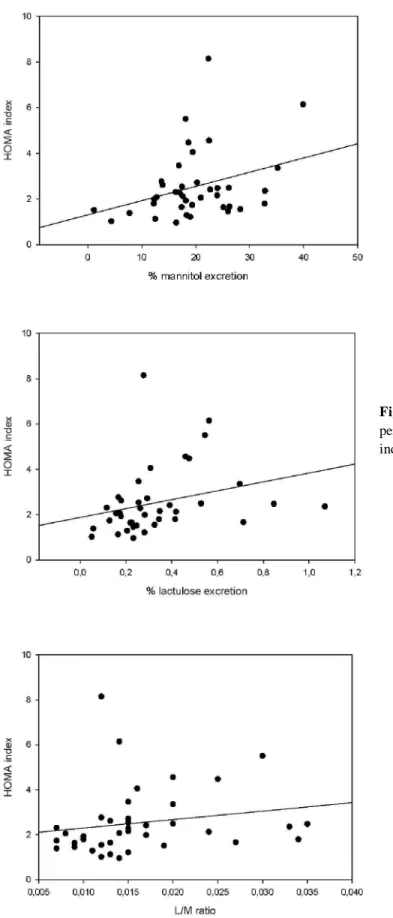
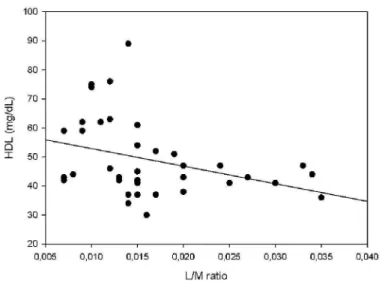
Lactulose excretion was significant and presented moderate positive correlation (p<0.05) with waist and abdominal circumference (figure 4, 5). The insulin concentration and HOMA index increased together with the increase in the percentage of mannitol (figure 6, 9) and lactulose (figure 7, 10) excretion and with the L/M ratio (figure 8, 11) (p<0.05), while HDL concentration (figure 12) presented a moderate inverse correlation with the L/M ratio (p<0.05) (table 4).
Table 1- Anthropometric, body composition and blood pressure variables of obese and lean women
Lean (n=20) Obese (n=20) p value
Mean ±SD
Median (min-max)
Mean±SD
Median (min-max)
Systolic blood pressure (mmHg) 104 ± 8.2
100 (90-120)
113 ± 10.3
120 (90-130)
0.005†
Dyastolic blood pressure (mmHg) 64 ± 8.8
60 (50-80)
74 ± 9.4
80 (60-90)
0.002†
Weight (kg) 55.2 ±5,2
54.6 (42.2-64.8)
88.06 ± 11.02
88.02 (74.6-118.1)
< 0.001†
Height (cm) 159.9 ± 5.6
159.5 (148.5-173.6)
158.5 ± 4.2
159 (150-168.2)
NS
BMI (kg/m2) 21.5 ± 1.39
21.2 (19.22-23.9)
35.04 ± 3.98
34.4 (29.4-44.6)
< 0.001†
Waist circumference (cm) 69.57 ± 3.81
68.5 (65-77)
94.47 ± 8.16
94.5 (80.5-118)
<0.001†
Abdominal circumference (cm) 80.2 ± 4.33
80.5 (73-87.5)
110.02 ± 10.7
108 (96-138)
<0.001†
Hip (cm) 94.2 ± 3.5
93.5 (87-102)
117.17 ± 6.6
117.2 (106-133)
<0.001‡
Waist/hip ratio 0.738 ± 0.026
0.73 (0.707-0.794)
0.807 ± 0.061
0.79 (0.719-0.959)
<0.001‡
Body fat (%) 21.58 ± 3.52
22.6 (15.8-28.6)
37.48 ± 3.5
37.4 (29.4-43)
<0.001‡
Body fat weight (kg) 11.95 ± 2.6
11.8 (8.3-18.5)
33.23 ± 6.8
32.5 (21,9-50,8)
<0.001†
Lean mass (kg) 43.23 ± 3.76
43.5 (32.3-50.1)
54.7 ± 4.9
54.4 (47.3-67.3)
<0.001‡
Basal metabolic rate (Kcal) 1318.55 ± 115.6
1340 (983-1522)
1670.85 ± 152.73
1665 (1437-2047)
<0.001‡
†
Mann-Whitney; ‡Student t test
Table 2 – Biochemical variables of obese and lean women
Lean (n=19) Obese (n=20) p value
Mean±SD
Median (min-max)
Mean±SD
Median (min-max)
TC (mg/dL) 178.68 ± 32.9
178 (134-257)
169.5 ± 24.7
166 (120-220)
0.33‡
HDL (mg/dL) 55.4 ± 13.6
52 (37-89)
43.1 ± 9.35
42 (30-76)
0.001†
LDL (mg/dL) 107.32 ± 28.26
101.4 (65.2-172.8)
108.69 ± 25.18
100.9 (68.6-168.4)
0.87‡
TGL (mg/dL) 79.68 ± 31.12
73 (38-166)
88.75 ± 29.7
85 (37-144)
0.35‡
VLDL (mg/dL) 15.93 ± 6.22
14.6 (7.6-32.2)
17.76 ± 5.96
17 (7.4-28.8)
0.35‡
TC/HDL 3.37 ± 0.98
3.09 (2.23-6.22)
4.08 ± 1.07
3.84 (2.54-7.33)
0.016†
LDL/HDL 2.07 ± 0.87
1.91 (1.07-4.67)
2.65 ± 0.96
2.51 (1.32-5.61)
0.025†
Fasting glucose (mg/dL) 86.15 ± 5.49
86 (75-95)
89.8 ± 4.32
89.5 (83-98)
0.027‡
Fasting insulin (mcU/mL) 8.17 ± 2.59
8.1 (5-15.3)
14.8 ± 7.49
11.4 (6.8-36.3)
<0.001†
HOMA 1.74 ± 0.59
1.65 (0.96-3.47)
3.29 ± 1.71
2.55 (1.39-8.15)
<0.001†
AST (U/L) 19.21 ± 5.0
18 (13-30)
17.95 ± 3.88
17.5 (14-28)
0.47†
ALT (U/L) 14.78 ± 5.88
13 (7-30)
15.2 ± 5.73
14 (8-32)
0.82†
†
Mann-Whitney; ‡Student t test
TC = Total cholesterol; HDL = High density lipoprotein; LDL = Low density lipoprotein; VLDL= Very low density
lipoprotein; TC/HDL= total cholesterol/ high density lipoprotein; HOMA = Homeostasis Model Assessment; AST =
Table 3 – Variables of intestinal permeability of obese and lean women
Lean (n=20) Obese (n=20) p value
Mean±SD
Median (min-max)
Mean±SD
Median (min-max)
% Mannitol excretion 17.32 ± 7.31
17.4 (1.12 -32.77)
21.86 ± 7.77
21.6 (7.72-39.89)
0.06‡
% Lactulose excretion 0.247 ± 0.087
0.23 (0.05-0.419)
0.418 ± 0.267
0.37 (0.057-1.069)
0.041†
L/M ratio 0.0144 ± 0.006
0.013 (0.007-0.034)
0.018 ± 0.008
0.015 (0.007-0.035)
0.13†
‡
Student test, †Mann-Whitney test
Figure 1: Percentage of lactulose excretion in the lean and obese
groups. Obese group showed a higher lactulose excretion
(p=0.041).
Figure 2: Percentage of mannitol excretion in the lean and obese
groups. There was no difference between the groups (p = 0.06)
Figure 3: Lactulose/Mannitol ratio of lean and obese group. There
was no difference between the groups (p=0.13).
On the other hand, when dividing all volunteers by the median of the L/M ratio (appendix IV) differences between the groups above and below the median of L/M ratio related to anthropometric and body composition variables were not observed, but women that presented L/M values above the median had lower HDL levels and higher values of TC/HDL ratio, LDL/HDL ratio, insulin, HOMA index and % of lactulose excretion (p<0.05).
the variables. From this perspective, 25% of all volunteers (n=10) presented insulin resistance, being only one from the lean group and the others from the obese group. Comparing women with a HOMA index above and below 2.71 (appendix V) in the insulin resistant volunteers all anthropometric and body composition variables analyzed were higher (p<0.05). Interestingly, of all the comparisons performed, this was the only one in which it was observed higher values for leukocytes, lymphocytes and platelets (p<0.05) in the group above the cut-off point. They also presented higher mannitol and lactulose excretion percentages (p<0.05).
Table 4 – Correlation of intestinal permeability measurements with anthropometric, body
composition and biochemical variables
Variables r
% M
p r
% L
p r
L/M p
Weight (kg) 0.18 0.26 0.30 0.05 0.28 0.07
BMI (kg/m2) 0.18 0.25 0.24 0.12 0.25 0.10
Body fat (%) 0.19 0.24 0.27 0.08 0.24 0.13
Body fat (kg) 0.18 0.25 0.29 0.06 0.28 0.07
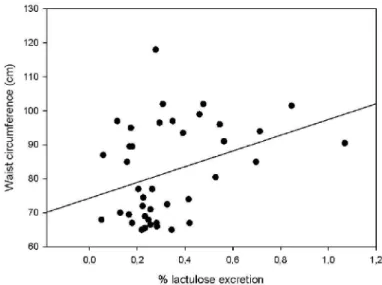
Waist circumference (cm) 0.22 0.16 0.32 0.04‡ 0.28 0.07
Abdominal circumference (cm)
0.18 0.24 0.33 0.03‡ 0.30 0.058
Waist/height ratio 0.22 0.16 0.25 0.10 0.18 0.25
HDL (mg/dL) 0.005 0.97 -0.27 0.08 -0.39 0.01‡
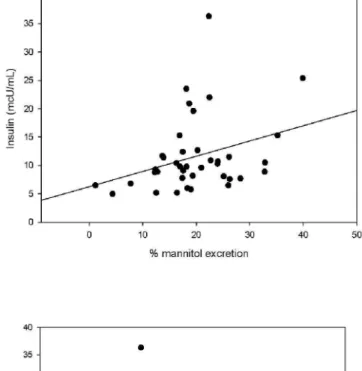
Fasting insulin (mcU/mL) 0.32 0.04† 0.46 0.002‡ 0.35 0.029‡
HOMA 0.32 0.04† 0.47 0.002‡ 0.39 0.014‡
†
Pearson correlation test; ‡Sperman correlation test
%M = percentage of mannitol excretion; %L= percentage of lactulose excretion; L/M = Lactulose/mannitol
Figure 4: Correlation (Spearman test) between percentage of lactulose
excretion and waist circumference (r=0.32, p=0.04).
Figure 5: Correlation (Spearman test) between percentage of lactulose
Figure 7: Correlation (Spearman test)
between percentage of lactulose excretion and insulin (r=0.46, p=0.002)
Figure 6: Correlation (Pearson test) between
percentage of mannitol excretion and insulin (r=0.32, p=0.04)
Figure 7: Correlation (Spearman test) between
percentage of lactulose excretion and insulin (r=0.46, p=0.002)
Figure 8: Correlation (Spearman test)
Figure 9: Correlation (Pearson test) between
percentage of mannitol excretion and HOMA index (r=0.32, p=0.04)
Figure 10: Correlation (Spearman test) between
percentage of lactulose excretion and HOMA index (r=0.47, p=0.002)
Figure 11: Correlation (Spearman test)
Figure 12: Correlation (Spearman test) between L/M ratio and
HDL concentration (r= -39, p=0.01)
4. Discussion
The most critical factor in the emergence of metabolic diseases is obesity (Kahn et al, 2006). The interpretation of obesity as a disease from the perspective of excessive body fat (Bays et al, 2008; Waisbren et al, 2010) reinforce the term ‘adiposopathy’, which has been proposed to describe a pathogenic adipose tissue anatomically manifested by adipocyte hypertrophy, visceral adiposity and/or ectopic fat deposition, all of which could contribute to metabolic diseases (Bays et al, 2008). Obesity is one of the essential components included among some definitions proposed for metabolic syndrome, together with glucose intolerance, hypertension and dyslipidemia, (WHO, 1999; ATP III, 2001; Eckel et al, 2005). All of the screening variables used to identify this picture (Després & Lemieux, 2006) were evaluated in this study.
risk. Besides, HDL concentration in the obese group was significantly lower compared to the lean group and 90% of obese women were below the theorethical cut-off point for HDL concentration (< 50mg/dL) considered as a criterion for metabolic syndrome diagnosis (Alberti et al, 2009). The higher blood insulin and HOMA index, which are associated with higher abdominal fat accumulation, observed among obese volunteers signals to the presence of insulin resistance (Kahn et al, 2006). Insulin resistance theory provides mechanistic explanations to the observed tendency to higher blood pressure (Reaven et al, 1996), higher plasma glucose (Jellinger, 2007) and lower HDL-cholesterol concentrations (Laws & Reaven, 1992; Razani et al, 2008) observed in the obese group.
The upmost finding of this study was the higher lactulose excretion observed in the obese group and its positive correlation with waist and abdominal circumference, fasting insulin and HOMA index. The relation between altered intestinal permeability, insulin resistance and adiposity has been first suggested by experimental models (Cani et al, 2009; Brun et al, 2006), and we our results restate this hypothesis for obese women. It was shown that higher body weight, BMI, waist and abdominal circumference, body fat weight and percentage, fasting insulin and the HOMA index were found in women with higher lactulose excretion.
dysregulated function of tight junctions and a leaky gut or a higher flux of molecules through the paracellular route (Farhadi et al, 2003a), future studies should also investigate the underlying causes of these altered paracellular permeability.
Some considerations should be pointed out, so that one might start drawing the possible mechanisms involved in many of the features of obesity: 1) higher lactulose excretion was positively correlated with HOMA index; 2) higher number of immune cells were observed when the volunteers were analyzed by the cut-off point for HOMA index; 3) obese microbiota is increased in relation to the Firmicutes/Bacteroidetes proportion (Bäckhed et al, 2009); 4) dysbiosis contributes to hepatic steatosis in obesity (Sabaté et al, 2008) and altered intestinal permeability has been shown in non-alcoholic fatty liver disease (Farhadi et al, 2008); 5) liver function’s can be altered in obesity due to insulin resistance and endotoxins (LPS) (Cani et al, 2007); 6) LPS challenge is positively correlated to TNF-α and with the degree of steatosis and HOMA index (Poniachik et al, 2006); 7) dysregulated function of tight junctions could result in higher endotoxins or LPS uptake (Cani et al, 2007) and in the activation of the local or systemic immune system (Farhadi et al, 2003a; Hollander, 1999) with production of cytokines such as TNF-α (Guha & Mackman, 2001); 8) TNF-α can mediate changes in the paracellular permeability (Capaldo & Nusrat, 2009) and the chronic infusion of LPS at very low dose leads to metabolic changes related to obesity (Cani et al, 2007); 9) LPS induces leptin expression in adipose tissue via a cytokine-dependent (TNF-α) mechanism (Finck et al, 1998); 10) a positive association between leptin, TNF soluble receptors and insulin levels has been suggested (Mantzoros et al, 1997) and 11) higher TNF-α expression in the adipose tissue of obese individuals is inversely related to insulin sensitivity (Kern et, 2001) and may contribute to obesity-related hyperleptinemia (Kirchgessner et al, 1997). Thus, we can suggest that the interactions between gut microbiota, immune system, adipose tissue, liver and hormones are the main framework behind or underlying the altered intestinal permeability in obesity.
5 . References
Alberti KG, Zimmet PZ. Definition, diagnosis and classification of diabetes mellitus and its complications. Part1 diagnosis and classification of diabetes mellitus provisional report of a WHO consultation. Diabet Med 1998, 15: 539–553. doi: 10.1002/(SICI)1096-9136(199807)15:7<539::AID-DIA668>3.0.CO;2-S.
Alberti KGMM, Eckel RH, Grundy SM et al. Harmonizing the metabolic syndrome: a joint Interim Statement of the International Diabetes Federation Task Force on Epidemiology and Prevention; National Heart, Lung, and Blood Institute; American Heart Association; World Heart Federation; International Atherosclerosis Society; and International Association for the Study of Obesity. Circulation 2009; 120:1640-1645. doi: 10.1161/CIRCULATIONAHA.109.192644.
Arrieta MC, Bistritz L, Meddings JB. Alterations in intestinal permeability. Gut 2006; 55:1512-1520. doi: 10.1136/gut.2005.085373.
Bäckhed, F. Changes in intestinal microflora in obesity:cause or consequence? J Pediatr Gastroenterol Nutr 2009; 48:S56-S57. doi: 10.1097/MPG.0b013e3181a11851.
Balkau B, Charles MA. Comment on the provisional report from the WHO consultation. European Group for the Study of Insulin Resistance (EGIR). Diabet Med 1999; 16:442–443.
Bays HE, González-Campoy JM, Henry RR et al. Is adiposopathy (sick fat) an endocrine disease? Int J Clin Pract 2008; 62(10):1474-1483. doi: 10.1111/j.1742-1241.2008.01848.x.
Bigorgne AE, Bouchet-Delbos L, Naveau S et al. Obesity-induced lymphocyte hyperresponsiveness to chemokines: a new mechanism of fatty liver inflammation
in obese mice. Gastroenterology 2008; 134:1459-1469.
doi:10.1053/j.gastro.2008.02.055.
Cani PD, Amar J, Iglesias MA et al. Metabolic endotoxemia initiates obesity and insulin resistance. Diabetes 2007; 56:1761-1772, 2007. doi:10.2337/db06-1491.
Cani PD, Possemiers S, Wiele TV et al. Changes in gut microbiota control inflammation in obese mice through a mechanism involving GLP-2-driven
improvement of gut permeability. Gut 2009; 58:1091-1103.
doi:10.1136/gut.2008.165886.
Capaldo CT, Nusrat A. Cytokine regulation of tight junctions. Biochim Biophys Acta; 1788: 864-871, 2009. doi:10.1016/j.bbamem.2008.08.027.
Després J-P, Lemieux I. Abdominal obesity and metabolic syndrome. Nature 2006; 444: 881-887. doi:10.1038/nature05488.
Duerksen DR, Wilhelm-Boyles C, Parry DM. Intestinal permeability in long-term follow-up of patients with celiac disease on a gluten free diet. Dig Dis Sci 2005; 50 (4): 785-790. doi: 10.1007/s10620-005-2574-0.
Eckel RH, Grundy SM, Zimmet PZ. The metabolic syndrome. Lancet 2005; 365(9468): 1415-1428. doi:10.1016/S0140-6736(05)66378-7.
Executive Summary of The Third Report of The National Cholesterol Education Program (NCEP) Expert Panel on Detection, Evaluation, And Treatment of High Blood Cholesterol In Adults (Adult Treatment Panel III). JAMA 2001; 285: 2486– 2497.
Farhadi A, Banan A, Fields J, Keshavarzian A. Intestinal barrier: an interface between health and disease. J Gastroenterol Hepatol 2003a; 18:479-497.
Farhadi A, Gundlapalli S, Shaikh M et al. Susceptibility to gut leakiness: a possible mechanism for endotoxaemia in non-alcoholic steatohepatitis. Liver Int 2008; 1026-1033. doi:10.1111/j.1478-3231.2008.01723.x.
Farhadi A, Keshavarzian A, Fields JZ, Sheikh M, Banan A. Resolution of common dietary sugars from probe sugars test of intestinal permeability using capillary column gas chromatography. J Chromatogr B 2006; 836(1-2):63-8. doi:10.1016/j.jchromb.2006.03.046.