Short-Term Effects of the Particulate Pollutants
Contained in Saharan Dust on the Visits of Children to
the Emergency Department due to Asthmatic Conditions
in Guadeloupe (French Archipelago of the Caribbean)
Gilbert Cadelis1*, Rachel Tourres1, Jack Molinie2
1Department of Pulmonary Medicine, Universitary Hospital of Pointe-a-Pitre, Pointe-a-Pitre, Guadeloupe, French West Indies,2Laboratory of Research in Geoscience and Energy, University of Antilles and Guyane, Pointe-a-Pitre, Guadeloupe, French West Indies
Abstract
Background:The prevalence of asthma in children is a significant phenomenon in the Caribbean. Among the etiologic factors aggravating asthma in children, environmental pollution is one of the main causes. In Guadeloupe, pollution is primarily transported by Saharan dust including inhalable particles.
Methods: This study assesses, over one year (2011), the short-term effects of pollutants referred to as PM10 (PM10: particulate matter,10mm) and PM2.5–10(PM2.5–10: particulate matter.2.5mm and,10mm) contained in Saharan dust, on the visits of children aged between 5 and 15 years for asthma in the health emergency department of the main medical facility of the archipelago of Guadeloupe. A time-stratified case-crossover model was applied and the data were analysed by a conditional logistic regression for all of the children but also for sub-groups corresponding to different age classes and genders.
Results:The visits for asthma concerned 836 children including 514 boys and 322 girls. The Saharan dust has affected 15% of the days of the study (337 days) and involved an increase in the average daily concentrations of PM10(49.7mg/m3vs. 19.2mg/m3) and PM2.5–10(36.2mg/m3vs. 10.3mg/m3) compared to days without dust. The excess risk percentages (IR%) for visits related to asthma in children aged between 5 and 15 years on days with dust compared to days without dust were, for PM10, ((IR %: 9.1% (CI95%, 7.1%–11.1%) versus 1.1%(CI95%,25.9%–4.6%)) and for PM2.5–10(IR%: 4.5%(CI95%, 2.5%–6.5%) versus 1.6% (CI95%,21.1%–3.4%). There was no statistical difference in the IR% for periods with Saharan dust among different age group of children and between boys and girls for PM10and PM2.5–10.
Conclusion: The PM10 and PM2.5–10 pollutants contained in the Saharan dust increased the risk of visiting the health emergency department for children with asthma in Guadeloupe during the study period.
Citation:Cadelis G, Tourres R, Molinie J (2014) Short-Term Effects of the Particulate Pollutants Contained in Saharan Dust on the Visits of Children to the Emergency Department due to Asthmatic Conditions in Guadeloupe (French Archipelago of the Caribbean). PLoS ONE 9(3): e91136. doi:10.1371/ journal.pone.0091136
Editor:Aimin Chen, University of Cincinnati, United States of America
ReceivedOctober 22, 2013;AcceptedFebruary 8, 2014;PublishedMarch 6, 2014
Copyright:ß2014 Cadelis et al. This is an open-access article distributed under the terms of the Creative Commons Attribution License, which permits unrestricted use, distribution, and reproduction in any medium, provided the original author and source are credited.
Funding:The authors have no support or funding to report.
Competing Interests:The authors have declared that no competing interests exist. * E-mail: gilbert.cadelis@chu-guadeloupe.fr
Introduction
The prevalence of asthma, especially in children, increased in the world over the last decade [1]. In the Caribbean, this disease represents a preoccupying public health problem [2]. In Guadeloupe (16u North latitude and 61u West longitude), the prevalence of asthma in children is higher than in France (14% versus 9%) [3]. Among the many etiologic factors causing asthma in children, pollution, especially particulate pollution, plays an important part [4].
The archipelago of Guadeloupe is periodically exposed to Saharan dust generating peak exposures to fine particles, which can last several days. This particulate pollution contributes to exceeding the particle thresholds set in relation to health protection. The desert sand dust is generated above the Sahara
desert. The production of dust is at its highest level between April and June. It is assessed at around 500 to 1000 tonnes per year [5]. The dust particles, captured by the winds at the ground surface, are driven to tropospheric altitudes. These particles are transport-ed as suspendtransport-ed matter, at an altitude between 1500 and 6000 m of the African desert, towards the West, over the Atlantic Ocean, and they reach the United States due to the influence of the maritime trade winds. They therefore pass via the Caribbean, between April and October, and settle through wet or dry processes [6]. The granulometric measurements performed on the particles, at more than 100 km from the dust source, showed that the median diameter rapidly decreases below 10mm [7]. During a dust episode, the concentration in particles can reach 2000mg/m3
as a maximum hourly average [7]. The majority of the dust particles measure less than 10m/m of aerodynamic diameter and
are thus inhalable, as the smallest particles can easily penetrate inside the respiratory tracts and therefore reach the bronchi and the small airways. The Saharan particles are of mineral origin and result from the progressive abrasion of rocks. They are essentially made of quartz, silicon oxide, clay, and carbonates. They contain iron and are also covered with organic matter (bacteria and viable spores, grains of pollens) [8]. The experimental studies performed on rats revealed the toxic and inflammatory potential of desert dust for airways [9]. Epidemiologic studies have shown that this desert particulate pollution increased morbidity and mortality as well as aggravated the condition of patients suffering from chronic respiratory diseases [10], [11]. Few studies exist on the connections between Saharan dust and asthma. For example, in the Caribbean, only two studies have focused on the effects of Saharan dust on asthma in children and have provided contradictory results [12], [13].
This study concerns the city of Pointe-a-Pitre and its suburbs located on the archipelago of Guadeloupe, which, each year, is exposed to Saharan dust during several months.
We have studied, over one year, the effects of particulate pollutants (PM10, PM2.5–10) contained inside Saharan dust on the
aggravation of asthma in children, by considering as a criterion, the number of visits of asthmatic children to the paediatric emergency department of the main medical facility of the archipelago. Our main assumption was based on a possible association between the intrusion of dust from the Sahara on the territory and the visits of asthmatic children to the emergency department.
Materials and Methods
A Ethics Statement
This study has been approved by the Institutional Review Board of the French Learned Society for Respiratory Medicine (Socie´te´ de Pneumologie de Langue Franc¸aise; CEPRO: 2013/018). Due to the fact that the data file has been anonymised, the name of the participants was not necessary for the analysis, and therefore we did not collect the participants’ names. The evaluation committee for observational research (CEPRO ) of the Institutional Review Board of the French Learned Society for Respiratory Medicine (Respiratory Society of French Language) estimated that this study was purely observational and consent written and informed consent of participants was not necessary because the research involves no intervention or contact with the patient.
B/Study Area
The study area concerned the suburbs of the city of Pointe-a-Pitre, including all of the Grande Terre area, a region of the archipelago of Guadeloupe (16u North latitude and 61u West longitude), which is a French department located in the Caribbean. This area has a regular relief and is a large limestone plateau. It has a surface of 588 km2 with 197,603 inhabitants (Nation Institute of Statistics and Economic Surveys (INSEE); 2011) and a density estimated at 336 inhabitants/km2. The suburbs are crossed by roads but do not include any heavy industries.
C/Population Under Study
The sanitary data were collected by the university hospital centre of Pointe-a-Pitre, the main medical structure of the department, which receives more than 65,000 visits in the emergency department each year, including 20,000 children. This centre is equipped with IT tools (IT extraction software) which are used for collecting medical data (visits to the emergency
department). The daily visits due to the aggravation of asthma were codified according to the international classification of diseases (CIM 10thedition) (J45–J46). The information provided by data extraction corresponded to the number of visits per day for asthma conditions to the paediatric emergency department, as well as administrative data concerning the age and gender of the children admitted in the health emergency structure. The study was carried out from January 1, 2011 to December 31, 2011 and concerned asthmatic children aged between 5 and 15 years old (included).
D/Exposure Data
The days on which the dust intruded on the territory (index days) could be detected thanks to American meteorological satellite data available in real time on the following website: ‘‘Aerosol looper’’ [14]. The exposure data for the pollutants were provided by the regional agency approved by the public authorities for the quality of air, established at Pointe-a-Pitre. The agency has 4 measuring stations (3 fixed urban and peri-urban stations and 1 mobile stations), which regularly measure the following pollutants: PM10(particles suspended in the air, with a
median diameter lower than 10 micrometres, PM2.5 (particles
suspended in the air, with a median diameter lower than 2.5 micrometres, sulphur dioxide (SO2), nitrogen dioxide (NO2), the
nitric oxide (NO) and ozone (O3).
The P2.5–10particles were calculated by subtracting the values of
the PM10 and PM2.5 particles. For each pollutant, the daily
average was determined by calculating the arithmetic average of the time values measured between 0.00 and 24.00. For ozone, the maximum value of the rolling averages over 8 hours was chosen. The daily climatic parameters were provided by the regional meteorological station located at the airport of the city of Pointe-a-Pitre. The periods of maximum pollen emissions were determined according to the pollinic calendar of the department. The pollen calendar for the Pointe-a` Pitre region (Guadeloupe) is a provisional calendar. The pollen characterization and count was carried out in 2004 by the Palynology lab of the Higher National School of Aerobiology (ENSA) in Montpellier, France. The responsible taxa corresponded to the Poaceae family (cereal) for 43% and to the Mimosaceae family for 16% of the cases. The pollination, taking into account the climate, is perennial in Guadeloupe. The responsible taxa represent the majority of emissions. The maximum emissions correspond to a period of around one week over a month. In the absence of a daily count of pollen on our territory, we only considered periods involving maximum emission of taxa.
The data on influenza epidemics were obtained by consulting the regional agency for monitoring influenza on the territory. The Regional Flu Monitoring Agency uses the number of flu consultations collected by the network of sentinel physicians practicing in the territory of Guadeloupe and from all the emergency cases at the region’s hospitals. An epidemic is declared when the epidemic threshold set by the agency on the percentage increase in the number of flu consultations is reached (2 to 3% per week).
E/Statistical Analysis
Descriptive statistics were employed to describe all of the variables of this study for periods with and without the intrusion of Saharan dust.
means of the Student’s t-test or Mann-Whitney’s test for days with and without intrusions of Saharan dust.
Pearson’s correlations were calculated for the PM10, PM2.5–10
and PM2.5.
The chronological series, for particulate and gaseous pollutants, were produced graphically in order to observe their temporal distribution during the study period.
The frequency of visits due to asthmatic conditions per month during the study period was illustrated graphically.
The association between the daily concentrations in PM10and
PM2.5–10 and the daily visits due to asthmatic conditions in
children were analysed by means of a time-stratified case-crossover study [15].
In this type of approach, each case has its own control: the exposure of a subject during the sanitary event (case period) is compared to the exposure of the same subject during one or several different moments (control period) where, a priori, the subject did not present the medical condition [16].
In agreement with the methods of this approach, the control periods were selected so as to correspond to the same day of the week and to the same month as the case day in order to minimise possible bias concerning trends and seasonality of the time series [16].
The effects of an exposure to the PM10 and PM2.5–10 were
examined the same day (lag0) and up to 2 days before the exposure (lag2) but also by averaging the pollutant concentrations corre-sponding to two days before, one day before until the day of the event (lag0–2), (lag0–1).
We carried out a multivariate conditional logistic regression to estimate the odds ratio (ORs) by adjusting, on the climatic variables (temperature, humidity), the days of influenza epidemics (binary variable), and the days of maximum taxa emissions (binary variable) on bank holidays and during holidays (binary variable).
A binary variable was created for the days with and without Saharan dust. An interaction term between the average concen-trations in PM10and PM2.5–10and the presence of Saharan dust
was introduced into the modelling.
The analysis of sub-groups was based on the age categories (5 to 8 years old, 9 to 11 years old and 12 to 15 years old) and on the gender of the children (male or female).
The results were presented in the form of an excess risk percentage (IR %) with a confidence interval at 95% (CI 95%) for visits due to asthmatic conditions to the emergency department for an increase of 10mg/m3of PM10and PM2.5–10pollutants. These
results were produced during two periods, with and without Saharan dust. The calculation of the IR % for an increase of 10mg/m3for PM10and PM2.5–10has been carried out using the
following formula: (exp (ß*10)21)6100%, where ß is the model
estimate. We also tested a bi-pollutant model with PM2.5 and
PM2.5–10.
The statistical processing and analysis of data were carried out from an anonymised file using version 2.1.3.0 of R software. The significance threshold was set at 5% for all of the statistical tests.
Results
1/Population Under Study
The study period included 337 days of observation, including 52 days (15% of the days of observation) involving the presence of Saharan dust (index days) and 285 days without Saharan dust.
During the study period, 836 visits to the emergency department took place in relation to asthmatic conditions in children aged between 5 and 15 years old. This figure included 58% (n = 489) of children aged between 5 and 8 years old, 27%
(n = 222) of children aged between 9 and 11 years old and 15% (n = 125) of children aged between 12 and 15 years old. There were more boys (n = 514) than girls (n = 322). The sex ratio was of 1.6 in favour of the boys.
The ratio between boys and girls was comparable during the periods with and without Saharan dust.
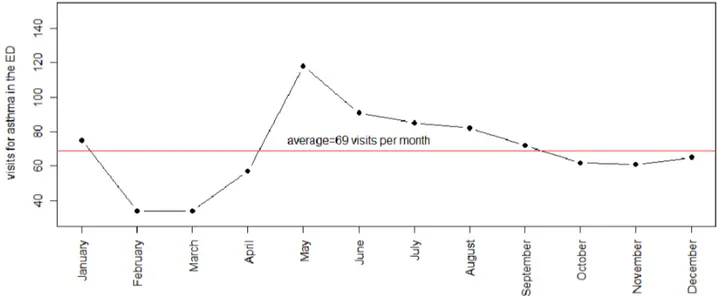
Figure 1 shows the frequency of visits due to asthmatic conditions per month during the study period. The number of visits to the emergency department was higher from May to September.
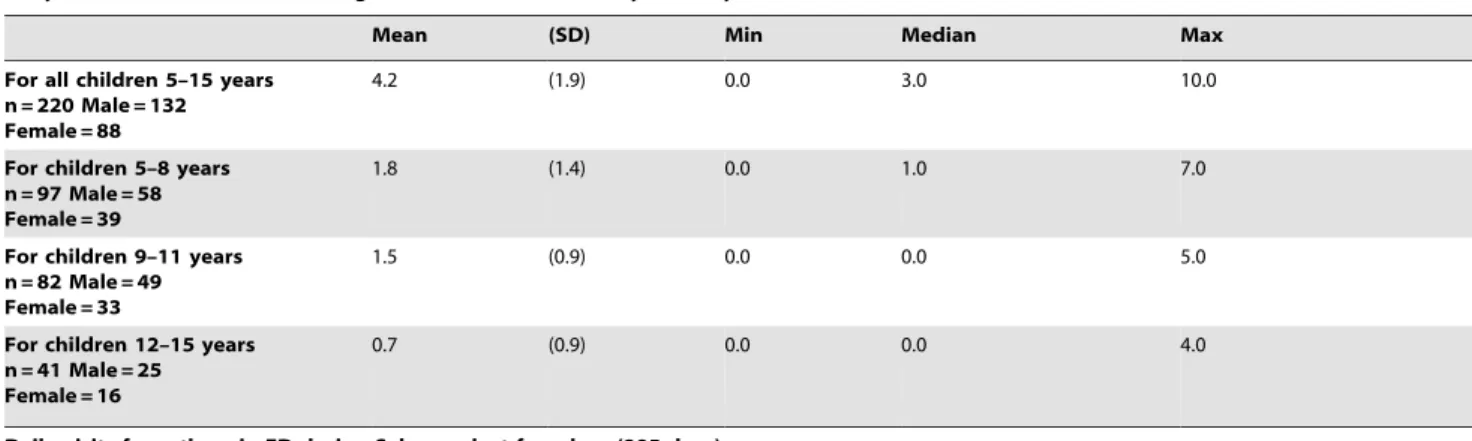
Table 1 indicates the average and the number of visits per day to the emergency department due to asthmatic conditions for all children (5 to 15 years old) and for each age section being studied (5 to 8 years old, 9 to 11 years old, 12 to 15 years old) during periods with and without Saharan dust. The number of visits to the emergency department due to asthmatic conditions amounted to 220 visits for all of the children for the 52 days during which the presence of Saharan dust was detected and to 616 visits for the 285 days without Saharan dust.
For all the children (5 to 15 years old), the average number of visits per day was higher during periods with Saharan dust compared to periods without Saharan dust (4.261.9 visits/day versus 2.161.8 visits/day; p = 0.02).
2/Data Concerning the Levels of Pollutants under Study and the Other Parameters of the Study: Climatic Variables, Periods of Influenza, Periods of Maximum Pollen Emissions
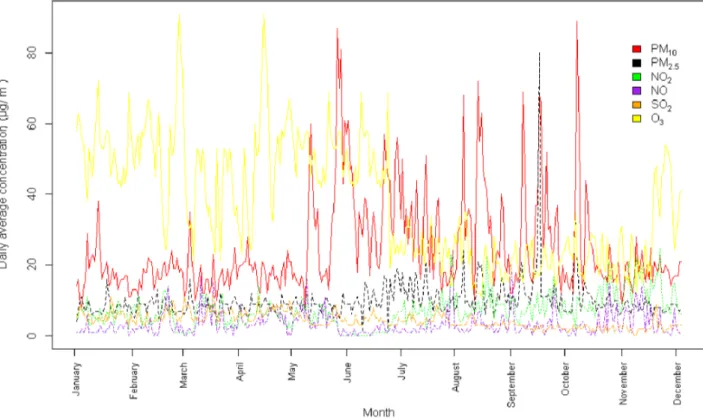
Figure 2 illustrates the temporal distribution of the average daily concentrations in pollutants during the months of the study for the following pollutants: PM10, PM2.5, NO2, NO, SO2, O3.
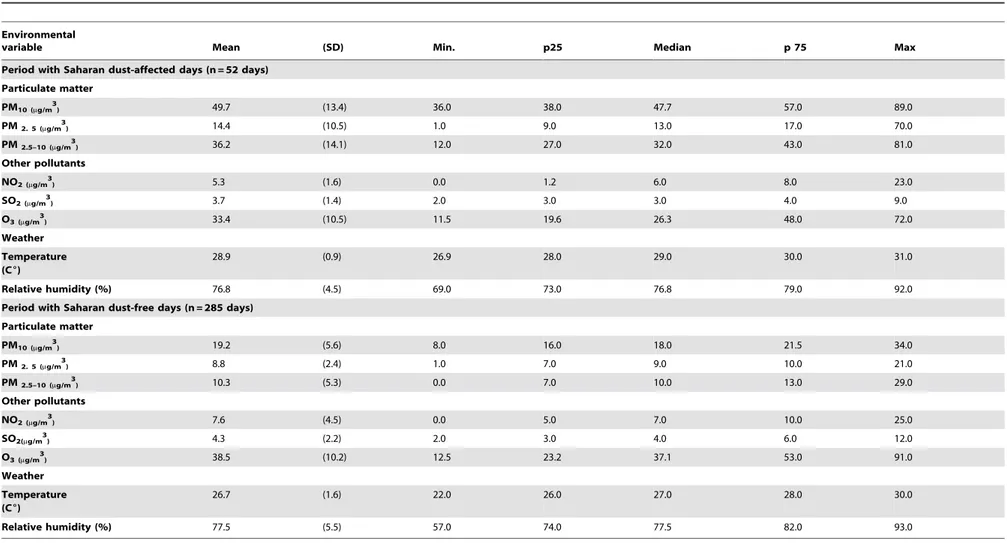
Table 2 describes the average daily concentrations in pollutants and average measurements of climatic parameters for periods with Saharan dust (n = 52 days) and periods without Saharan dust (n = 285 days).
The average daily concentrations in particulate pollutants were higher during days with Saharan dust compared to days without Saharan dust: PM10 (49.7613.4mg/m3versus 19.265.6mg/m3;
Student’s t tests, p = 0.001), PM2.5–10 (36.2614.1mg/
m3vs.10.365.3mg/m3; p = 0.001). PM2.5 (14.4610.5mg/m3
vs.8.862.4mg/m3; p = 0.001).
The PM2.5/PM10 ratio was of 0.2 on average on days with
Saharan dust and of 0.4 on days without Saharan dust.
For periods involving Saharan dust, the percentage of days with an average daily concentration in PM10exceeding 50mg/m
3
was of 38% (n = 20 days).
The average daily concentrations in NO2, SO2 and O3
pollutants were lower during days with Saharan dust compared to days without Saharan dust (p = 0.001, p = 0.001, p = 0.02, respectively).
PM2.5 and PM2.5–10 were moderately correlated (Pearson’ S
correlation coefficient = 0.24) while PM2.5and PM10and PM2.5–10
and PM10 were highly correlated (r = 0.64 and r = 0.96,
respec-tively).
The temperature was higher during the days with Saharan sand (p = 0.001), while the humidity was significantly comparable during the two study periods (p = 0.11).
The periods involving maximum pollen emissions represented 48% (n = 163 days) of all of days of observation (n = 337 days) and corresponded to 50% (n = 26 days) of the days with Saharan dust and 47% (n = 134 days) of the days without Saharan dust, without any significant difference in proportions between the two periods
Dust Sahara and Children Asthma
(p = 0.55). The relevant taxa were from the Poaceae family for 43% and from the Mimosaceae family for 16%.
Periods involving influenza represented 20% (n = 69 days) of days of observation. They concerned 7% (n = 4 days) of days with Saharan dust and 22% (n = 65 days) of days without Saharan dust with a significant difference in proportions between the two periods (p = 0.01).
3/Relation between Saharan Dust Episodes and the Number of Visits to the Paediatric Emergency Department Due to Asthmatic Conditions
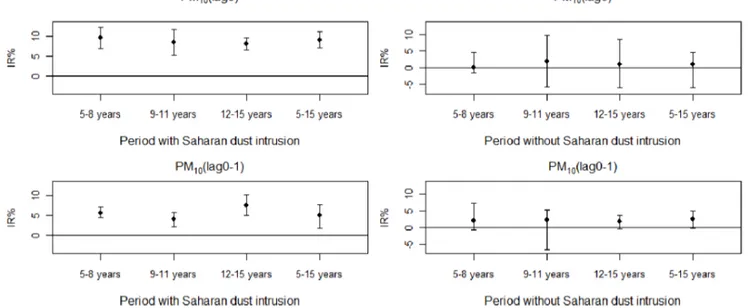
Figures 3 and 4 graphically represent the IR% of daily visits with a CI 95% for asthmatic conditions in sub-groups of children aged between 5 and 8 years old, 9 and 11 years old, 12 and 15 years old and all of the children aged between 5 and 15 years old for an increase of 10mg/m3of pollutants PM10and PM2.5–10at
lag 0 and at lag (0–1) during periods with and without intrusions of Saharan dust.
A statistically significant association is determined at lag0 and lag (0–1) for PM10 and PM2.5–10and the visits due to asthmatic
conditions during periods involving intrusions of Saharan dust, adjusted in relation to climatic parameters, periods of influenza and maximum pollen emissions, bank holidays and school holidays.
No statistically significant association was determined with pollutants PM10and PM2.5–10at lag0 and lag (0–1) for the visits of
children suffering from asthma during the period without Saharan dust.
The IR% with a CI95% for an increase of 10mg/m3 in
pollutants PM10 and PM2.5–10 for periods with and without
Saharan dust presented the following values (table S1 and S2). For PM10at lag 0:
For all children aged between 5 and 15 years old: the IR% was, during periods with and without Saharan dust, of 9.1% (CI95%, 7.1%–11.1%) versus 1.1% (CI95%, 25.9%–4.6%), respectively. The interaction between the index days and the association between the pollutant and the sanitary variable was significant (p value = 0.0012).
For the sub-groups of children during the periods with and without Saharan dust respectively: The IR% was, for children aged between 5 and 8 years old, of 9.5% (CI95%, 6.8%–12.2%) versus 0.1% (CI95%,21.4%–4.6%), for children aged between 9 and 11 years old, of 8.4% (CI95%, 5.2%–11.7%) versus 1.9% (CI95%,25.5%–9.7%), and for children aged between 12 and 15 years old of 8.0% (CI95%, 6.4%–9.6%) versus 1.1% (CI95%,2
5.9%–4.6%).
For PM10at lag (0–1):
For all children aged between 5 and 15 years old:
The IR % was, during periods with and without Saharan dust, of 5.1% (CI95%, 1.8%–7.7%) versus 2.4% (CI95%,20.3%–5%), respectively.
For the sub-groups of children during the periods with and without Saharan dust respectively: The IR% for children aged between 5 and 8 years old was of 5.7% (CI95%, 4.4%–7.1%) versus 2.0% (CI95%, -20.7%–7.2%), for children aged between 9 and 11 years old, of 4.0% (CI95%, 2.2%–5.8%) versus 2.2% (CI95%,26.8%–5.3%), and for children aged between 12 and 15 years old, of 7.5% (CI95%, 5.0%–10.3%) versus 1.7% (CI95%,2
0.4%–3.7%).
For PM2.5–10at lag 0:
For all children aged between 5 and 15 years old: the IR% was, during the periods with and without Saharan dust, of 4.5% (CI95%, 3.3%–5.7%) versus 1.6% (CI95%, 26.5%–10.4%), respectively. The interaction between the index days and the association between the pollutant and the sanitary variable was significant (p value = 0.002).
For sub-groups of children during periods: with and without Saharan dust, the IR% was, for children aged between 5 and 8 years old, of 6.2% (CI95%, 4.4%–8.1%) versus 2.9% (CI95%,2
2.5%–8.7%), for children aged between 9 and 11 years old, of 5.7% (CI95%, 3.3%–8.2%) versus 4.3% (CI95%,23.7%–12.8%), for children aged between 12 and 15 years old, of 4.8% (CI95%, 3.8%–5.9%) versus 4.3% (CI95%,23.7%–12.8%), respectively.
For PM2.5–10at lag (0–1):
For all children aged between 5 and 15 years old: the IR% was, during periods with and without Saharan dust, of 4.7% (CI95%, 2.5% –6.5%) versus 1.8% (CI95%,21.1%–3.4%), respectively.
Figure 1. Frequency of visits for asthmatic conditions per month in the pediatric emergency department (ED) during the study period (n = 337 days).
For sub-groups of children during periods with and without Saharan dust: the IR% was, for children aged between 5 and 8 years old, of 5.9% (CI95%, 5.0%–7.2%) versus 1.7% (CI95%, – 0.1%–4.4%), for children aged between 9 and 11 years old, of 4.9% (CI95%, 3.0%–6.9%) versus 1.8% (CI95%,20.2%–3.8%), for children aged between 12 and 15 years old, of 4.4% (CI95%, 2.8%–7.0%) versus 1.4% (CI95%,20.7%–3.6%), respectively.
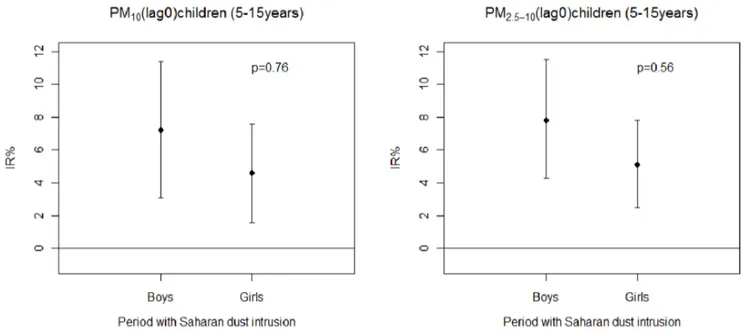
Figure 5 graphically represents the IR% of daily visits with a CI 95% due to asthmatic conditions per gender and for all children (5 to 15 years old) and for an increase of 10mg/m3 in pollutants
PM10and PM2.5–10at lag 0 for periods with Saharan dust:
For PM10: the IR% was of 7.2% (CI95%, 3.1%–11.4%) for
boys and of 4.6% (CI95%, 1.6%–7.6%) for girls.
For PM2.5–10: the IR% was of 7.8% (CI95%, 4.2%–11.5%) for
boys and of 5.1% (CI95%, 2.5%–7.8%) for girls.
There was no statistical difference in the IR% for periods with Saharan dust among different age group of children (Table S3, S4) and between boys and girls (Figure 5) for PM10and PM2.5–10at
lag0 and at lag (0–1).
The other delays (lag1, lag2, lag0, 2) tested for pollutants PM10
and PM2.5–10during the study period for all children and for the
sub-groups were not contributory. Results are reported in the table S5.
No significant effect was revealed for the PM2.5during periods
with and without Saharan dust at different delays. (Table S5). A bi-pollutant model was tested with pollutants PM2.5 and
PM2.5–10.Excess risks for PM2.5–10were not significantly modified
for all children at lag 0 and at lag (0–1).
Discussion
This study highlighted a statistically significant association between the PM10 and PM2.5–10 pollutants contained in the
Saharan dust and the visits made to the emergency department due to asthmatic conditions in children aged between 5 and 15 years old during the period involving Saharan dust intrusions.
This association resulted in an excess risk, on the actual day of exposure to the pollutants, of 9.1% (CI95%, 7.1%–11.1%) for the PM10and of 4.5% (CI95%, 2.5%–6.5%) for the PM2.5–10on days
involving Saharan dust intrusions with a significant interaction with the pollutants.
The level of average daily concentrations in PM10in this study
was comparable to that of the studies performed on pollution due to Saharan dust in Madrid (Spain) [11] or in Rome (Italy) [17]. The level of average concentrations in PM2.5–10 on days with
Saharan dust was relatively higher in our study compared to the study carried out in Madrid (average = 36.2mg/m3 versus 24.2mg/m3) [11], because the levels of concentration in PM2.5
had lower values in our study (14.4mg/m3versus 24.4mg/m3).
The former studies carried out in the Caribbean did not provide measurements of the concentrations in pollutants contained in the Saharan dust on days of pollution [12], [13]. The study performed by Gyan et al. only measured optical visibility whereas the study carried out by Prospero et al. was based on the measurement of the total rate of dust during Saharan dust intrusions.
As regards the level of gas pollution, for example for pollutant NO2in our study, the level of average daily concentrations was 10 Table 1.Daily visits for asthma in emergency department (ED) during Saharan dust-affected days and Saharan dust-free days in a study period.
Daily visits for asthma in ED during Saharan dust-affected days (52 days)
Mean (SD) Min Median Max
For all children 5–15 years n = 220 Male = 132 Female = 88
4.2 (1.9) 0.0 3.0 10.0
For children 5–8 years n = 97 Male = 58 Female = 39
1.8 (1.4) 0.0 1.0 7.0
For children 9–11 years n = 82 Male = 49 Female = 33
1.5 (0.9) 0.0 0.0 5.0
For children 12–15 years n = 41 Male = 25 Female = 16
0.7 (0.9) 0.0 0.0 4.0
Daily visits for asthma in ED during Saharan dust-free days (285 days)
Mean (SD) Min Median Max
For all children 5–15 years n = 616 Male = 362 Female = 254
2.1 (1.8) 0.0 2.0 8.0
For children 5–8 years n = 392 Male = 231 Female = 161
1.3 (1.5) 0.0 1.0 6.0
For children 9–11 years n = 140 Male = 87 Female = 53
0.4 (0.6) 0.0 0.0 2.0
For children 12–15 years n = 84 Male = 46 Female = 38
0.2 (0.5) 0.0 0.0 2.0
doi:10.1371/journal.pone.0091136.t001
Dust Sahara and Children Asthma
times lower than the level recorded in Madrid (5.3mg/m3versus
60.5mg/m3) [11]. Throughout the study period, gas pollution
(NO2, SO2) and chemical pollution (O3) remained at low levels of
daily concentrations and the thresholds set by the WHO were never exceeded. This can be explained by the absence of heavy industries on the archipelago and by the all-year-round presence of trade winds, which dispersed the gaseous and chemical pollutants. The chemical composition of the Saharan dust includes mineral elements: primarily quartz (60%), oxides (SiO2, FeO2) and
carbonates (CaCO3), but also iron, titanium and vanadium [7].
In certain cases, the dust intrusion episodes can involve peaks in sulphate resulting from the chemical reaction between the carbonates contained in the dust and the gaseous pollutants present locally (NO2, SO2) [7]. Toxicological studies reported that
the quartz, crystalline silica, aluminium and oxides contained in desert dust could cause an inflammation of the bronchi and lungs in rats due to a hyperproduction of cytokines [9], [18].
Studies have shown that the Saharan dust introduced, into the atmosphere, viable micro-organisms and other microbiological matter (pollen, lipopolysaccharide (LPS), viable mushrooms, mould, viruses, and bacteria) [8]. Several authors have reported an excess risk of mortality due to respiratory causes during Saharan dust intrusions [11], [17]. It has been known for a long time that pollutants, and especially particulate pollutants, aggra-vate asthmatic conditions in children [19]. It was reported that asthmatic children were more sensitive to air pollutants than non-asthmatic children [20].
In the Caribbean, children’s asthma is significantly predominant and the reasons are still unknown [21]. In Guadeloupe, the ISAAC study reported a prevalence of asthma in children of
14.1%, which was higher for boys than for girls (15% versus 13.1%) [3].
In our study, the population being analysed was important (n = 836 children) with a prevalence of boys (60% overall), which complied with the epidemiologic studies on asthma in children performed in our area. These results are also in agreement with the epidemiologic studies on asthma in children, which indicated a major incidence of asthma among boys [22].
The determination of an association between the visits to the emergency department due to asthmatic conditions and Saharan dust intrusions was carried out in this study based on a time-stratified case-crossover methodology. This approach offers several advantages:
It can be used for controlling the individual confounding factors as each case is its own control [16], which is interesting in relation to asthma where individual susceptibilities are to be considered and controlled. In addition, it also makes it possible to take into account individual characteristics such as age or gender to explore the effects of pollutants on the different sub-groups [23]. Moreover, it can be used to control trends and seasonality [24].
This study has highlighted an increase in risks with pollutants PM10 and PM2.5–10 during periods involving Saharan dust
intrusions. The effects were more marked with the PM10 than
with the PM 2.5–10with a significant interaction between these
particles and the index days. These effects were maximum and significant on the actual day of pollution. However, we did not reveal any effect with the PM2.5 on the visits for asthmatic
conditions regardless of the period being analysed; this could be explained by the low level of concentrations in PM2.5in this study,
adjusted to a low relative anthropic pollution observed on the archipelago [25].
Figure 2. Temporal distribution of pollutants (PM10, PM2.5, NO2, NO, SO2, O3) during the study period (n = 337 days) in Guadeloupe. Abbreviations: PM10particles with an aerodynamic diameter of 10mm or less, PM2.5particles with an aerodynamic diameter of 2.5mm or less, NO2 nitrogen dioxide, NO nitrogen oxide, SO2sulphur dioxide, O3ozone.
Table 2.Descriptive statistics of particulate matter, gaseous pollutants and meteorological variables during a period with Saharan dust-affected days and Saharan dust-free days.
Environmental
variable Mean (SD) Min. p25 Median p 75 Max
Period with Saharan dust-affected days (n = 52 days)
Particulate matter
PM10 (mg/m3) 49.7 (13.4) 36.0 38.0 47.7 57.0 89.0
PM2. 5 (mg/m3) 14.4 (10.5) 1.0 9.0 13.0 17.0 70.0
PM2.5–10 (mg/m3) 36.2 (14.1) 12.0 27.0 32.0 43.0 81.0
Other pollutants
NO2 (mg/m3) 5.3 (1.6) 0.0 1.2 6.0 8.0 23.0
SO2 (mg/m3) 3.7 (1.4) 2.0 3.0 3.0 4.0 9.0
O3 (mg/m3) 33.4 (10.5) 11.5 19.6 26.3 48.0 72.0
Weather
Temperature (C6)
28.9 (0.9) 26.9 28.0 29.0 30.0 31.0
Relative humidity (%) 76.8 (4.5) 69.0 73.0 76.8 79.0 92.0
Period with Saharan dust-free days (n = 285 days)
Particulate matter
PM10 (mg/m3) 19.2 (5.6) 8.0 16.0 18.0 21.5 34.0
PM2. 5 (mg/m3) 8.8 (2.4) 1.0 7.0 9.0 10.0 21.0
PM2.5–10 (mg/m3) 10.3 (5.3) 0.0 7.0 10.0 13.0 29.0
Other pollutants
NO2 (mg/m3) 7.6 (4.5) 0.0 5.0 7.0 10.0 25.0
SO2(mg/m3) 4.3 (2.2) 2.0 3.0 4.0 6.0 12.0
O3 (mg/m3) 38.5 (10.2) 12.5 23.2 37.1 53.0 91.0
Weather
Temperature (C6)
26.7 (1.6) 22.0 26.0 27.0 28.0 30.0
Relative humidity (%) 77.5 (5.5) 57.0 74.0 77.5 82.0 93.0
p25:25th percentile. p75:75th percentile. SD: standard deviation.
doi:10.1371/journal.pone.0091136.t002
Dust
Sahara
and
Children
Asthma
PLOS
ONE
|
www.ploson
e.org
7
March
2014
|
Volume
9
|
Issue
3
|
Samoli et al. objectified, in Athens, an increase in admissions for asthmatic conditions of 2.54% with the PM10 during periods
involving Saharan dust intrusions although the interaction between the presence of desert dust and the concentrations in PM10was not significant. This author also observed a maximum
effect of the PM10on the actual day of exposure [26].
A study performed in Toyama, in Japan, observed an association between desert dust from Mongolia and China and the hospitalisation of children due to aggravated asthmatic conditions, by using a quantitative measurement of mineral dust in air [27]. The risk of hospitalisation for asthmatic conditions was high for boys and the youngest children, but in this study, only 6
days involved desert dust intrusions [27]. In our study, the effects of the PM10 were marked, on days involving Saharan dust
intrusions, on young children (5 to 8 years old) while the PM2.5–10
had a pronounced effect on teenagers (12 to 15 years old). Both pollutants had an effect on boys and girls. Several explanations can be proposed: young children have a greater tendency to breathe through their mouth than their nose and we know that the breathing process (nasal, oral) is an important factor in the deposit and concentration of pollutants at the level of the bronchial tree [28]. In addition, their respiratory frequency is high and they have a greater pulmonary surface per weight unit than an adult [29]. Moreover, they spend more time outside and still have an
Figure 3. Percentage increase (IR %) of asthma-related visits to the ED for an increase of 10mg/m3of PM10on the day of the visit
(lag 0) or the previous 0 to 1 days (lag (0–1)) in each subgroup of children (aged 5 to 8 years old, 9 to 11 years old, 12 to 15 years old and 5 to 15 years old) during periods with and without Saharan dust intrusions.Error bars represent 95% confidence intervals. doi:10.1371/journal.pone.0091136.g003
Figure 4. Percentage increase (IR%) of asthma-related visits to the ED for an increase of 10mg/m3of PM2.5–10on the day of the visit
immature immune system. In addition, boys, especially the youngest, are hyperactive [30]. Our results are consistent with other studies, which reported that the effects of the pollutants were significant among boys and young children [22].
The difference between the effects of the PM10 and PM2.5–10
contained in dust on different age sub-groups is difficult to explain. A possible assumption concerns the location and quantity of dust deposit through the respiratory system. Venkataraman et al. showed that, on the basis of the mass of the particles, their deposit in the lungs and in the bronchi, was much higher with the PM10than with the PM2.5–10[31]. The inflammatory potential of
particles PM2.5–10is as experimentally high as for the PM10[32].
Lin et al. observed an increase in hospitalisations for asthmatic conditions in the presence of the PM2.5–10[33].
In the Caribbean, two studies with the contradictory results were undertaken with Saharan dust:
The first study was carried out on the island of Trinidad, it used optical visibility to measure the density of dust and revealed, by using a Poisson regression model, a significant association between the decrease in visibility and the admissions of children due to asthmatic conditions adjusted to climatic variables [12]. The second study carried out in Barbados did not show any association between Saharan dust and the number of admissions for asthmatic conditions in the main hospital of the island [13].
The disparity of the observations in the Antilles seems to suggest a strong dependency on the surrounding environment. The polluting industries, automobile traffic, and natural presence of pollen or aerosols in suspension in the atmosphere create local particularities specific to each island of the Caribbean. The intrusion of Saharan dust can therefore have different impacts, which are more or less significant, on the health of the population being exposed [34].
In the United States, a study determined an association between the PM10 from desert dust and hospital admissions due to
respiratory causes in Washington [35]. Another study performed in Anchorage (USA) highlighted an increase in hospital visits due
to asthma, bronchitis and high respiratory infections with PM2.5–10
particles from desert dust [36].
In Asia, two studies carried out in Korea [37], [38], showed the significant effects of desert dust on asthmatic children, while another study, carried out in Taiwan [39], did not find any connection. In Australia, an impact on severe asthma conditions was highlighted during dust periods [40].
There still are a limited number of studies, which have been carried out on desert dust. A majority of studies support the possibility that pollutants contained in desert dust have an effect on asthmatic children. However, these studies are difficult to compare because the exposure measurements are not sufficiently described and the confounding factors are not controlled sufficiently [41].
The strong point of our study is that it provides a complete description of the pollutants during periods with and without Saharan dust intrusions and it analyzes the effects of Saharan dust among groups of children of different age and gender in addition to pollutants. As far as we know, this study showed, for the first time, that particles PM2.5–10 contained in Saharan dust had an
impact on the visits of children to the emergency department due to aggravated asthmatic conditions during the study period.
However, our study presents a certain number of limitations: Firstly, this type of study is based on the assumption that all of the population under study was exposed to the same amount of pollutant, which cannot be verified. Moreover, it did not take into account the concentrations of pollutants actually inhaled by each child.
Furthermore, this study was carried out on a single site, which could lead to a selection bias.
In addition, the visits to the emergency department were counted by data-processing extraction according to the interna-tional classification of diseases (CIM 10th edition) J45–J46 and we cannot affirm the absence of errors in the codes.
Concerning pollen emissions, we used the pollinic calendar of the region, which is definitely less accurate than pollinic counting, which has not been implemented on the archipelago.
Figure 5. Percentage increase (IR %) of asthma-related visits to the ED for an increase of 10mg/m3of PM10and PM2.5–10on the day
of the visit (lag 0) in each subgroup of children (boys and girls) during a period with Saharan dust intrusions.Error bars represent 95% confidence intervals.
doi:10.1371/journal.pone.0091136.g005
Dust Sahara and Children Asthma
A bi-pollutant model was tested with the PM2.5and PM2.5–10
but not between the PM10 and PM2.5 or PM2.5–10 due to the
strong correlation existing between these pollutants. In addition, due to the fact that the gaseous and chemical pollutants did not show any connection with the sanitary variable, they were not tested by a bi-pollutant model.
Lastly, we did not obtain any data on the chemical or biological nature of the particles contained in the dust to confirm their mineral or anthropic origin.
Conclusion
This study showed that on days involving Saharan dust intrusions, during the study period, the PM10 and PM2.5–10
particulate pollutants contained in the dust were responsible for an excess risk for visits to the emergency department due to aggravated asthmatic conditions in children aged between 5 and 15 years old. These results deserve to be confirmed by other studies on this topic and could have interesting repercussions, especially concerning the implementation of preventive or therapeutic strategies aiming to improve the treatment of asthmatic children during days involving Saharan dust intrusions.
Supporting Information
Table S1 The excess risk percentages (IR %) with 95% confidence intervals (CI) of visits to the pediatric emergency department due to asthmatic conditions (stratified by age of the children) for an increase of 10mg/m3 of pollutants (PM10, PM2.5–10) on the day of
visit (lag 0) during periods with and without Saharan dust.
(DOCX)
Table S2 The excess risk percentages (IR %) with 95% confidence intervals (CI) of visits to the pediatric emergency department due to asthmatic conditions (stratified by age of the children) for an increase of 10mg/m3 of pollutants (PM10, PM2.5–10) on the previous
0 to 1 days of visit (lag 0–1) during periods with and without Saharan dust.
(DOCX)
Table S3 Comparison of IR% (excess risk percentages) between groups of children 5–8 years and 9–11 years during periods of Saharan dust for PM10and PM2.5–10at
lag 0 and lag (0–1).
(DOCX)
Table S4 Comparison of IR% (excess risk percentages) between groups of children 5–8 years and 12–15 years during periods of Saharan dust for PM10and PM2.5–10at
lag 0 and lag (0–1).
(DOCX)
Table S5 The excess risk percentages (IR %) with 95% confidence intervals (CI) of visits to the pediatric emergency department due to asthmatic conditions (for all the children (5–15 years) for an increase of 10mg/m3 of pollutants (PM10 and PM2.5–10 (lag1, lag2,
lag (0, 2), PM2.5 (lag0, lag1, lag (0, 1) lag2, lag0, 2))
during periods with and without Saharan dust.
(DOCX)
Author Contributions
Conceived and designed the experiments: GC RT JM. Performed the experiments: GC RT JM. Analyzed the data: GC RT JM. Contributed reagents/materials/analysis tools: GC RT JM. Wrote the paper: GC.
References
1. D’amato G, Baena-cagnani CE, Cecchi L, Annesi-Maesano I, Nunes C et al. (2013) Climate change, air pollution and extreme events leading to increasing prevalence of allergic respiratory diseases. Multidiscip Respir Med 1: 8–12. 2. Monteil MA, Joseph G, Changkrit C, Wheeler G, Antoine RM. (2005)
Comparaison of prevalence and severity of asthma among adolescents in the Caribbean islands of Trinidad and Tobago: results of a nationwide cross-sectional survey. BMC Public Health 14: 5–96.
3. Mounouchy MA, Cordeau L, Raherison C. (2009) Prevalence of asthma and related symptoms among adolescents in Guadeloupe: phase I of the ISAAC survey 2003. Rev Mal Respir 9: 944–51.
4. Mortimer KM, Neas LM, Dockery DW, Redline S, Tager IB. (2002) The effect of air pollution on inner-city children with asthma. Eur Respir J 4: 699–705. 5. Taylor DA. (2002) Dust in the wind. Environ Health Perspect 110: 80–7. 6. Middleton NJ, Goudie AS. (2001) Saharan dust: sources and trajectories. Trans
inst Br Geogr 26: 165–181.
7. Coz E, Gomez-Moreno JG, Pujadas M, Casucio GS, Lersch TL et al. (2009) Individual particle characteristics of North African dust under different long-range transport scenarios. Atmospheric Environment 43: 1850–1863. 8. Griffin DW.(2007) Atmospheric movement of microorganisms in clouds of
desert dust and implications for human health. Clin Microbiol Rev 20: 459–77. 9. Ichinose T, Yoshida S, Sadakane K, Takano H, Yanagisawa R et al. (2008) Effects of Asian sand dust, Arizona sand dust, amorphous silica and aluminum oxide on allergic inflammation in the murine lung. Inhal Toxicol 20: 685–694. 10. Middleton N, Yiallouros P, Kleanthous S, Kolokotroni O, Schwartz J, et al. (2008) 10-year time series analysis of respiratory and cardiovascular morbidity in Nicosia, Cyprus. Environ Health 1: 7–39.
11. Tobias A, Pe´rez L, Diaz J, Linares C, Pey J et al. (2011) Short-term effects of particulate matter on total mortality during Saharan dust outbreaks: A case – crossover in Madrid (Spain). Sci Total Environ 412: 386–389.
12. Gyan K, Henry W, Lacaille S, Laloo A, Lamsee-Ebanks C et al. (2005) African dust clouds are associated with increased pediatric asthma accident and emergency admissions on the Caribbean’s island of Trinidad. Int J Biometeorol 49: 371–6.
13. Prospero JM, Blades E, Naidu R, Mathison G, Thanie Haresh et al. (2008) Relation between African dust carried in the Atlantic trade winds and surges in pediatric asthma attendances in the Caribbean. Int J Biometeorol 52: 823–822. 14. Aerosollooper. Available:http://www.nrlmry.navy.mil/aerosol_web/loop_
html/globaer_centam_loop.html#.Accessed September 2013.
15. Maclure M, Mittleman MA. (2000) Should we use a case-crossover design? Annu Rev Public Health 21: 193–221.
16. Janes H, Sheppard L, Lumley T. (2005) Case-crossover analyzes of air pollution exposure data: referent selection strategies and their implications for bias. Epidemiology 16: 717–26.
17. Alessandrini ER, Stafoggia M, Faustini A, Gobi GP, Forastiere F. (2013) Saharan dust and the association between particulate matter and daily hospitalizations in Rome, Italy. Occup Environ Med 70: 432–434.
18. Mancino D, Vuotto ML, Minucci M. (1984) Effects of a crystalline silica on antibody production to T-dependent and T- independent antigens in Balb/c mice. Int Arch Allergy Appl Immuno 73: 10–13.
19. Tecer LH, Alagha O, Karaca F, Tuncel G, Eldes N. (2008) Particulate matter (PM2.5, PM10–2.5and PM10) and children’s hospital admission for asthma and respiratory disease: a bidirectional case-crossover study. J Toxicol Environ Health 71: 512–520.
20. Vedal S, Petkau J, White R, Blair J. (1998) Acute effects of ambient inhalable particles in asthmatic and non asthmatic children. Am J Respir Crit Care Med 157: 1034–43.
21. Howitt ME.(2000) Asthma management in the Caribbean- an update. Post grad Doctor Caribb 16: 86–104.
22. Dougherty RH, Fahy JV. (2009) Acute exacerbations of asthma: epidemiology, biology, and the exacerbation-prone-phenotype. Clin Exp Allergy 39: 193–202. 23. Jaakkola JJ. (2003) Case-crossover design in air pollution epidemiology. Eur
Respi J Suppl 40: 81–85.
24. Bateson T F, Schwartz J. (1999) Control for seasonal variation and time trend in case-cross studies of acute effects of environmental exposures. Epidemiology 10: 539–544.
25. Cadelis G, Tourres R, Molinie J, Petit RH. (2013) Exacerbations of asthma in Guadeloupe (French West Indies) and volcanic eruption in Montserrat (70 km from Guadeloupe). Rev Mal Respir 30: 203–14.
26. Samoli E, Nastos PT, Paliastos AG, Katsouyanni K, Priftis KN. (2011) Acute effects of air pollution on pediatric exacerbation: Evidence of association and effect modification. Environ Res 3: 418–24.
27. Kanatani KT, Ito I, Al-Delaimy WK, Adachi Y, Mathews WC et al. (2010) Desert dust exposure is associated with increased risk of asthma hospitalization in children. Am J Resp Crit Care med 182: 1475–1481.
29. Arcus-Arth A, Blaisdell RJ. (2007) Statistical distribution of daily breathing rates for narrow age groups of infants and children. Risk Anal 27: 97–110. 30. Bateson TF, Schwartz J. (2007) Children’s response to air pollutants. J Toxicol
Environ Health A 71: 3,238–243.
31. Venkataraman C, Kao AS. (1999) Comparaison of particle lung doses from the fine and coarse fractions of urban PM10aerosols. Inhal Toxicol 11: 151–169. 32. BruneKreef B, Forsberg B. (2005) Epidemiological evidence of effects of coarse
airborne particles on health. Eur respire J 26: 309–318.
33. Lin M, Chen Y, Burnett RT, Villeneuve PJ, Krewski D. (2002) The influence of ambient coarse particulate matter on asthma hospitalization in children : case-crossover and times-series analyses. Environ Health Perspect 110: 575–581. 34. Monteil MA. (2008) Saharan dust clouds and human health in the
English-speaking Caribbean: what we know and don’t know. 30: 439–43.
35. Schwartz J. (1996) Air pollution and hospital admissions for respiratory disease. Epidemiology 7: 20–28.
36. Gordian ME, Ozkaynak H, Xue J, Moriss SS, Spengler JD. (1996) Particulate air pollution and respiratory disease in Anchorage, Alaska. Environ Health Perspect 104: 290–297.
37. Park JW, Lim YH, Hyung SY, An CH, Lee SP et al. (2005) Effects of ambient particulate matter on peak expiratory flow rates and respiratory symptoms of asthmatics during Asian dust periods in Korea. Respirology 10: 470–476. 38. Hong YC, Pan XC, Kim SY, Park K,Park EJ, et al. (2010) Asian dust storm and
pulmonary function of school children in Seoul. Sci Total Environ 408: 754– 759.
39. Yang CY, Tsai SS, Chang CC, Ho SC. (2005) Effects of Asian dust storm events on daily admission for asthma in Tapei, Taiwan. Inhal Toxicol 17: 817–821. 40. Rutherford S, Clark E, Mc Tainsh G, Simson R, Mitchell C. (1999)
Characteristics of rural dust events shown to impact on asthma severity in Brisbane, Australia. Int J Biometeorol 42: 217–225.
41. Hashizume M, Ueda K, Nishwaki Y, MichiKawa T, Onozuka D. (2010) Health effects of Asia dusts events : a review of the litte´rature. Nippon Eiseigaku Zasshi 65: 413–21.
Dust Sahara and Children Asthma