ACPD
4, 5455–5514, 2004Mesoscale modeling of combined aerosol and photo-oxidant
processes
M. Lazaridis et al.
Title Page
Abstract Introduction
Conclusions References
Tables Figures
◭ ◮
◭ ◮
Back Close
Full Screen / Esc
Print Version
Interactive Discussion
©EGU 2004
Atmos. Chem. Phys. Discuss., 4, 5455–5514, 2004 www.atmos-chem-phys.org/acpd/4/5455/
SRef-ID: 1680-7375/acpd/2004-4-5455 © European Geosciences Union 2004
Atmospheric Chemistry and Physics Discussions
Mesoscale modeling of combined aerosol
and photo-oxidant processes in the
eastern Mediterranean
M. Lazaridis1, A. Spyridaki1, S. Solberg2, J. Smol´ık3, V. ˇZd´ımal3,
K. Eleftheriadis4, V. Aleksandropoulou1, O. Hov5, and P. G. Georgopoulos6
1
Technical University of Crete, Department of Environmental Engineering, 73100 Chania, Greece
2
Norwegian Institute for Air Research (NILU), PO BOX 100, N 2007 Kjeller, Norway
3
Institute of Chemical Process Fundamentals, ASCR, Prague, Czech Republic
4
N.C.S.R. “Demokritos”, 15310 Agia Paraskevi, Athens, Greece
5
Norwegian Meteorological Institute, PO Box 43 Blindern NO-0313 Oslo, Norway
6
ACPD
4, 5455–5514, 2004Mesoscale modeling of combined aerosol and photo-oxidant
processes
M. Lazaridis et al.
Title Page Abstract Introduction Conclusions References Tables Figures ◭ ◮ ◭ ◮ Back Close
Full Screen / Esc
Print Version
Interactive Discussion
©EGU 2004
Abstract
Particulate matter and photo-oxidant processes in the Eastern Mediterranean have been studied using the UAM-AERO mesoscale air quality model in conjunction with the NILU-CTM regional model. Meteorological data were obtained from the RAMS prognostic meteorological model. The modeling domain includes the eastern Mediter-5
ranean area between the Greek mainland and the island of Crete. The modeling sys-tem is applied to study the atmospheric processes in three periods, i.e. 13–16 July 2000, 26–30 July 2000 and 7–14 January 2001. The spatial and temporal distribu-tions of both gaseous and particulate matter pollutants have been extensively studied together with the identification of major emission sources in the area. The modeling 10
results were compared with field data obtained in the same period. Comparison of the modeling results with measured data was performed for a number of gaseous and aerosol species. The UAM-AERO model underestimates the PM10 measured
concen-trations during summer but better comparison has been obtained for the winter data.
1. Introduction 15
Airborne particulate matter and photo-oxidants are important aspects of air pollution with very diverse effects ranging from human health to climate forcing. A major part of the aerosol mass is secondary particulate matter in the form of sulphate, nitrate, ammonium and organic aerosol particles formed by the oxidation of sulphur dioxide, nitrogen oxides and organic gaseous species. It is apparent that particulate matter is 20
not a single pollutant and its mass includes a mixture of many pollutants distributed differently at different sizes.
Southern Europe is characterized with large changes over the past few decades linked to a large increase in population, and land-use alterations. The above changes had an impact on the atmospheric composition, water availability and consequently 25
ACPD
4, 5455–5514, 2004Mesoscale modeling of combined aerosol and photo-oxidant
processes
M. Lazaridis et al.
Title Page Abstract Introduction Conclusions References Tables Figures ◭ ◮ ◭ ◮ Back Close
Full Screen / Esc
Print Version
Interactive Discussion
©EGU 2004
chemistry-transport models predict that the high ozone concentrations observed in summer over Europe are at a maximum around the Mediterranean sea, and more particularly in its Eastern part, exceeding very often the air quality standards and high concentrations of ozone and fine particles together were also observed (Lelieveld et al., 2002; Smol´ık et al., 2003). This is due to natural emissions of unsaturated hydro-5
carbons (including isoprene) which are highly reactive and continuing high emissions of anthropogenic gaseous and aerosol pollutants in Southern Europe (Hoffman et al., 1997; Pandis et al., 1992; Kavouras et al., 1998; Sotiropoulou et al., 2004). Aerosol yields obtained from experimental measurements and estimates (Pandis et al., 1992) also indicate that there are highly nonlinear aspects involved in the production of or-10
ganic aerosols (e.g. the yields for the monoterpenes and peroxyl radicals). In addition, human-induced forcing on the Mediterranean area is an increasing problem with com-plex consequences to quality of life and effects on radiative climate forcing.
It is therefore evident the need to study together the physico-chemical processes which control the dynamics of aerosols and photo-oxidants with a combination of mod-15
eling studies with extensive field measurements in the Mediterranean area. How-ever, there is scarce information concerning consistent measurement/modelling stud-ies combining regional, mesoscale and local scales to reveal the atmospheric com-position/variability of particulate matter (PM)(Ackermann et al., 1998; Lurmann et al., 1997; Seigneur, 2001; Russell and Dennis, 2000; Pilinis and Seinfeld, 1987).
20
Based on the above facts two extensive measurement campaigns were performed to examine the characteristics and dynamics of photochemical pollutants and fine parti-cles in the Eastern Mediterranean area between the Greek mainland and the island of Crete (Smol´ık et al., 2003). Sampling took place during 4 weeks in July 2000 and 1 week in January 2001 at the Finokalia station and onboard the research vessel 25
Aigeaion. The Finokalia station (35◦19′N, 25◦40′E) is a remote coastal site eastward
of Herakleion (the largest city of the island) atop a hill (elevation 130 m) facing the sea within the sector from 270◦to 90◦ (Mihalopoulos et al., 1997).
concen-ACPD
4, 5455–5514, 2004Mesoscale modeling of combined aerosol and photo-oxidant
processes
M. Lazaridis et al.
Title Page Abstract Introduction Conclusions References Tables Figures ◭ ◮ ◭ ◮ Back Close
Full Screen / Esc
Print Version
Interactive Discussion
©EGU 2004
trations of the major soluble ions collected over a one-year period. Ozone concentra-tions at Finokalia exhibit a well-defined seasonal cycle with a maximum during summer months and elevated levels (up to 80 ppbv) during daytime (summer) and over time pe-riods of several days (summer) (Kouvarakis et al., 2000). Furthermore, ozone levels in the Eastern Mediterranean seem to be dominated by long range transport (Kouvarakis 5
et al., 2000). In addition, Nss-SO4 and SO2 levels in Eastern Mediterranean were
strongly influenced by regional transport (Sciare et al., 2003).
During the measurement campaigns an extensive range of instrumentation was em-ployed to determine the physico-chemical characteristics of aerosol and gaseous pol-lutants. In particular, measurements focused on size-resolved sampling for the aerosol 10
mass on a daily basis with subsequent analysis for ionic species, crustal and trace elements. In addition, total aerosol mass, equilibrium trace gasses, as well as detailed size-distribution measurements in terms of aerosol number by optical and differential mobility methods for the fine aerosol fraction were undertaken. Other complementary measurements included black carbon concentration by optical transmission methods, 15
aerosol optical properties, and thermal analysis of selected samples. Relevant photo-oxidants and inorganic trace gases were monitored by prototype and conventional in-struments.
Photochemical modeling is a necessary component in the study of the dynamics of gaseous pollutants and particulate matter since it provides the platform for the under-20
standing of the variability and spatial-temporal patterns of these pollutants (Pilinis and Seinfeld, 1987; Binkowski and Shankar, 1995; Lurmann et al., 1997; Ackermann et al., 1998; Pai et al., 2000; Jacobson, 1997). A combined intensive modelling study and comparison with available experimental data for ozone/fine particles in the Mediter-ranean area should offer valuable information for characterizing their dynamics and 25
ACPD
4, 5455–5514, 2004Mesoscale modeling of combined aerosol and photo-oxidant
processes
M. Lazaridis et al.
Title Page Abstract Introduction Conclusions References Tables Figures ◭ ◮ ◭ ◮ Back Close
Full Screen / Esc
Print Version
Interactive Discussion
©EGU 2004
The specific objective of the current modeling work is mainly to evaluate and assess the importance of the local sources versus the transport component for the ambient concentration of the photochemical pollutants and fine particles in the eastern Mediter-ranean area. Another objective is the importance of the natural sources for the con-centration of the particulate matter and ozone. The comparison between experimental 5
field data and modeling results is aiming to verify the model applicability in the area un-der study and show the general physico-chemical characteristics of ambient gaseous and aerosol components.
A detailed modeling study has been performed using the UAM-AERO mesoscale air quality model (Lurmann et al., 1997). Meteorological input data were provided by the 10
RAMS (Pielke et al., 1992) prognostic meteorological model whereas gaseous regional data on background concentrations were obtained from the NILU-CTM model (Flatøy et al., 2000) and on particulate matter from the EMEP model (Simpson et al., 1995). The present study represents one of the first applications of a modified UAM-AERO model combined with the prognostic meteorological model (RAMS) for the southern 15
Mediterranean and comparison between modeled and measured data for particulate matter. In addition, the current modeling application is one of the first ones to study combined aerosol and photo-oxidant processes together with extensive comparisons with field data.
Predicted aerosol and gaseous species concentrations patterns in the eastern 20
Mediterranean area show the importance of the long range transport component and the significance of the natural emission sources. In agreement with previous stud-ies (Lurmann et al., 1997) it is observed that the model performance is sensitive to a number of parameters but mainly to particulate matter emission characteristics. De-termination of the aerosol wind resuspension is an important factor to evaluate the 25
ACPD
4, 5455–5514, 2004Mesoscale modeling of combined aerosol and photo-oxidant
processes
M. Lazaridis et al.
Title Page Abstract Introduction Conclusions References Tables Figures ◭ ◮ ◭ ◮ Back Close
Full Screen / Esc
Print Version
Interactive Discussion
©EGU 2004
2. Material and methods
2.1. Description of the domain
The model domain (58×74 grid points), covers SE Greece (the inner black rectangular included in Fig. 1). Five vertical layers were used: two below and three above the diffusion break. The grid was defined in the UTM coordinate system. The UTM zone 34 5
was used for the definition of the grid above Greece, which means a central meridian of 21◦E. The SW corner coordinates of the grid are the following (according to the
WGS84 system) Easting: 692089 and Northing: 3868229. This corresponds to the geographical coordinates: 34◦56′08′′latitude and 23◦06′02′′longitude.
The region of interest includes marine (the Aegean and Cretan Seas), islanded (Cy-10
clades, Crete) and continental (Attica and Peloponnesus) parts of southern Greece. A complicated topography (high mountains, deep sea and small islands scattered all over the sea), combined with the prolonged sunny and humid periods, the strong winds and the presence of one of the most polluted European cities (Athens) on the NW, inhabited by almost half of the country’s population, comprise the quite interesting character of 15
the area.
On the southern part of the modeling domain is the island of Crete which is located at the south of Greece, mid-distance between Athens and the northern African coast. It is mainly mountainous, with all major cities located at the north coast. The total population rises up to 600 000, while at summer periods this number can increase 20
significantly, due to a high load of tourism, part of which is scattered all over the island, but the majority is mainly concentrated along the northern coast.
The modelling results are compared with extensive measurements performed at the Finokalia which is a remote coastal site, situated on the top of a hill (elevation 130 m), at the NE part of the island (Smol´ık et al., 2003). In addition, the modelling results were 25
ACPD
4, 5455–5514, 2004Mesoscale modeling of combined aerosol and photo-oxidant
processes
M. Lazaridis et al.
Title Page Abstract Introduction Conclusions References Tables Figures ◭ ◮ ◭ ◮ Back Close
Full Screen / Esc
Print Version
Interactive Discussion
©EGU 2004
The emissions inputs, except for PM10 which were obtained from TNO (Berdowski et al., 1998), are from the EMEP database, from the CTM-NILU regional model (initial and background concentrations) and from detailed emission inventories for biogenic species (isoprene and terpenes), resuspended dust and sea salt (Alexandropoulou and Lazaridis, 2004; Lazaridis et al., 2003). The background and initial concentrations 5
for the 24 gaseous species considered in the model were obtained from the CTM-NILU regional model (Flatøy et al., 2000).
In detail among atmospheric pollutants, CO, SOx, NOx, NMVOC, NH3and PM were
selected for the study and their spatial resolution was increased using the allocation of emissions in several sources (EMEP/CORINAIR, 2002), landuse and population 10
density data. Particular interest was given in the estimation of natural emissions and especially for NMVOC (isoprene, terpene) emitted by vegetation, sea salt particles and resuspended soil dust (Andreae, 1995; Alexandropoulou and Lazaridis, 2004).
Emission estimates were compiled using the methodology given in “Atmospheric Emissions Inventory Guidebook”, CORINAIR (EMEP/CORINAIR, 2002). A bottom-up 15
approach is followed in the evaluation of biogenic and natural emissions using landuse and meteorology data (Simpson et al., 1995, 1999). Hourly temporal resolution is used for the natural emissions whereas the anthropogenic data were evaluated as annual averages. Furthermore, the emissions were spatially allocated on a 5×5 km2grid.
An example of the surface ozone and nitrogen oxides surface background concen-20
trations calculated with the CTM-NILU model is presented in Fig. 1, where high ozone and NOxconcentrations are calculated downwind of the Athens metropolitan area. The
above initial concentrations, representing 3-D hourly values (in ppm) were also used as background concentrations of the domain.
2.2. The three-dimensional photochemical modeling and prognostic meteorological 25
tools
ACPD
4, 5455–5514, 2004Mesoscale modeling of combined aerosol and photo-oxidant
processes
M. Lazaridis et al.
Title Page Abstract Introduction Conclusions References Tables Figures ◭ ◮ ◭ ◮ Back Close
Full Screen / Esc
Print Version
Interactive Discussion
©EGU 2004
been introduced in the UAM-AERO mesoscale model, including new preprocessors for biogenic and natural emissions. The emission inventories are based on EMEP data (EMEP, 2003), whereas more detailed inputs for biogenic emissions, resuspended dust, sodium and chlorine were calculated using newly developed methodologies com-bined with the UAM-AERO model. Simulations were initiated 24 h before the beginning 5
of each modeling period for having minimum effect on the model results from the initial conditions.
The UAM-AERO allows the use of various alternative chemical mechanisms. The one employed for this case study is the Carbon Bond-IV (CB-IV), where species are lumped according to the type of their C-C bonds. A large number of reactions, involving 10
47 species are taken into account.
The meteorological inputs were obtained using the RAMS (version 4.29) prognos-tic meteorological model (Pielke et al., 1992). RAMS combines a non-hydrostaprognos-tic cloud model (Tripoli and Cotton, 1982) and a hydrostatic mesoscale model (Mahrer and Pielke, 1977). It was developed for simulating atmospheric phenomena with res-15
olutions ranging from tens of kilometers to a few meters. There is no lower limit to the domain size or to the mesh cell size of the model finite difference grid. A general description of the model and its capabilities is given in Pielke et al. (1992).
2.3. Application of the modeling system in the eastern Mediterranean
The combined UAM-AERO and RAMS modelling framework has been applied to model 20
the summer and winter campaigns of the SUB-AERO programme which performed in two sites: the Finokalia station on the island of Crete (Greece) and aboard the research vessel “Aigeaion”, which cruised across the Eastern Mediterranean area between the Greek mainland and the island of Crete. Sampling took place during 4 weeks in July 2000 and at Finokalia for 1 week in January 2001.
25
ACPD
4, 5455–5514, 2004Mesoscale modeling of combined aerosol and photo-oxidant
processes
M. Lazaridis et al.
Title Page Abstract Introduction Conclusions References Tables Figures ◭ ◮ ◭ ◮ Back Close
Full Screen / Esc
Print Version
Interactive Discussion
©EGU 2004
26–30 of July, the second one chosen to coincide with the marine part of the campaign. The interest is focused on the understanding of the tropospheric gaseous and aerosol background of the area in question. At the same time, a comparison between summer and winter model results is attempted.
Extensive simulations have been performed during July 2000 and January 2001. 5
The synoptic conditions over the Central and Eastern Mediterranean in July 2000 were characterized by a high-pressure system over the Central and Eastern Mediterranean and Northern Africa. The passage of relatively shallow disturbances over Southern Europe towards the Balkans and the Black Sea resulted in the strengthening of the pressure gradient over NW Turkey and the Dardanelles Gap. As a result, a westerly 10
flow was evident on 15 and 16 while on the following seven days the Etesians were established. Between 18–28 July 2000 the air masses reached Finokalia from the north. They originated mainly from the western coast of the Black Sea and during the last three days of this period, where peak mass concentrations were observed, from the Aegean Sea. On the last two days, trajectories originated from north of Crete, 15
moved first to Africa and then changed direction, finally arriving at the Finokalia site from the southeast.
During the winter period the meteorological conditions were characterised by a low pressure system which on 6 January lay over the eastern part of the Mediterranean. A relatively strong northerly flow was evident over the NE Mediterranean, which dis-20
sipated throughout the following 24 h as the depression drew away towards the Mid-dle East. To the west, a deep and extended Atlantic depression covered Central and Southern Europe. This system reached the Central Mediterranean on 8 January and then moved north-eastward through the Balkans towards the Black Sea. From 8 to 9 January a southerly synoptic flow was established over the area of interest. As the 25
ACPD
4, 5455–5514, 2004Mesoscale modeling of combined aerosol and photo-oxidant
processes
M. Lazaridis et al.
Title Page Abstract Introduction Conclusions References Tables Figures ◭ ◮ ◭ ◮ Back Close
Full Screen / Esc
Print Version
Interactive Discussion
©EGU 2004
flow over the area under consideration was relatively weak. The wind field over the land was modified by the landscape. Over the Aegean maritime area a weak northerly current was established while over the Central Mediterranean and the Ionian Sea the synoptic flow was westerly. On 13 January a new depression from the west reached the Central Mediterranean while a strong anticyclonic circulation dominated over Cen-5
tral and Eastern Europe. These synoptic conditions favoured the development of a strong pressure gradient over the NE Mediterranean region. A strong southerly flow was evident over the Ionian Sea and the southern part of the Aegean while a strong easterly-north-easterly flow prevailed to the north.
The predicted spatial distribution of the concentration of ozone, nitrogen dioxide, 10
sulphur dioxide, sodium, ammonium in aerosol phase, carbon monoxide, resuspended dust and total PM10 are presented in Fig. 2 for 30 July 2000. Their spatial distribution
reveals higher concentrations of particulate matter, carbon monoxide, nitrogen dioxide and ozone downwind the Athens metropolitan area and also highlights the importance of the transport of pollutants from outside the modelling domain. This regional transport 15
is related with the prevailing meteorological conditions. The predicted pattern of O3
shows a band of high concentrations extending from the Athens metropolitan area to the middle of the Aegean Sea and lower concentrations in a narrow area at the western part of the domain and above the island of Crete.
The concentration of aerosol and gaseous pollutants in the area under study is de-20
pendent on the prevailing meteorological conditions and anthropogenic emissions due to regional transport infiltrate in few hours to the centre of the domain as shown in Fig. 2 for O3, NO2, SO2, PM and CO. Natural emissions such as sea salt and resuspended dust are correlated with the meteorological fields in the modelling domain. The spatial distribution of PM10encounters the production of sea salt and agrees well with the
pri-25
mary PM emission patterns. The spatial pattern of sodium is high over the Aegean sea and at lower levels onshore, which decreases at higher distances from the coastline. The spatial patterns agree well with the primary PM emission patterns.
ACPD
4, 5455–5514, 2004Mesoscale modeling of combined aerosol and photo-oxidant
processes
M. Lazaridis et al.
Title Page Abstract Introduction Conclusions References Tables Figures ◭ ◮ ◭ ◮ Back Close
Full Screen / Esc
Print Version
Interactive Discussion
©EGU 2004
the dynamic change in the concentration of pollutants in the eastern Mediterranean due to meteorological changes and emissions from local areas. In the morning of 14 July strong northwestern winds transport particulate matter from the Athens area to the southern part of the Aegean Sea and also result in considerable sea salt emissions. The same meteorological conditions prevail until 10:00 h. At this time then the wind 5
changes to north as depicted in Fig. 3b. From 17:00 h there is a decrease on the wind velocity and we have more stagnant meteorological conditions and finally at 21:00 h west wind directions are more pronounced. It is evident that the meteorological condi-tions are responsible to a large extent for the dynamics of the pollutant concentracondi-tions in the area and the consequent human exposure. Elevated particulate matter con-10
centrations are expected both with air-mass origins from the west/north-west (western Europe and continental Greece) and the south. The former would carry anthropogenic produced aerosols (with size distributions mainly in the fine sector), while the latter con-tribute to increases of coarse PM, transporting dust from North Africa and the Saharan desert. The Black Sea is expected also to contribute in anthropogenic aerosols (com-15
bustion, etc.), as well, while easterlies can contribute both to fine and coarse modes, depending on whether the air-parcel crosses urban or desert areas.
The regional transport for ozone and particulate matter can be also depicted in Fig. 4 where we present the surface concentration for the period 13–16 July 2000 at 12:00 h. A north westerly flow during this period is shown in Fig. 4 where elevated concen-20
trations of ozone and particulate matter infiltrate in the modelling domain. The same behaviour is also depicted for several chemical components such as carbon monoxide, nitrogen oxides, sulphur dioxide and volatile organic components.
Regional transport in the Mediterranean area of ozone and other pollutants is also occurring at higher altitudes and at the free troposphere as studied in several previous 25
environ-ACPD
4, 5455–5514, 2004Mesoscale modeling of combined aerosol and photo-oxidant
processes
M. Lazaridis et al.
Title Page Abstract Introduction Conclusions References Tables Figures ◭ ◮ ◭ ◮ Back Close
Full Screen / Esc
Print Version
Interactive Discussion
©EGU 2004
ments, one at Finokalia where the measurements were occurred, one above an urban area (Herakleion) and the other an average profile above the marine area. Ozone val-ues range between 29 and 36 ppb, for the whole winter modelling period. The ozone exhibits a daily profile, depending in a great extent to the mixing height fluctuations. Infiltration of ozone from the free troposphere to the surface area contributes to en-5
hanced concentration levels. However, there are scarce data on the vertical profiles of pollutants in the area and no comparison with the modelling results can be performed. The importance of the regional transport of PM10 and O3in the area of interest has been further examined using the UAM-AERO model and setting the particulate emis-sions in the modelling domain to zero. The average reduction in the PM10concentration
10
in the modelling domain ranged from 60% to 45% for the summer and winter modelling periods respectively. It is evident from these results the importance of the regional transport to the PM10 concentration in the eastern Mediterranean area. These results
reflect the prevailing meteorological conditions which occurred during the modelling pe-riod and are not including forest fire emissions and the Saharan dust input. Since the 15
modelling period corresponds to a few days no certain conclusions can be drawn for longer periods. However, the current results support previous studies in the area which showed the importance of the long range transport of pollutants in the Mediterranean area (Sciare et al., 2003; Zerefos et al., 2002).
Comparison with the experimental field data during summer and winter periods are 20
shown in Fig. 6 for O3. The measurements were performed at the northern part of the island of Crete, at the Finokalia station, at the town of Herakleion (Crete, 70 km west from Finokalia) and onboard the research vessel Aigeaion. As can be seen, the variation of the modeled results follows the same characteristics as the measured data during the measured period. Also, the diurnal variation of the predicted concentrations 25
has been found to be in qualitative agreement with the measured data.
ACPD
4, 5455–5514, 2004Mesoscale modeling of combined aerosol and photo-oxidant
processes
M. Lazaridis et al.
Title Page Abstract Introduction Conclusions References Tables Figures ◭ ◮ ◭ ◮ Back Close
Full Screen / Esc
Print Version
Interactive Discussion
©EGU 2004
surface at the summer period. Elemental carbon is expected to be underestimated, mainly due to the large number of fires in Greece at this period, a factor not taken into account by the model. Other important species are ammonium, sulphur, nitrates and of course sea-salt particles. From the speciated PM10 mass data it is important to note
the significance of the natural contribution (crustal oxides, sodium, chlorine) to the par-5
ticulate matter mass during the summer period (close to 54%). During the winter period the natural contribution is smaller (close to 31%). However, it has to be noted that the modelling period covers only a very small time interval and not certain conclusions can be drawn for longer periods. Figure 7c presents the average PM10concentration during
the winter campaign for the site of Finokalia (January 2001). The dominating species 10
are sulfates, nitrates, and crustal material. Other important compounds are Na+ and Cl−, mainly due to the fact that Finokalia is a coastal site.
In Tables 1–2 we present average predicted and observed concentrations for chem-ical resolved particulate matter species during the summer and winter simulation pe-riods. The comparison for the particulate matter is concentrated on the 24-h average 15
predictions. The comparison for the total PM10mass is better in the winter period
com-pared to the summer. Ammonium sulfate and crustal materials dominate the PM10 mass whereas nitrate and sea salt are also important species in the chemical mass closure.
Tables 3–5 contain the field concentration of trace gases, including those in equi-20
librium with aerosol species and their comparison with the modeling results for the Finokalia station during the summer period, at the research vessel Aigeaion and at Finokalia during the winter period. The modeling data follow the same trends as the experimental field results.
Figure 8 shows a comparison between calculated and measured daily average PM10
25
levels for both the summer and winter periods. There is a considerable underestimation for the PM10mass during summer and a more acceptable trend in the winter. At 12, 27
ACPD
4, 5455–5514, 2004Mesoscale modeling of combined aerosol and photo-oxidant
processes
M. Lazaridis et al.
Title Page Abstract Introduction Conclusions References Tables Figures ◭ ◮ ◭ ◮ Back Close
Full Screen / Esc
Print Version
Interactive Discussion
©EGU 2004
modeled and measured data. The average PM10 value from the modeling studies
over the whole winter simulation period is 9.3µg/m3 whereas for the summer period the value is 21.1µg/m3. The corresponding value for the measured data reaches the
14.6µg/m3for the winter period and 33.5µg/m3for the summer period. The difference
in the concentration levels can be also attributed to the underestimation of a number 5
of chemical components present in the particulate mass. For example there is an un-derestimation of Clorine and Sodium (sea-salt) particulate matter emissions, as well as, underestimation of the sulphate mass and crustal materials from Saharan dust episodes. In addition, forest fires in July 2000 contributed to PM mass but they were not included in the modelling study. Furthermore, an important fraction of the mea-10
sured particulate matter has not been chemically identified and this corresponds to the overall uncertainty in the comparison between model results and measured data. How-ever, the SO=4, NO−
3, NH
+
4, OC and EC concentrations are generally in good agreement
with the measured data as shown in Tables 1–2.
Figure 9 presents a comparison between measured and predicted SO=4 levels, for 15
the site of Finokalia during the second measurement campaign in January 2001. The agreement between modeling and measurement data is satisfactory. Sources of SO=4 are considered to be mainly anthropogenic from the Greek mainland and from long range transport. Co-variation with gaseous SO2and H2SO4proves the anthropogenic
origin from gas precursors. The SO=4 particles are mainly emitted from industrial 20
sources. The existence of the State Electricity Organization power plant at the city of Herakleion, as well as air-masses that originate from Athens can strongly influence the levels observed at the island of Crete.
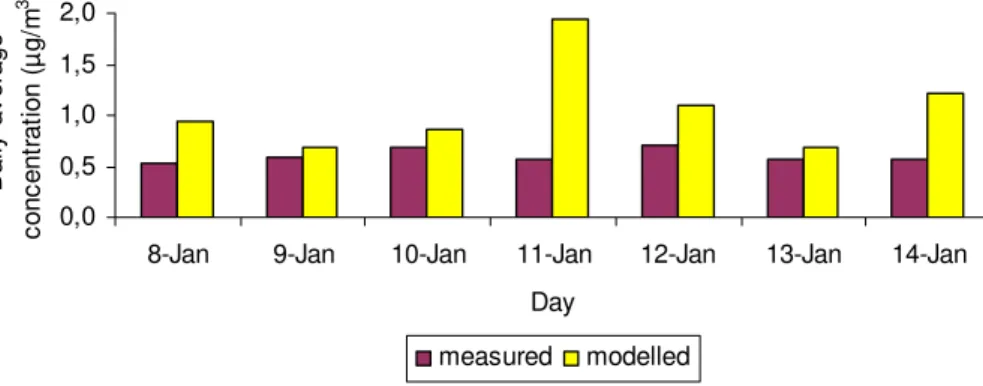
Figure 10 shows the comparison between modeled and measured concentrations for Na+. Particles that originate from the sea are strongly affected by the wind and 25
the contribution to the Finokalia station which is a coastal station is very important. The modeling data in general are in good agreement with the measured data except on 11 January where the measured average Na+ concentration is close to 0.5µg/m3
ACPD
4, 5455–5514, 2004Mesoscale modeling of combined aerosol and photo-oxidant
processes
M. Lazaridis et al.
Title Page Abstract Introduction Conclusions References Tables Figures ◭ ◮ ◭ ◮ Back Close
Full Screen / Esc
Print Version
Interactive Discussion
©EGU 2004
Despite the fact that the simulation periods are short to enable extraction of seasonal trends of pollutants, differences between summer and winter periods are clear both at quantitative and diurnal variation patterns observed. Pollutants strongly dependent on solar activity exhibit a more stable throughout the day pattern. At the same time the values measured at winter are a lot lower than the ones corresponding to the summer 5
period for the cases of ozone, isoprene, PAN, OH and other photooxidants, while the levels of their precursors appear elevated (NO, NO2, etc.). Especially, particulate
mat-ter concentrations are lower during winmat-ter mainly due to reduced dust resuspension from the soil and small photochemical activity.
From the modeling results and the comparison with the measured data it can be 10
resulted that the Eastern Mediterranean is characterized by a quite heavy aerosol load during summer from anthropogenic (SO=4, NO−
3), biogenic (NH
+
4), Saharan dust and
sea-emitted/natural (Na+, Cl−) aerosols. Transport contributes significantly on the high
levels observed at remote sites. Most common species are related to the existence of sulfate, nitrate, ammonium ions, sea salt and Saharan dust, with the formation of 15
(NH4)2SO4to be of the most important secondary aerosol as also observed from
mea-surements and supported from the modeling results (Kouvarakis et al., 2002).
3. Conclusions
The combined UAM-AERO/RAMS modeling system is an efficient platform for simulat-ing the transport/dynamics of particulate matter and photo-oxidant precursors. The 20
UAM-AERO model has been applied to simulate the dynamics of PM and photo-oxidants in the eastern Mediterranean area.
The modeling studies with the combined UAM-AERO and CTM-NILU reveal the im-portance of photo-oxidant and fine aerosols dynamics in the Mediterranean area and the significant contribution of regional transport in the observed pollution levels. Me-25
con-ACPD
4, 5455–5514, 2004Mesoscale modeling of combined aerosol and photo-oxidant
processes
M. Lazaridis et al.
Title Page Abstract Introduction Conclusions References Tables Figures ◭ ◮ ◭ ◮ Back Close
Full Screen / Esc
Print Version
Interactive Discussion
©EGU 2004
centrations during summer. During the winter experimental campaign the comparison between the model results and the experimental data is better.
Discrepancies between modelled and measured data for the particulate matter are mainly due to unresolved particulate matter emissions such as Saharan dust and forest fire emissions. The measured values show that resuspension from soil is an important 5
factor in determining the aerosol size distribution during the summer period. This fact demonstrates the need for chemical quantification of particulate matter emission inven-tories in Europe, as well as the need for better determination of the effect of Saharan dust, wild forest fires, and resuspended dust emissions in Southern Europe.
The particulate matter is mainly composed by sulfate, sea salt and crustal materials 10
with also significant amounts of nitrate, ammonium and organics. In general the area of the eastern Mediterranean is moderately to highly polluted during summer with a contribution from the main urban conglomerations, whereas during the winter period the particulate matter and oxidant concentrations are lower than the summer values.
Acknowledgements. This work was supported by the European Commission under grant
15
ENVK2-1999-00052. We also would like to thank S. Pandis (Carnegie Mellon University) for his helpful comments and suggestions.
References
Ackermann, I. J., Hass, H., Memmesheimer, M., Ebel, A., Binkowski, F. S., and Shankar, U.: Modal aerosol dynamics model for Europe: Development and first applications, Atmos. Env-20
iron., 32, 2981–2999, 1998.
Aleksandropoulou, V. and Lazaridis, M.: Study of gaseous and particulate matter emissions in Greece, Water Air and Soil Pollution, 153, 15–34, 2004.
Andreae, M. O.: In Future Climates of the World: A Modelling perspective (Climatic effects of changing atmospheric aerosol levels), edited by Henderson-Sellers, A., Macquarie Univer-25
sity, Climatic Impacts Centre, Australia, 1995.
ACPD
4, 5455–5514, 2004Mesoscale modeling of combined aerosol and photo-oxidant
processes
M. Lazaridis et al.
Title Page Abstract Introduction Conclusions References Tables Figures ◭ ◮ ◭ ◮ Back Close
Full Screen / Esc
Print Version
Interactive Discussion
©EGU 2004
aerosols in the eastern Mediterranean during summer and winter, Atmos. Environ., 37, 195– 208, 2003.
Benkovitz, C. M., Scholtz, M. T., Pacyna, J., Tarrason, L., Dignon, J., Voldner, E. C., Spiro, P. A., Logan, J. A., and Graedel, T. E.: Global gridded inventories of anthropogenic emissions of sulfur and nitrogen, J. Geophys. Res.-A., 101, (D22), 29 239–29 253, 1996.
5
Berdowski, J. J. M., Mulder, W., Veldt, C., Visschedijk, A. J. H., and Zandveld, P. Y. J.: Partic-ulate matter emissions (PM10-PM2.5-PM0.1) in Europe in 1990 and 1993, Technical Report, Netherlands organization for Applied Scientific Research, TNO-MEP-R 96/472, Apeldoorn, The Netherlands, 1997.
Binkowski, F. S. and Shankar, U.: The regional particulate model, 1. Model description and 10
preliminary results, J. Geophys. Res., 100, 26 191–26 209, 1995.
EMEP/CORINAIR: ‘Atmospheric Emission Inventory Guidebook’, 3rd Edition, Prepared by the EMEP Task force on Emission Inventories, EEA Technical Report No. 30, 2002.
EMEP-WMO: Workshop on Strategies for Monitoring of Regional Air Pollution in relation to the need within EMEP, GAW and other international bodies, EMEP/CCC-Report 10/97, 1997. 15
Flatøy, F., Hov Ø., and Schlanger, H.: Chemical forecasts used for measurement flight planning during the POLINAT 2, Geophys. Res. Lett., 27, 951–954, 2000.
Guenther, B., Zimmerman, P. R., Harley, P. C., Monson, R. K., and Fall, R.: Isoprene and monoterpene rate variability: Model evaluations and sensitivity analysis, J. Geophys. Res., 10, 12 609–12 617, 1993.
20
Jacobson, M. Z.: Development and application of a new air pollution modeling system – II: Aerosol module structure and design, Atmos. Environ., 31A, 131–144, 1997.
Kallos, G., Kotroni, V., Lagouvardos, K., and Papadopoulos, A.: On the transport of air pollu-tants from Europe to North Africa, Geophys. Res. Lett., 25, 5, 619–622, 1999.
Kouvarakis, G., Tsigaridis, K., Kanakidou, M., and Mihalopoulos, N.: Temporal variations of 25
surface regional background ozone over Crete Island in the southeast Mediterranean, J. Geophys. Res., 105, 4399–4407, 2000.
Lazaridis, M., Spiridaki, A., Solberg, S., Kallos, G., Svendby, T., Flatoy, F., Drossinos, I., Hou-siadas, C., Smol´ık, J., Colbeck, I., Varinou, M., Gofa, F., Eleftheriadis, K., Zdimal, V., and Georgopoulos, P. G.: Modelling of combined aerosol and photooxidant processes in the 30
Mediterranean area, Water Air and Soil Pollution – Focus, in press, 2004.
ACPD
4, 5455–5514, 2004Mesoscale modeling of combined aerosol and photo-oxidant
processes
M. Lazaridis et al.
Title Page Abstract Introduction Conclusions References Tables Figures ◭ ◮ ◭ ◮ Back Close
Full Screen / Esc
Print Version
Interactive Discussion
©EGU 2004
Markowicz, K. M., Mihalopoulos, N., Minikin, A., Ramanathan, V., de Reus, M., Roelofs, G. J., Scheeren, H. A., Sciare, J., Schlager, H., Schultz, M., Siegmund, P., Steil, B., Stephanou, E. G., Stier, P., Traub, M., Warneke, C., Williams, J., and Ziereis, H.: Global air pollution crossroads over the Mediterranean, Science, 298, 794–799, 2002.
Lurmann, F. W., Wexler, A. S., Pandis, S. N., Mussara, S., Kumar, N., and Seinfeld, J. H.: Mod-5
elling Urban and Regional Aerosols – II. Application to California’s South Coast Air Basin, Atmos. Environ., 31, 2695–2715, 1997.
Mihalopoulos, N., Stephanou, E., Kanakidou, M., Pilitsidis, S., and Bousquet, P.: Tropospheric aerosol ionic composition in the Eastern Mediterranean region, Tellus Ser. B-Chem. Phys. Meteorol., 49, 314–326, 1997.
10
Monahan, E. C., Spiel, D. E., and Davidson, K. L.: A model of marine aerosol generation via whitecaps and wave disruption, in Oceanic whitecaps, edited by Monahan, E. C. and Mac Niocail, G., 167–174, D. Reidel, Norwell, MA, 1986.
Pai, P., Vijayaraghavan, K., and Seigneur, C.: Particulate matter modeling in the Los Angeles basin using the SAQM-AERO, J. Air & Waste Management Association, 50, 32–42, 2000. 15
Pandis, S. N., Harley, R. A., Cass, G. R., and Seinfeld, J. H.: Secondary organic aerosol formation and transport, Atmos. Environ., 26A, 2269–2282, 1992.
Peters, L. K., Berkowitz, C. M., Carmichael, G. R., Easter, R. L., Fairweather, G., Ghan, S. J., Hales, J. M., Leung, L. R., Pennell, W. R., Potra, F. A., Saylor, R. D., and Tsang, T. T.: The current state and future direction of eulerian models in simulating tropospheric chemistry and 20
transport of trace species: a review, Atmos. Environ., 29, 189–222, 1995.
Pielke, R. A., Cotton, W. R., Walko, R. L., Tremback, C. J., Lyons, W. A., Grasso, L. D., Nicholls, M. E., Moran, M. D., Wesley, D. A., Lee, T. J., and Copeland, J. H.: A comprehensive Mete-orological Modeling System – RAMS, Meteorol. Atmos. Phys., 49, 69–91, 1992.
Pilinis, C. and Seinfeld, J. H.: Continued development of a general equilibrium model for inor-25
ganic multicomponent atmospheric aerosols, Atmos. Environ., 21, 2453–2466, 1987. Russell, A. and Dennis, R.: NARSTO critical review of photochemical models and modeling,
Atmos. Environ., 34, 2283–2324, 2000.
Sciare, J., Bardouki, H., Moulin, C., and Mihalopoulos, N.: Aerosol sources and their contri-bution to the chemical composition of aerosols in the Eastern Mediterranean Sea during 30
summertime, Atmos. Chem. Phys., 3, 291–302, 2003.
ACPD
4, 5455–5514, 2004Mesoscale modeling of combined aerosol and photo-oxidant
processes
M. Lazaridis et al.
Title Page
Abstract Introduction
Conclusions References
Tables Figures
◭ ◮
◭ ◮
Back Close
Full Screen / Esc
Print Version
Interactive Discussion
©EGU 2004
Seinfeld, J. H. and Pandis, S. N.: Atmospheric chemistry and physics, From air pollution to Climate change, John Wiley and Sons Inc., New York, 1998.
Simpson, D., Guenther, A., Hewitt, C. N., and Steinbrecher, R.: Biogenic emissions in Europe, J. Geophys. Res., 100, D11, 22 875–22 890, 1995.
Simpson, D., Winiwarter, W., Borjesson, G., et al.: Inventorying emissions from nature in Eu-5
rope, J. Geophys. Res. 104, D7, 8113–8152, 1999.
Smith, M. H., Park, P. M., and Consterdine, I. E.: Marine aerosol concentration and estimated fluxes over seas, Q. J. R. Meteorol. Soc., 809–824, 1993.
Smol´ık, J., ˇZd´ımal, V., Schwarz, J., Lazaridis, M., Havr ´anek, V., Eleftheriadis, K., Mihalopoulos, N., Bryant, C., and Colbeck, I.: Size resolved mass concentration and elemental composi-10
tion of atmospheric aerosols over the Eastern Mediterranean area, Atmos. Chem. Phys., 3, 2207–2216, 2003.
Sotiropoulou, R. E. P., Tagaris, E., Pilinis, C., Andronopoulos, S., Sfetsos, A., and Bartzis, J. G.: The BOND project: Biogenic aerosols and air quality in Athens and Marseille greater areas, J. Geophys. Res., 109, D05205, 2004.
15
Thomas, G. E. and Stamnes, K.: Radiative Transfer in the Atmosphere and Ocean, Cambridge University Press, New York, 1999.
Zerefos, C. S., Kourtidis, K., Melas, D., Balis, D., Zanis, P., Katsaros, L., Mantis, H. T., Repapis, C., Isaksen, I., Sundet, J., Herman, J., Bhartia, P. K., and Calpini, B.: Photochemical Activity and Solar Ultraviolet Radiation (PAUR) Modulation Factors: An overview of the project, J. 20
ACPD
4, 5455–5514, 2004Mesoscale modeling of combined aerosol and photo-oxidant
processes
M. Lazaridis et al.
Title Page
Abstract Introduction
Conclusions References
Tables Figures
◭ ◮
◭ ◮
Back Close
Full Screen / Esc
Print Version
Interactive Discussion
©EGU 2004
Table 1.Comparison between experimental field data and modelling results (particulate matter
chemical components) for the July 2000 period at the Finokalia station.
µg/m3 Model Results Experimental (Arith. Mean)
July 2000 July 2000 (Average) (Average)
Total PM10 20.8 33.54
SO4=1 5.04 6.30
NO3−1 2.23 2.48
NH4+1 1.58 2.20
Na+1 1.72 1.92
Cl−1 1.28 1.99
EC 0.17 0.44∗
OC 1.04 1.32∗
ACPD
4, 5455–5514, 2004Mesoscale modeling of combined aerosol and photo-oxidant
processes
M. Lazaridis et al.
Title Page
Abstract Introduction
Conclusions References
Tables Figures
◭ ◮
◭ ◮
Back Close
Full Screen / Esc
Print Version
Interactive Discussion
©EGU 2004
Table 2.Comparison between experimental field data and modelling results (particulate matter
chemical components) for the January 2001 period at the Finokalia station.
µg/m3 Model Results Experimental (Arith. Mean)
January 2001 January 2001 (Average) (Average)
Total PM10 9.35 14.55
SO4=1 2.18 2.14
NO3−1 2.50 1.46
NH4+1 0.77 0.79
Na+1 1.11 1.11
Cl−1 0.59 1.88
EC 0.20 0.15∗
OC 0.83 0.45∗
Crustal Oxides# 1.14 1.37#
∗TSP
#
ACPD
4, 5455–5514, 2004Mesoscale modeling of combined aerosol and photo-oxidant
processes
M. Lazaridis et al.
Title Page
Abstract Introduction
Conclusions References
Tables Figures
◭ ◮
◭ ◮
Back Close
Full Screen / Esc
Print Version
Interactive Discussion
©EGU 2004
Table 3.Comparison between experimental field data and modelling results (gaseous species)
for the July 2000 period at the Finokalia station.
Parameter Finokalia (Summer) (ppbv) Model Results (ppbv)
O3 60 50
NO2 2.25*** (10–20/7) 1
NO <0.05 0.03
SO2 0.84 * 0.6
HNO3 0.45* (20–30/7) 0.1
0.15** (10–20/7)
HONO 0.13** (10–20/7) 0.05
* from annular denuder measurements
ACPD
4, 5455–5514, 2004Mesoscale modeling of combined aerosol and photo-oxidant
processes
M. Lazaridis et al.
Title Page
Abstract Introduction
Conclusions References
Tables Figures
◭ ◮
◭ ◮
Back Close
Full Screen / Esc
Print Version
Interactive Discussion
©EGU 2004
Table 4.Comparison between experimental field data and modelling results (gaseous species)
for the July 2000 period at the research vessel Aigeaion.
Parameter Aegean sea (summer) (ppbv) Model Results (ppbv)
O3 59.4*** 52.6
NO2 7.1*** 3.5
SO2 1.56* 2.1
HNO3 0.33* 0.47
HONO 0.12** 0.05
* from annular denuder measurements
ACPD
4, 5455–5514, 2004Mesoscale modeling of combined aerosol and photo-oxidant
processes
M. Lazaridis et al.
Title Page
Abstract Introduction
Conclusions References
Tables Figures
◭ ◮
◭ ◮
Back Close
Full Screen / Esc
Print Version
Interactive Discussion
©EGU 2004
Table 5.Comparison between experimental field data and modelling results (gaseous species)
for the January 2001 period at the Finokalia station.
Parameter Finokalia (Winter) (ppbv) Model Results (ppbv)
O3 41.7 31.3
NO2 0.52*** 0.6
NO <0.05 0.02
HNO3 0.04** 0.02
HONO 0.07** 0.03
* from annular denuder measurements
ACPD
4, 5455–5514, 2004Mesoscale modeling of combined aerosol and photo-oxidant
processes
M. Lazaridis et al.
Title Page
Abstract Introduction
Conclusions References
Tables Figures
◭ ◮
◭ ◮
Back Close
Full Screen / Esc
Print Version
Interactive Discussion
©EGU 2004
Fig. 1.Simulation results of the(a)ozone and(b)nitrogen oxides surface concentration for an
ACPD
4, 5455–5514, 2004Mesoscale modeling of combined aerosol and photo-oxidant
processes
M. Lazaridis et al.
Title Page
Abstract Introduction
Conclusions References
Tables Figures
◭ ◮
◭ ◮
Back Close
Full Screen / Esc
Print Version
Interactive Discussion
©EGU 2004
ACPD
4, 5455–5514, 2004Mesoscale modeling of combined aerosol and photo-oxidant
processes
M. Lazaridis et al.
Title Page
Abstract Introduction
Conclusions References
Tables Figures
◭ ◮
◭ ◮
Back Close
Full Screen / Esc
Print Version
Interactive Discussion
©EGU 2004
Fig. 2. Surface spatial distribution of (a) O3 (b) NO2 (c) SO2 (d) Na+ (e) NH+4 (f) CO, (g)
ACPD
4, 5455–5514, 2004Mesoscale modeling of combined aerosol and photo-oxidant
processes
M. Lazaridis et al.
Title Page
Abstract Introduction
Conclusions References
Tables Figures
◭ ◮
◭ ◮
Back Close
Full Screen / Esc
Print Version
Interactive Discussion
©EGU 2004
ACPD
4, 5455–5514, 2004Mesoscale modeling of combined aerosol and photo-oxidant
processes
M. Lazaridis et al.
Title Page
Abstract Introduction
Conclusions References
Tables Figures
◭ ◮
◭ ◮
Back Close
Full Screen / Esc
Print Version
Interactive Discussion
©EGU 2004
ACPD
4, 5455–5514, 2004Mesoscale modeling of combined aerosol and photo-oxidant
processes
M. Lazaridis et al.
Title Page
Abstract Introduction
Conclusions References
Tables Figures
◭ ◮
◭ ◮
Back Close
Full Screen / Esc
Print Version
Interactive Discussion
©EGU 2004
ACPD
4, 5455–5514, 2004Mesoscale modeling of combined aerosol and photo-oxidant
processes
M. Lazaridis et al.
Title Page
Abstract Introduction
Conclusions References
Tables Figures
◭ ◮
◭ ◮
Back Close
Full Screen / Esc
Print Version
Interactive Discussion
©EGU 2004
ACPD
4, 5455–5514, 2004Mesoscale modeling of combined aerosol and photo-oxidant
processes
M. Lazaridis et al.
Title Page
Abstract Introduction
Conclusions References
Tables Figures
◭ ◮
◭ ◮
Back Close
Full Screen / Esc
Print Version
Interactive Discussion
©EGU 2004
ACPD
4, 5455–5514, 2004Mesoscale modeling of combined aerosol and photo-oxidant
processes
M. Lazaridis et al.
Title Page
Abstract Introduction
Conclusions References
Tables Figures
◭ ◮
◭ ◮
Back Close
Full Screen / Esc
Print Version
Interactive Discussion
©EGU 2004
ACPD
4, 5455–5514, 2004Mesoscale modeling of combined aerosol and photo-oxidant
processes
M. Lazaridis et al.
Title Page
Abstract Introduction
Conclusions References
Tables Figures
◭ ◮
◭ ◮
Back Close
Full Screen / Esc
Print Version
Interactive Discussion
©EGU 2004
ACPD
4, 5455–5514, 2004Mesoscale modeling of combined aerosol and photo-oxidant
processes
M. Lazaridis et al.
Title Page
Abstract Introduction
Conclusions References
Tables Figures
◭ ◮
◭ ◮
Back Close
Full Screen / Esc
Print Version
Interactive Discussion
©EGU 2004
Fig. 3.Surface spatial distribution of PM10at 14 July at(a)02:00 h,(b)12:00 h,(c)14:00 h,(d)
ACPD
4, 5455–5514, 2004Mesoscale modeling of combined aerosol and photo-oxidant
processes
M. Lazaridis et al.
Title Page
Abstract Introduction
Conclusions References
Tables Figures
◭ ◮
◭ ◮
Back Close
Full Screen / Esc
Print Version
Interactive Discussion
©EGU 2004
ACPD
4, 5455–5514, 2004Mesoscale modeling of combined aerosol and photo-oxidant
processes
M. Lazaridis et al.
Title Page
Abstract Introduction
Conclusions References
Tables Figures
◭ ◮
◭ ◮
Back Close
Full Screen / Esc
Print Version
Interactive Discussion
©EGU 2004
ACPD
4, 5455–5514, 2004Mesoscale modeling of combined aerosol and photo-oxidant
processes
M. Lazaridis et al.
Title Page
Abstract Introduction
Conclusions References
Tables Figures
◭ ◮
◭ ◮
Back Close
Full Screen / Esc
Print Version
Interactive Discussion
©EGU 2004
ACPD
4, 5455–5514, 2004Mesoscale modeling of combined aerosol and photo-oxidant
processes
M. Lazaridis et al.
Title Page
Abstract Introduction
Conclusions References
Tables Figures
◭ ◮
◭ ◮
Back Close
Full Screen / Esc
Print Version
Interactive Discussion
©EGU 2004
ACPD
4, 5455–5514, 2004Mesoscale modeling of combined aerosol and photo-oxidant
processes
M. Lazaridis et al.
Title Page
Abstract Introduction
Conclusions References
Tables Figures
◭ ◮
◭ ◮
Back Close
Full Screen / Esc
Print Version
Interactive Discussion
©EGU 2004
ACPD
4, 5455–5514, 2004Mesoscale modeling of combined aerosol and photo-oxidant
processes
M. Lazaridis et al.
Title Page
Abstract Introduction
Conclusions References
Tables Figures
◭ ◮
◭ ◮
Back Close
Full Screen / Esc
Print Version
Interactive Discussion
©EGU 2004
ACPD
4, 5455–5514, 2004Mesoscale modeling of combined aerosol and photo-oxidant
processes
M. Lazaridis et al.
Title Page
Abstract Introduction
Conclusions References
Tables Figures
◭ ◮
◭ ◮
Back Close
Full Screen / Esc
Print Version
Interactive Discussion
©EGU 2004
Fig. 4. Surface spatial distribution of O3and PM10for 13 July 2000(a–b), 14 July 2000(c–d),
ACPD
4, 5455–5514, 2004Mesoscale modeling of combined aerosol and photo-oxidant
processes
M. Lazaridis et al.
Title Page
Abstract Introduction
Conclusions References
Tables Figures
◭ ◮
◭ ◮
Back Close
Full Screen / Esc
Print Version
Interactive Discussion
©EGU 2004
ACPD
4, 5455–5514, 2004Mesoscale modeling of combined aerosol and photo-oxidant
processes
M. Lazaridis et al.
Title Page
Abstract Introduction
Conclusions References
Tables Figures
◭ ◮
◭ ◮
Back Close
Full Screen / Esc
Print Version
Interactive Discussion
©EGU 2004
ACPD
4, 5455–5514, 2004Mesoscale modeling of combined aerosol and photo-oxidant
processes
M. Lazaridis et al.
Title Page
Abstract Introduction
Conclusions References
Tables Figures
◭ ◮
◭ ◮
Back Close
Full Screen / Esc
Print Version
Interactive Discussion
©EGU 2004
ACPD
4, 5455–5514, 2004Mesoscale modeling of combined aerosol and photo-oxidant
processes
M. Lazaridis et al.
Title Page
Abstract Introduction
Conclusions References
Tables Figures
◭ ◮
◭ ◮
Back Close
Full Screen / Esc
Print Version
Interactive Discussion
©EGU 2004
ACPD
4, 5455–5514, 2004Mesoscale modeling of combined aerosol and photo-oxidant
processes
M. Lazaridis et al.
Title Page
Abstract Introduction
Conclusions References
Tables Figures
◭ ◮
◭ ◮
Back Close
Full Screen / Esc
Print Version
Interactive Discussion
©EGU 2004
ACPD
4, 5455–5514, 2004Mesoscale modeling of combined aerosol and photo-oxidant
processes
M. Lazaridis et al.
Title Page
Abstract Introduction
Conclusions References
Tables Figures
◭ ◮
◭ ◮
Back Close
Full Screen / Esc
Print Version
Interactive Discussion
©EGU 2004
ACPD
4, 5455–5514, 2004Mesoscale modeling of combined aerosol and photo-oxidant
processes
M. Lazaridis et al.
Title Page
Abstract Introduction
Conclusions References
Tables Figures
◭ ◮
◭ ◮
Back Close
Full Screen / Esc
Print Version
Interactive Discussion
©EGU 2004
ACPD
4, 5455–5514, 2004Mesoscale modeling of combined aerosol and photo-oxidant
processes
M. Lazaridis et al.
Title Page
Abstract Introduction
Conclusions References
Tables Figures
◭ ◮
◭ ◮
Back Close
Full Screen / Esc
Print Version
Interactive Discussion
©EGU 2004
Average winter O3 vertical profiles at various environments
0 1000 2000 3000 4000 5000
25,00 27,00 29,00 31,00 33,00 35,00 37,00
O3 concentration (ppb)
Al
ti
tu
d
e
(m
)
Herakleion (NILU-CTM background) Finokalia (NILU-CTM background)
Marine (NILU-CTM background)
ACPD
4, 5455–5514, 2004Mesoscale modeling of combined aerosol and photo-oxidant
processes
M. Lazaridis et al.
Title Page
Abstract Introduction
Conclusions References
Tables Figures
◭ ◮
◭ ◮
Back Close
Full Screen / Esc
Print Version
Interactive Discussion
©EGU 2004
Fig. 6. Comparison between modeled and measured ozone concentrations for the period(a)
ACPD
4, 5455–5514, 2004Mesoscale modeling of combined aerosol and photo-oxidant
processes
M. Lazaridis et al.
Title Page
Abstract Introduction
Conclusions References
Tables Figures
◭ ◮
◭ ◮
Back Close
Full Screen / Esc
Print Version
Interactive Discussion
©EGU 2004
ACPD
4, 5455–5514, 2004Mesoscale modeling of combined aerosol and photo-oxidant
processes
M. Lazaridis et al.
Title Page
Abstract Introduction
Conclusions References
Tables Figures
◭ ◮
◭ ◮
Back Close
Full Screen / Esc
Print Version
Interactive Discussion
©EGU 2004
Fig. 7. Chemical resolved PM10mass between(a)13–16 July 2000,(b)26–30 July 2000,(c)
ACPD
4, 5455–5514, 2004Mesoscale modeling of combined aerosol and photo-oxidant
processes
M. Lazaridis et al.
Title Page
Abstract Introduction
Conclusions References
Tables Figures
◭ ◮
◭ ◮
Back Close
Full Screen / Esc
Print Version
Interactive Discussion
©EGU 2004
ACPD
4, 5455–5514, 2004Mesoscale modeling of combined aerosol and photo-oxidant
processes
M. Lazaridis et al.
Title Page
Abstract Introduction
Conclusions References
Tables Figures
◭ ◮
◭ ◮
Back Close
Full Screen / Esc
Print Version
Interactive Discussion
©EGU 2004
ACPD
4, 5455–5514, 2004Mesoscale modeling of combined aerosol and photo-oxidant
processes
M. Lazaridis et al.
Title Page
Abstract Introduction
Conclusions References
Tables Figures
◭ ◮
◭ ◮
Back Close
Full Screen / Esc
Print Version
Interactive Discussion
©EGU 2004
Fig. 8. Comparison between modelling and observed PM10 mass concentration between(a)
ACPD
4, 5455–5514, 2004Mesoscale modeling of combined aerosol and photo-oxidant
processes
M. Lazaridis et al.
Title Page
Abstract Introduction
Conclusions References
Tables Figures
◭ ◮
◭ ◮
Back Close
Full Screen / Esc
Print Version
Interactive Discussion
©EGU 2004
ACPD
4, 5455–5514, 2004Mesoscale modeling of combined aerosol and photo-oxidant
processes
M. Lazaridis et al.
Title Page
Abstract Introduction
Conclusions References
Tables Figures
◭ ◮
◭ ◮
Back Close
Full Screen / Esc
Print Version
Interactive Discussion
©EGU 2004
ACPD
4, 5455–5514, 2004Mesoscale modeling of combined aerosol and photo-oxidant
processes
M. Lazaridis et al.
Title Page
Abstract Introduction
Conclusions References
Tables Figures
◭ ◮
◭ ◮
Back Close
Full Screen / Esc
Print Version
Interactive Discussion
©EGU 2004
Experimental vs Measured SO4=, at Finokalia, July 2000
0 1 2 3 4 5
13-Jul 14-Jul 15-Jul 16-Jul
Date
Co
ncentr
ation
(µ
g/m3)
Modelled Measured
Fig. 9.Comparison between modelling and observed SO4mass concentration between 13–16
ACPD
4, 5455–5514, 2004Mesoscale modeling of combined aerosol and photo-oxidant
processes
M. Lazaridis et al.
Title Page Abstract Introduction Conclusions References Tables Figures ◭ ◮ ◭ ◮ Back Close
Full Screen / Esc
Print Version
Interactive Discussion
©EGU 2004
Measured vs predicted Na+ mass (PM10) at Finokalia, January 2001
0,0 0,5 1,0 1,5 2,0
8-Jan 9-Jan 10-Jan 11-Jan 12-Jan 13-Jan 14-Jan
Day D a ily av era g e c o nc en tr a ti o n (µ g /m 3 ) measured modelled
Fig. 10.Comparison between modelling and observed Na+mass concentration between 8–14