Sentiment of Emojis
Petra Kralj Novak*, Jasmina Smailović, Borut Sluban, Igor Mozetič*
Jožef Stefan Institute, Jamova 39, 1000 Ljubljana, Slovenia
*[email protected](PKN);[email protected](IM)
Abstract
There is a new generation of emoticons, called emojis, that is increasingly being used in mobile communications and social media. In the past two years, over ten billion emojis were used on Twitter. Emojis are Unicode graphic symbols, used as a shorthand to express con-cepts and ideas. In contrast to the small number of well-known emoticons that carry clear emotional contents, there are hundreds of emojis. But what are their emotional contents? We provide the first emoji sentiment lexicon, called the Emoji Sentiment Ranking, and draw a sentiment map of the 751 most frequently used emojis. The sentiment of the emojis is computed from the sentiment of the tweets in which they occur. We engaged 83 human annotators to label over 1.6 million tweets in 13 European languages by the sentiment polar-ity (negative, neutral, or positive). About 4% of the annotated tweets contain emojis. The sentiment analysis of the emojis allows us to draw several interesting conclusions. It turns out that most of the emojis are positive, especially the most popular ones. The sentiment distribution of the tweets with and without emojis is significantly different. The inter-annota-tor agreement on the tweets with emojis is higher. Emojis tend to occur at the end of the tweets, and their sentiment polarity increases with the distance. We observe no significant differences in the emoji rankings between the 13 languages and the Emoji Sentiment Rank-ing. Consequently, we propose our Emoji Sentiment Ranking as a European language-independent resource for automated sentiment analysis. Finally, the paper provides a for-malization of sentiment and a novel visualization in the form of a sentiment bar.
Introduction
Anemoticon, such as;-), is shorthand for a facial expression. It allows the author to express her/his feelings, moods and emotions, and augments a written message with non-verbal ele-ments. It helps to draw the reader’s attention, and enhances and improves the understanding of the message. Anemojiis a step further, developed with modern communication technolo-gies that facilitate more expressive messages. An emoji is a graphic symbol, ideogram, that rep-resents not only facial expressions, but also concepts and ideas, such as celebration, weather, vehicles and buildings, food and drink, animals and plants, or emotions, feelings, and activities.
Emojis on smartphones, in chat, and email applications have become extremely popular worldwide. For example, Instagram, an online mobile photo-sharing, video-sharing and social-networking platform, reported in March 2015 that nearly half of the texts on Instagram OPEN ACCESS
Citation:Kralj Novak P, SmailovićJ, Sluban B, MozetičI (2015) Sentiment of Emojis. PLoS ONE 10 (12): e0144296. doi:10.1371/journal.pone.0144296
Editor:Matjaz Perc, University of Maribor, SLOVENIA
Received:October 5, 2015
Accepted:November 16, 2015
Published:December 7, 2015
Copyright:© 2015 Kralj Novak et al. This is an open access article distributed under the terms of the Creative Commons Attribution License, which permits unrestricted use, distribution, and reproduction in any medium, provided the original author and source are credited.
Data Availability Statement:Data are available from a public language resource repository CLARIN.SI at http://hdl.handle.net/11356/1048. Emoji Sentiment Ranking web page, generated from the data is at http://kt.ijs.si/data/Emoji_sentiment_ranking/. The data are also available fromhttp://dx.doi.org/10.6084/ m9.figshare.1600931.
Funding:This work was supported in part by the EC projects SIMPOL (no. 610704), MULTIPLEX (no. 317532) and DOLFINS (no. 640772), and by the Slovenian ARRS programme Knowledge Technologies (no. P2-103).
contained emojis [1]. The use of emojis on the SwiftKey Android and iOS keybords, for devices such as smartphones and tablets, was analyzed in the SwiftKey Emoji Report [2], where a great variety in the popularity of individual emojis, and even between countries, was reported. How-ever, to the best of our knowledge, no large-scale analysis of the emotional content of emojis has been conducted so far.
Sentiment analysis is the field of study that analyzes people’s opinions, sentiments, evalua-tions, attitudes, and emotions from a text [3,4]. In analyzing short informal texts, such as tweets, blogs or comments, it turns out that the emoticons provide a crucial piece of informa-tion [5–12]. However, emojis have not been exploited so far, and no resource with emoji senti-ment information has been provided.
In this paper we present the Emoji Sentiment Ranking, the first emoji sentiment lexicon of 751 emojis. The lexicon was constructed from over 1.6 million tweets in 13 European lan-guages, annotated for sentiment by human annotators. In the corpus, probably the largest set of manually annotated tweets, 4% of the tweets contained emojis. The sentiment of the emojis was computed from the sentiment of the tweets in which they occur, and reflects the actual use of emojis in a context.
Background. An emoticon is a short sequence of characters, typically punctuation symbols. The use of emoticons can be traced back to the 19thcentury, when they were used in casual and
humorous writing. The first use of emoticons in the digital era is attributed to professor Scott Fahlman, in a message on the computer-science message board of Carnegie Mellon University, on September 19, 1982. In his message, Fahlman proposed to use:-)and:-(to distinguish jokes from more serious posts. Within a few months, the use of emoticons had spread, and the set of emoticons was extended with hugs and kisses, by using characters found on a typical key-board. A decade later, emoticons had found their way into everyday digital communications and have now become a paralanguage of the web [6].
The word‘emoji’literally means‘picture character’in Japanese. Emojis emerged in Japan at the end of the 20thcentury to facilitate digital communication. A number of Japanese carriers (Softbank, KDDI, DoCoMo) provided their own implementations, with incompatible encoding schemes. Emojis were first standardized in Unicode 6.0 [13]—the core emoji set consisted of 722 characters. However, Apple’s support for emojis on the iPhone, in 2010, led to global popularity. An additional set of about 250 emojis was included in Unicode 7.0 [14] in 2014. As of August 2015, Unicode 8.0 [15] defines a list of 1281 single- or double-character emoji symbols.
Related work. Sentiment analysis, or opinion mining, is the computational study of people’s opinions, sentiments, emotions, and attitudes. It is one of the most active research areas in nat-ural-language processing and is also extensively studied in data mining, web mining, and text mining [3,4]. The growing importance of sentiment analysis coincides with the growth of social media, such as Twitter, Facebook, book reviews, forum discussions, blogs, etc.
The basis of many sentiment-analysis approaches is the sentiment lexicons, with the words and phrases classified as conveying positive or negative sentiments. Several general-purpose lexicons of subjectivity and sentiment have been constructed. Most sentiment-analysis research focuses on English text and, consequently, most of the resources developed (such as sentiment lexicons and corpora) are in English. One such lexical resource, explicitly devised to support sentiment classification and opinion mining, is SentiWordNet 3.0 [16]. SentiWordNet extends the well-known WordNet [17] by associating each synset with three numerical scores, describ-ing how‘objective’,‘positive’, and‘negative’the terms in the synset are.
Emoticons have proved crucial in the automated sentiment classification of informal texts [5–12]. In an early work [10], a basic distinction between positive and negative emoticons was used to automatically generate positive and negative samples of texts. These samples were then used to train and test sentiment-classification models using machine learning techniques. The supported by the Goldfinch platform, provided by
early results suggested that the sentiment conveyed by emoticons is both domain and topic independent. In later work, these findings were applied to automatically construct sets of posi-tive and negaposi-tive tweets [8,18,19], and sets of tweets with alternative sentiment categories, such as the angry and sad emotional states [11]. Such emoticon-labeled sets are then used to automatically train the sentiment classifiers. Emoticons can also be exploited to extend the more common features used in text mining, such as sentiment-carrying words. A small set of emoticons has already been used as additional features for polarity classification [8,20]. A sen-timent-analysis framework that takes explicitly into account the information conveyed by emo-ticons is proposed in [6].
There is also research that analyzes graphical emoticons and their sentiment, or employs them in a sentiment classification task. The authors in [21] manually mapped the emoticons from Unicode 8.0 to nine emotional categories and performed the sentiment classification of tweets, using both emoticons and bag-of-words as features. Ganesan et al. [22] presents a sys-tem for adding the graphical emoticons to text as an illustration of the written emotions.
Several studies have analyzed emotional contagion through posts on Facebook and showed that the emotions in the posts of online friends influence the emotions expressed in newly gen-erated content [23–26]. Gruzd et al. [27] examined the spreading of emotional content on Twitter and found that the positive posts are retweeted more often than the negative ones. It would be interesting to examine how the presence of emojis in tweets affects the spread of emo-tions on Twitter, i.e., to relate our study to the field of emotional contagion [28].
Contributions. Emojis, a new generation of emoticons, are increasingly being used in social media. Tweets, blogs and comments are analyzed to estimate the emotional attitude of a large fraction of the population to various issues. An emoji sentiment lexicon, provided as a result of this study, is a valuable resource for automated sentiment analysis. The Emoji Sentiment Rank-ing has a format similar to SentiWordNet [16], a publicly available resource for opinion min-ing, used in more than 700 applications and studies so far, according to Google Scholar. In addition to a public resource, the paper provides an in-depth analysis of several aspects of emoji sentiment. We draw a sentiment map of the 751 emojis, compare the differences between the tweets with and without emojis, the differences between the more and less frequent emojis, their positions in tweets, and the differences between their use in the 13 languages. Finally, a formalization of sentiment and a novel visualization in the form of a sentiment bar are presented.
Results and Discussion
Emoji sentiment lexicon
The sentiment of emojis is computed from the sentiment of tweets. A large pool of tweets, in 13 European languages, was labeled for sentiment by 83 native speakers. Sentiment labels can take one of three ordered values:negativeneutralpositive. A sentiment label,c, is formally a discrete, 3-valued variablec2{−1, 0, +1}. An emoji is assigned a sentiment from all the tweets
in which it occurs. First, for each emoji, we form a discrete probability distribution (p−,p0,p+).
The sentiment scoresof the emoji is then computed as the mean of the distribution. The com-ponents of the distribution, i.e.,p−,p0, andp+denote the negativity, neutrality, and positivity of
the emoji, respectively. The probabilitypcis estimated from the number of occurrences,N, of the emoji in tweets with the labelc. Note that an emoji can occur multiple times in a single tweet, and we count all the occurrences. A more detailed formalization of the sentiment repre-sentation can be found in the Methods section.
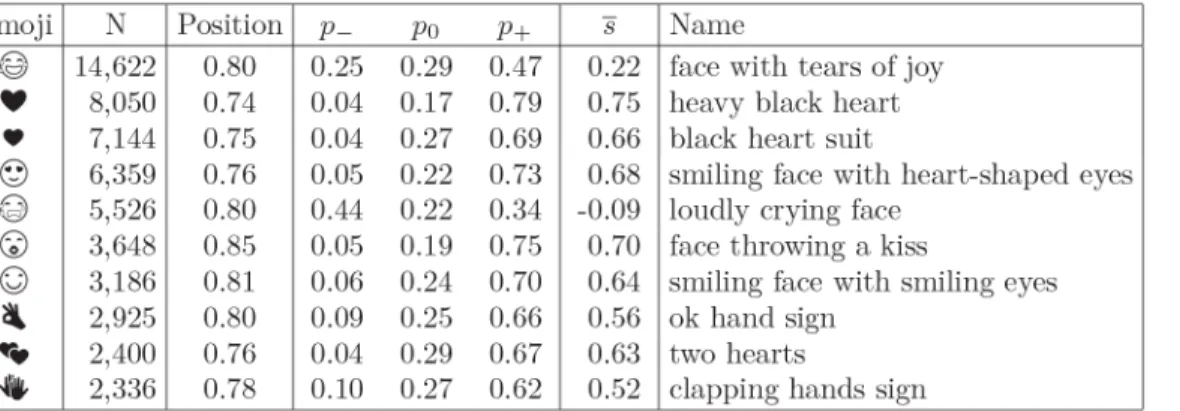
ijs.si/data/Emoji_sentiment_ranking/. The 10 most frequently used emojis from the lexicon are shown inFig 1.
First we address the question of whether the emojis in our lexicon are representative. We checkedEmojitracker(http://emojitracker.com/), a website that monitors the use of emojis on Twitter in realtime. In the past two years, Emojitracker has detected almost 10 billion emojis on Twitter! From the ratio of the number of emoji occurrences and tweets in our dataset (*2.3), we estimate that there were about 4 billion tweets with emojis. In our dataset of about
70,000 tweets, we found 969 different emojis, 721 of them in common with Emojitracker. We compared the emojis in both sets, ordered by the number of occurrences, using Pear-son’s [29] and Spearman’s rank [30] correlation. We successively shorten our list of emojis by cutting off the least-frequent emojis. The results for two thresholds,N1 and 5, with the high-est correlation coefficients, are shown inTable 1. Both correlation coefficients are high, signifi-cant at the 1% level, thus confirming that our list of emojis is indeed representative of their general use on Twitter. Between the two options, we decided to select the list of emojis with at least 5 occurrences, resulting in the lexicon of 751 emojis. The sentiment scores for the emojis with fewer then 5 occurrences are not very reliable.
Emoji sentiment map
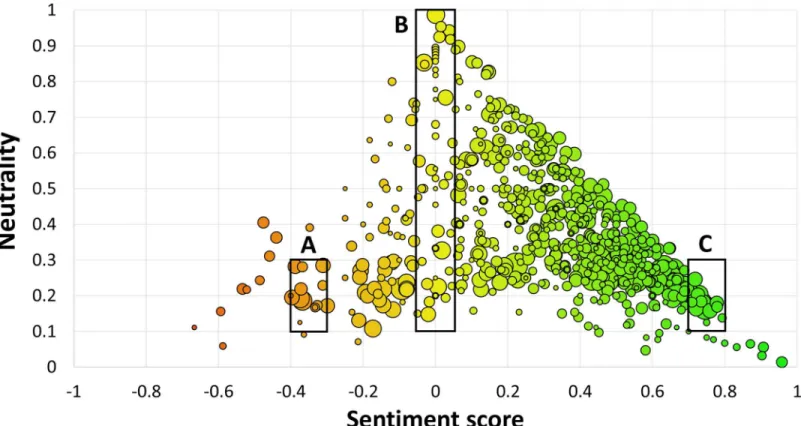
Before we analyze the properties of the tweets with emojis, we first discuss two visualizations of the Emoji Sentiment Ranking.Fig 2shows the overall map of the 751 emojis. The position of an emoji is determined by its sentiment scoresand its neutralityp0. The sentiment scoresis in the range (−1, +1) and is computed asp+−p−. The more positive emojis are on the right-hand
side of the map (green), while the negative ones are on the left-hand side (red). The neutral
Fig 1. Top 10 emojis.Emojis are ordered by the number of occurrencesN. The averagepositionranges from 0 (the beginning of the tweets) to 1 (the end of the tweets).pc,c2{−1, 0, +1}, are the negativity, neutrality, and positivity, respectively.sis the sentiment score.
doi:10.1371/journal.pone.0144296.g001
Table 1. Overlap with Emojitracker.Correlations are between the occurrences of emojis in the Emoji Sentiment Ranking and Emojitracker, for two minimum occurrence thresholds. The numbers in parenthesis are the emojis that are common in both sets. The correlation values, significant at the 1% level, are indi-cated by*.
Tweets with emojis Different emojis used Pearson correlation Spearman rank correlation
Emojitracker *4 billion 845 / /
Emoji Sent. Rank.
N1 69,673 969 (721) 0.945* 0.897*
Emoji Sent. Rank.
N5 69,546 751(608) 0.944* 0.898*
emojis (yellow) span a whole band arounds¼0. The emojis are prevailingly positive, the
mean sentiment score is +0.3 (see the Sentiment distribution subsection). The bubble sizes are proportional to the number of occurrences.
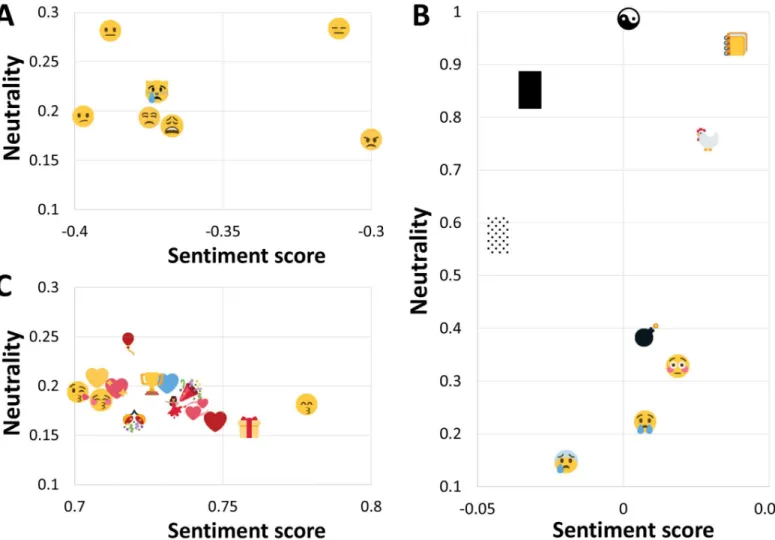
A more detailed view of some actual emojis on the map is shown inFig 3. The most frequent negative emojis (panel A) are sad faces. On the other hand, the most frequent positive emojis (panel C) are not only happy faces, but also hearts, party symbols, a wrapped present, and a tro-phy. Even more interesting are the neutral emojis (panel B). All of them have a sentiment score around 0, but the neutralityp0ranges between 0 and 1. The bottom two, with lowp0(face with cold sweat, crying face), are bipolar, with a high negativity and positivity, wherep−p+. The
middle two (flushed face, bomb) have a uniform sentiment distribution, wherep−p0p+. The
top ones, with highp0, are neutral indeed, symbolized by the yin yang symbol at the very top.
Tweets with and without emojis
In this subsection we analyze the interplay of the human perception of tweets that are with and without emojis. If we consider the sentiment of a tweet as a rough approximation of its emo-tional content, we can ask two questions. Are the tweets with emojis more emoemo-tionally loaded? Does the presence of emojis in tweets have an impact on the human emotional perception of the tweets? We do not draw any causal conclusions, but report the results of two experiments that indicate that the answer to both questions is positive.
First, we compare all the manually labeled tweets that are with and without emojis. From the distribution of the negative, neutral, and positive tweets in both sets, we compute the mean, standard deviation (SD), and standard error of the mean (SEM). The results are shown inTable 2.
Fig 2. Sentiment map of the 751 emojis.Left: negative (red), right: positive (green), top: neutral (yellow). Bubble size is proportional to log10of the emoji occurrences in the Emoji Sentiment Ranking. Sections A, B, and C are references to the zoomed-in panels inFig 3.
We test the null hypothesis that the two populations have equal means. We apply Welch’s t-test [31] for two samples with unequal variances and sizes. We are aware that the two popula-tions might not be normally distributed, but Welch’s t-test is robust for skewed distributions, and even more so for large sample sizes [32]. Witht= 87, the degrees of freedom100 (due to large sample sizes), and the p-value0, the null hypothesis can be rejected. We can
Fig 3. Emojis in sections A, B, and C ofFig 2.Shown are emojis that occur at least 100 times in the Emoji Sentiment Ranking. PanelA: negative emojis, panelB: neutral (top) and bipolar (bottom) emojis, panelC: positive emojis.
doi:10.1371/journal.pone.0144296.g003
Table 2. Sentiment of tweets with and without emojis.For each set, the mean,SDandSEMare computed
from the distribution of negative, neutral, and positive tweets.
Sentiment Tweets with emojis Tweets without emojis
Negative 12,156 (17,5%) 410,301 (26,1%)
Neutral 19,938 (28,6%) 587,337 (37,3%)
Positive 37,579 (53,9%) 576,424 (36,6%)
Total 69,673 1,574,062
Mean +0.365 +0.106
SD,SEM 0.762, 0.0029 0.785, 0.0006
conclude, with high confidence, that the tweets with and without emojis have significantly dif-ferent sentiment means. Additionally, the tweets with emojis are significantly more positive (mean = +0.365) than the tweets without emojis (mean = +0.106).
Next, we compare the agreement of the human annotators on the tweets with and without emojis. The Twitter sentiment classification is not an easy task and humans often disagree on the sentiment labels of controversial tweets. During the process of annotating the 1.6 million tweets, we found that even individual annotators are not consistent with themselves. Therefore, we systematically distributed a fraction of the tweets to be annotated twice in order to estimate the level of agreement. This annotator self-agreement is a good indicator of the reliability of the annotator. The inter-annotator agreement, on the other hand, indicates the difficulty of the task. In the case of emojis, our goal is to verify whether their presence in tweets correlates with a higher inter-annotator agreement.
There are a number of measures to estimate the inter-annotator agreement. We apply three of them from two different fields, to ensure robust estimates. The first one, Krippendorff’s
Alpha-reliability [33], generalizes several specialized agreement measures. When the annota-tors are in perfect agreement,Alpha= 1, and when the level of agreement equals the agreement by chance,Alpha= 0. We applied an instance ofAlphathat takes into account the ordering of labels and assigns a higher penalty to more extreme disagreements. For example, a disagree-ment between thenegativeand thepositivesentiment is four times as costly as that between the
neutralandpositive.
The simplest measure of agreement is the joint probability of agreement, also known as
Accuracy, when evaluating classification models.Accuracyis the number of equally labeled tweets by different annotators, divided by the total number of tweets labeled twice. It assumes the data labels are unordered (nominal) and does not take into account the agreement by chance, but it is easy to interpret.
The third measure comes from the field of machine learning. It is used to evaluate the per-formance of classification models against a test set, where the true sentiment label is known. The measure,F1(−, +), is a standard measure of performance, specifically designed for a
3-val-ued sentiment classification [12], where thenegative(−) andpositive(+) sentiments are
consid-ered more important than theneutralone. Here, we adapt it to estimate the agreement of a pair of annotators.
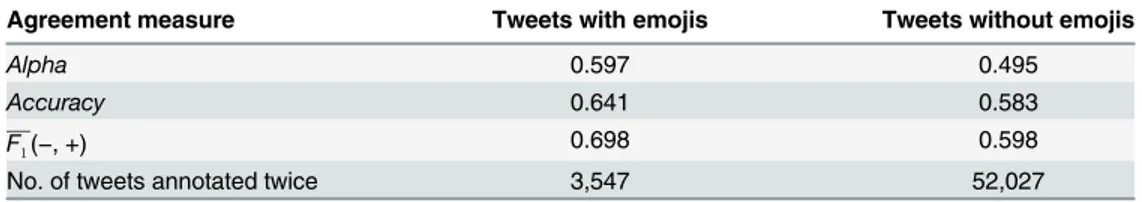
Table 3gives the results of the inter-annotator agreements on the tweets with and without emojis. Coincidence matrices for both cases are in the Methods section. All three measures of agreement,Alpha,Accuracy, andF1(−, +), are considerably higher for the tweets with emojis,
by 21%, 10%, and 17%, respectively. We do not give any statistical-significance results, but it seems safe to conclude that the presence of emojis has a positive impact on the emotional per-ception of the tweets by humans. After all, this is probably the main reason why they are used in thefirst place.
Table 3. Inter-annotator agreement on tweets with and without emojis.The agreement is computed in terms of three measures over a subset of tweets that were labeled by two different annotators.
Agreement measure Tweets with emojis Tweets without emojis
Alpha 0.597 0.495
Accuracy 0.641 0.583
F1(−, +) 0.698 0.598
No. of tweets annotated twice 3,547 52,027
Sentiment distribution
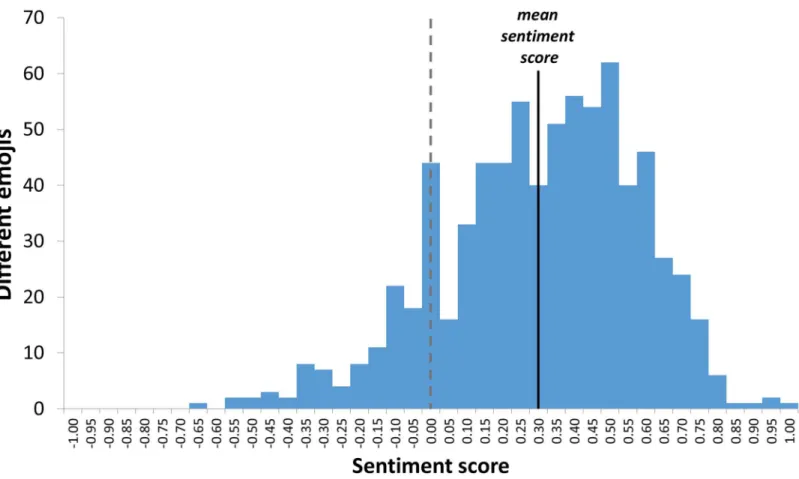
In this subsection we analyze the sentiment distribution of the emojis with respect to the fre-quency of their use. The question we address is the following: Are the more frequently used emojis more emotionally loaded? First, inFig 4we show the sentiment distribution of the 751 emojis, regardless of their frequencies. It is evident that the sentiment score of the emojis is approximately normally distributed, with mean = +0.3, prevailingly positive.
InFig 5we rank the emojis by the number of their occurrences in tweets. The sentiment score of each emoji is indicated by the color. The zoomed-in section of the first 33 emojis is in
Fig 6.
We did not thoroughly analyze the frequency-rank distribution of the emojis. A quick anal-ysis suggests that the data follows a power law with an exponential cutoff at a rank of about 200. Using a maximum-likelihood estimator [34], the exponent of the power law is estimated to be−1.3, a relatively extreme exponent. Even more relevant is the distribution of the emojis
on Emojitracker, but this remains a subject of further research. Here we concentrate on the sen-timent distribution.
We define a cumulative distribution function CDF(R) of rankRover a set of ranked emojis as:
CDFðRÞ ¼NðrRÞ ¼X
rR
NðrÞ;
whererdenotes the rank of an emoji, andN(r) the number of occurrences of the emoji at rank
r. In order to compare the higher-ranked emojis (more frequent) with the lower-ranked ones (less frequent), we define a midpoint rankR1/2, such that:
Nð1rR1
=2Þ NðR1=2<r751Þ:
The midpoint rankR1/2partitions the emojis into two subsets with an approximately equal cumulative number of occurrences. In the case of the Emoji Sentiment Ranking, the midpoint is atR1/2= 23.
We compute the mean sentiment,SD, andSEMof the more frequent and the less frequent
emojis. The results are shown inTable 4.
We test the null hypothesis that the two populations of emojis have equal mean sentiment scores. Again, we apply Welch’s t-test for two samples with unequal variances, but similar
Fig 5. Distribution of occurrences and sentiment of the 751 emojis.The emojis are ranked by their occurrence (log scale). The column color indicates the sentiment score. The partitioning into two equally weighted halfs is indicated by a line atR1/2. The first 33 emojis are zoomed-in inFig 6.
doi:10.1371/journal.pone.0144296.g005
sizes. Witht= 100, the degrees of freedom100 (due to large sample sizes), and the p-value0, the null hypothesis can be rejected. We can conclude, with high confidence, that the more-frequent emojis are significantly more positive than the less-frequent ones.
This result supports the thesis that the emojis that are used more often are more emotionally loaded, but we cannot draw any causal conclusion. Are they more positive because they are more often used in positive tweets, or are they more frequently used, because they are more positive?
Sentiment and emoji position
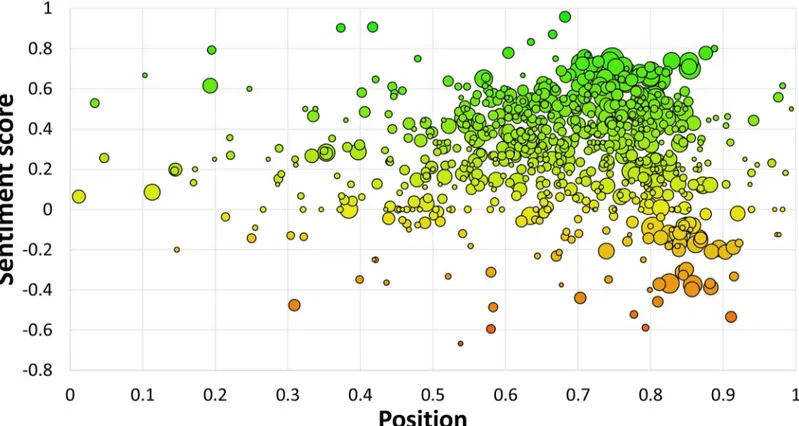
Where are the emojis typically placed in tweets? Emoticons such as :-) are used sparsely and typically at the very end of a sentence. Emojis, on the other hand, appear in groups and not only at the end of the tweets.Fig 7shows the average positions of the 751 emojis in the tweets. On average, an emoji is placed at 2/3 of the length of a tweet.
Table 4. Comparison of the more-frequent with the less-frequent emojis.The emojis (r) ranked by occur-renceN(r) are partitioned into two halves with approximately the same cumulative number of occurrences.
1st half(r23) 2nd half(23<r) Total
Different emojis 23 728 751
Occurrences (∑N(r)) 77,969 78,488 156,457
Sentiment mean +0.463 +0.311 +0.387
SD,SEM 0.280, 0.0010 0.319, 0.0011 0.300, 0.0008
doi:10.1371/journal.pone.0144296.t004
Fig 7. Average positions of the 751 emojis in tweets.Bubble size is proportional to log10of the emoji occurrences in the Emoji Sentiment Ranking. Left: the beginning of tweets, right: the end of tweets, bottom: negative (red), top: positive (green).
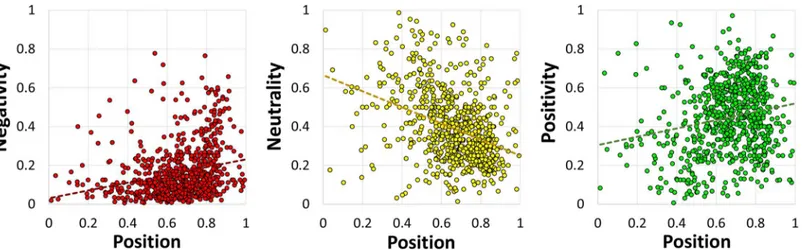
Fig 7also indicates the sentiment of an emoji in relation to its position. InFig 8we decom-pose the sentiment into its three constituent components and show the regression trendlines.
The linear regression functions inFig 8have the following forms:
negativity: p ðdÞ ¼0:20dþ0:03 ðR2
¼0:06Þ;
neutrality: p0ðdÞ ¼ 0:41dþ0:66 ðR2
¼0:14Þ;
positivity: p
þðdÞ ¼0:21dþ0:30 ðR
2
¼0:04Þ;
wheredis the distance from the beginning of the tweets. The functions do notfit the data very well, but they give some useful insight. At any distanced, and for any subset of emojis, the com-ponent probabilities add up to 1:
X
c
pcðdÞ ¼1
However, the negativity and positivity increase with the distance, whereas the neutrality decreases. This means that more emotionally loaded emojis, either negative or positive, tend to occur towards the end of the tweets.
Emojis in different languages
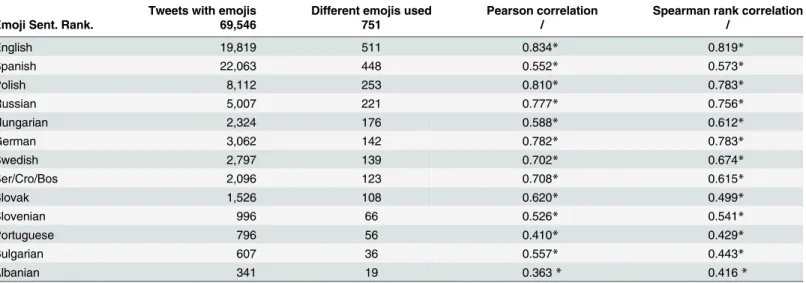
In the final subsection we analyze the use of emojis in the 13 languages processed in this study. Can the Emoji Sentiment Ranking be considered a universal resource, at least for European languages? Is the sentiment ranking between the different languages significantly different? The results inTable 5indicate that the answer to the first question is positive and that there is no evidence of significant differences between the languages.
For each language, we form a list of emojis used in the collected tweets of the language, cut off the emojis with fewer than 5 occurrences (the same threshold as applied to the overall Emoji Sentiment Ranking), and compute their sentiment score. We compute the correlation coefficients between the Emoji Sentiment Ranking and the individual languages. As can be seen inTable 5, the number of emojis actually used in the different languages (above the threshold) drops considerably. However, their sentiment scores and ranking remain stable.
Fig 8. Negativity, neutrality, and positivity regressed with position (from left to right).The trendlines are functionspc(d) of the distancedfrom the
Both Pearson’s correlation and Spearman’s rank correlation are relatively high, and significant for all the languages, except Albanian. This result is biased towards languages with more tweets since they have a larger share in the joint Emoji Sentiment Ranking. An alternative test might compare individual languages and the Emoji Sentiment Ranking with the language removed. However, as a first approximation, it seems reasonable to use the Emoji Sentiment Ranking as a universal, language-independent resource, at least for European languages.
Conclusions
In this paper we describe the construction of an emoji sentiment lexicon, the Emoji Sentiment Ranking, the first such publicly available resource. We have formalized and analyzed the senti-ment properties of the emojis in depth and highlighted some interesting conclusions.
The data that enabled these analyses, 1.6 million annotated tweets in 13 different languages, is a valuable resource with many other useful applications. In particular, we are constructing sentiment-classification models for different languages, and applying them to various tasks. The Slovenian and Bulgarian language-sentiment models were already applied to monitor the mood on Twitter during political elections in realtime [35]. The English sentiment model was used to compare the sentiment leanings of different retweet network communities towards var-ious environmental topics [36]. A domain-specific English sentiment model (from another set of financial tweets) was applied to analyze the effects of Twitter sentiment on stock prices [37]. Yet another English sentiment model was constructed by combining a large set of general, emoticon-labeled tweets with domain-specific financial tweets, and tested for Granger causality on the Baidu stocks [38]. The same methodology of manual text annotations, automated model construction, and sentiment classification was also applied to Facebook comments in Italian, where the emotional dynamics in the spreading of conspiracy theories was studied [26].
The sentiment annotation of tweets by humans is expensive. Emoticons were already used as a proxy for the sentiment labels of tweets. We expect that the Emoji Sentiment Ranking will turn out to be a valuable resource for helping humans during the annotation process, or even to automatically label the tweets with emojis for sentiment. In a lexicon-based approach to sen-timent analysis, the emoji lexicon can be used in combination with a lexicon of sensen-timent-bear- sentiment-bear-ing words. Alternatively, an emoji with already-known sentiment can act as a seed to transfer
Table 5. Emoji sentiment in different languages.The languages are ordered by the number of different emojis used. Correlations are between the senti-ment scores of emojis in the 13 languages and the Emoji Sentisenti-ment Ranking. The correlation values, significant at the 1% level, are indicated by*.
Tweets with emojis Different emojis used Pearson correlation Spearman rank correlation
Emoji Sent. Rank. 69,546 751 / /
English 19,819 511 0.834* 0.819*
Spanish 22,063 448 0.552* 0.573*
Polish 8,112 253 0.810* 0.783*
Russian 5,007 221 0.777* 0.756*
Hungarian 2,324 176 0.588* 0.612*
German 3,062 142 0.782* 0.783*
Swedish 2,797 139 0.702* 0.674*
Ser/Cro/Bos 2,096 123 0.708* 0.615*
Slovak 1,526 108 0.620* 0.499*
Slovenian 996 66 0.526* 0.541*
Portuguese 796 56 0.410* 0.429*
Bulgarian 607 36 0.557* 0.443*
Albanian 341 19 0.363* 0.416*
the sentiment to the words in proximity. Such a corpus-based approach can be used for an automated corpus construction for feature generation [12], and then applied to train a senti-ment classifier.
There are other dimensions of sentiment that are beyond the one-dimensional scale from negativity to positivity and worth exploring. The expressiveness of the emojis allows us to assign them more subtle emotional aspects, such as anger, happiness, or sadness, and some shallow semantics, such as activities, locations, or objects of interest. An additional structuring of the emojis can be derived from correlations between their sentiment, e.g., various versions of hearts expressing love. However, we consider the interplay between the emojis and the text to be one of the most promising directions for future work. Not only the position of an emoji, but certainly its textual context is also important in determining the role of the emoji as an ampli-fier and modiampli-fier of the meaning.
In the future, it will be interesting to monitor how the use of emojis is growing, and if textual communication is increasingly being replaced by a pictorial language. Also, the sentiment and meaning of emojis evolve over time. It might be interesting to investigate the convergence of agreement on the meaning of controversial emojis, and to study the underpinnings of the cor-responding social processes.
Methods
Ethics statement
The tweets were collected through the public Twitter API and are subject to the Twitter terms and conditions. The sentiment annotations were supported by the Goldfinch platform, provided by Sowa Labs (http://www.sowalabs.com). The human annotators were engaged for the pur-pose, and were aware that their annotations will be used to construct the sentiment-classifica-tion models, and to estimate the inter-annotator agreement and the annotator self-agreement.
Data collection
The main source of the data used in this study is a collection of tweets, in 13 European lan-guages, collected between April 2013 and February 2015. Most of the tweets (except English) were collected during a joint project with Gama System (http://www.gama-system.si), using their PerceptionAnalytics platform (http://www.perceptionanalytics.net). The tweets of selected languages were collected through Twitter Search API, by specifying the geolocations of the largest cities. For English tweets, we used Twitter Streaming API (a random sample of 1% of all public tweets), and filtered out the English posts.
We have engaged 83 native speakers (except for English) to manually annotate for senti-ment over 1.6 million of the collected tweets. The annotation process was supported by the Goldfinch platform designed specifically for sentiment annotation of short texts (such as Twit-ter posts, Facebook comments,. . .). The annotators were instructed to label each tweet as
eithernegative,neutral, orpositive, by estimating the emotional attitude of the user who posted the tweet. They could also skip the inappropriate or irrelevant tweets. The breakdown of the annotated tweets by language is inTable 6.
Another source of data comes from Emojitracker (http://emojitracker.com/). Emojitracker monitors and counts the number of emojis used on Twitter in realtime. It has been active since July 2013, and so far it has detected over 10 billion emoji occurrences. We downloaded the cur-rent count of emoji occurrences as of June 2015. This data is used to estimate how representa-tive is our sample of emojis in the annotated tweets.
Emoji Sentiment Ranking, and the other from Emojitracker. The tables list all the emojis found, their occurrences, and, in the case of the Emoji Sentiment Ranking, also their numbers in the negative, neutral, and positive tweets. From this data, the Emoji Sentiment Ranking web page athttp://kt.ijs.si/data/Emoji_sentiment_ranking/is automatically generated.
Emoji Unicode symbols
The exact definition of what constitutes an emoji symbol is still emerging. In particular, there is some discrepancy between our set of emojis and the emojis tracked by Emojitracker. Also, dur-ing the writdur-ing of this paper, in August 2015, the Unicode consortium published a new set of emojis, theUnicode Emoji Charts(http://www.unicode.org/emoji/).
The set of emojis in our Emoji Sentiment Ranking follows the Unicode standard version 8 [15] and consists of all the single-character symbols from the Unicode category‘Symbol, Other’(abbreviated[So]) that appear in our tweets. Emojitracker, on the other hand, also tracks some double-character symbols (10 Country Flags, and 11 Combining Enclosing Key-caps), but does not track all the[So]symbols that appear in our data. In particular, 49 Ding-bats, 46 Miscellaneous Symbols, 38 Box Drawings, 28 Geometric Shapes, 21 Enclosed
Alphanumerics, 20 Enclosed Alphanumeric Supplements, and 13 Arrows are not tracked. The Unicode Emoji Charts have introduced even more new emoji symbols, in particular an exhaus-tive list of 257 double-character Country Flags. A comparison of the overlaps and differences in the emoji symbol specifications between the three sources is in Tables7and8.
The emoji symbols that are not common to all the three data sources are relatively infre-quent. The highest-ranking emoji in Emojitracker, which is absent from our data, has the rank 157 (double exclamation mark). The highest-ranking emoji in the Emoji Sentiment Ranking, not tracked by Emojitracker, has the rank 13 (white heart suit). Additionally, we noticed that we missed three characters from the[So]category:‘degree sign’,‘numero sign’, and‘trade mark sign’. However, only the‘trade mark sign’(with 257 occurrences in our data) is also con-sidered by the Emojitracker and the Unicode Emoji Charts. Despite these minor differences in the emoji sets, all our results remain valid. However, in the next version of the Emoji Sentiment Ranking we plan to extend our set to double-character symbols, and consider all the emojis from the Unicode Emoji Charts as an authoritative source.
Table 6. Tweets annotated for sentiment in different languages.Languages are in alphabetical order, Ser/Cro/Bos denotes a union of tweets in Serbian, Croatian and Bosnian.
Language No. of tweets No. of annotators
Albanian 53,005 13
Bulgarian 67,169 18
English 103,034 9
German 109,130 5
Hungarian 68,505 1
Polish 223,574 8
Portuguese 157,393 1
Russian 107,773 1
Ser/Cro/Bos 215,657 13
Slovak 70,425 1
Slovenian 133,935 7
Spanish 275,588 5
Swedish 58,547 1
Total 1,643,735 83
Sentiment formalization
The sentiment of an individual tweet can benegative,neutral, orpositive. Formally, we repre-sent it by a discrete, 3-valued variable,c, which denotes the sentiment class:
c2 f 1;0;þ1g
This variable models well our assumptions about the ordering of the sentiment values and the distances between them.
An object of Twitter posts to which we attribute sentiment (an emoji in our case, but it can also be a stock [37], a political party [35], a discussion topic [26,36], etc.) occurs in several tweets. A discrete distribution:
NðcÞ; X
c
NðcÞ ¼N; c2 f 1;0;þ1g;
captures the sentiment distribution for the set of relevant tweets.Ndenotes the number of all the occurrences of the object in the tweets, andN(c) are the occurrences in tweets with the
Table 7. Types and numbers of emoji symbols. [So]is an abbreviation for the Unicode category‘Symbol, Other’.
No. of all emoji symbols single character [So]
non-[So]
double character flags
keycaps
Emoji Sentiment Ranking 969 969 969
0
0 0
0
Emojitracker 845 824 812
12
21 10
11
Unicode Emoji Charts 1281 1012 995
17
269 257
12 doi:10.1371/journal.pone.0144296.t007
Table 8. Overlaps and differences for emojis from the three data sources.A table entry is the number of emojis in (2), or missing (2=) from a data source.N(Single,Double) denotes the total numberNof emoji sym-bols, partitioned into theSingle- andDouble-character symbols, respectively.
Emoji Sentiment Ranking
2 2= Total
Emojitracker 2 721 (721, 0) 124 (103, 21) 845 (824, 21)
=
2 248 (248, 0) / /
Unicode 2 734 (734, 0) 547 (278, 269) 1281 (1012, 269)
Emoji Charts 2= 235 (235, 0) / /
Total 969 (969, 0) /
sentiment labelc. From the above we form a discrete probability distribution:
ðp ;p0;pþÞ; X
c
pc ¼1:
For convenience, we use the following abbreviations:
p ¼pð 1Þ; p0¼pð0Þ; p
þ¼pðþ1Þ;
wherep−,p0, andp+denote thenegativity,neutrality, andpositivityof the object (an emoji in
our case), respectively. In SentiWordNet [16], the termobjectivityis used instead of the neu-tralityp0. Thesubjectivitycan then be defined asp−+p+[39].
Typically, probabilities are estimated from relative frequencies,pc=N(c)/N. For large sam-ples, such estimates are good approximations. Often, however, and in particular in our case, we are dealing with small samples, e.g.,N= 5. In such situations, it is better to use theLaplace esti-mate(also known as therule of succession) to estimate the probability [40]:
pc ¼
NðcÞ þ1
Nþk ; ðfor largeN: pc NðcÞ
N Þ:
The constantkin the denominator is the cardinality of the class, in our casek= |c| = 3. The Laplace estimate assumes a prior uniform distribution, which makes sense when the sample size is small.
Once we have a discrete probability distribution, with properly estimated probabilities, we can compute its mean:
x ¼X
c
pcc:
We define thesentiment score,s, as the mean of the discrete probability distribution:
s¼ 1p þ0p0þ1p
þ¼pþ p :
The sentiment score has the range: 1<s<þ1.
The standard deviation of a discrete probability distribution is:
SD¼ ffiffiffiffiffiffiffiffiffiffiffiffiffiffiffiffiffiffiffiffiffiffiffiffiffiffiffiffiffiffiX
c
pc ðc xÞ
2 r
;
and the standard error of the mean is:
SEM¼ SDffiffiffiffi N
p :
Sentiment bar
The sentiment bar is a useful, novel visualization of the sentiment attributed to an emoji (see
http://kt.ijs.si/data/Emoji_sentiment_ranking/for examples). In a single image, it captures all the sentiment properties, computed from the sentiment distribution of the emoji occurrences:
p ; p0; pþ; s, ands1:96SEM (the 95% confidence interval). Three examples that illustrate
positive, but its standard error bar extends into the neutral zone, so we can conclude with high confidence only that its sentiment is not negative.
Welch
’
s t-test
Welch’s t-test [31] is used to test the hypothesis that two populations have equal means. It is an adaptation of Student’s t-test, but is more reliable when the two samples have unequal vari-ances and sample sizes. Welch’s t-test is also robust for skewed distributions and even more for large sample sizes [32].
Welch’s t-test defines the t statistic as follows:
t¼ ffiffiffiffiffiffiffiffiffiffiffiffiffiffiffiffiffiffiffiffiffix1 x2
SD2 1 N1 þ
SD2 2 N2
s :
The degrees of freedom,ν, are estimated as follows:
n
SD2 1 N1 þ
SD2 2 N2
2
SD4 1 N2
1ðN1 1Þ
þ SD
4 2 N2
2ðN2 1Þ
6 6 6 6 6 6 4
7 7 7 7 7 7 5 ;
Fig 9. Sentiment bars of the‘thumbs down sign’,‘flushed face’, and‘chocolate bar’emojis.The colored bar extends from−1 to +1, the range of the sentiment scores. The grey bar is centered atsand extended for1:96SEM, but never beyond the range ofs. Colored parts are proportional to negativity (p−, red), neutrality (p0, yellow), and positivity (p+, green).
wherebcdenotes the approximate degrees of freedom, rounded down to the nearest integer. Once the t value and the degrees of freedom are determined, a p-value can be found from a table of values for Student’s t-distribution. For large degrees of freedom,ν>100, the t-distribu-tion is very close to the normal distribut-distribu-tion. If the p-value is below the threshold of statistical significance, then the null hypothesis is rejected.
Pearson and Spearman correlations
We need to correlate two properties of the Emoji Sentiment Ranking with other data. In the first case we correlate the emojis ranked by occurrence to the Emojitracker list—the property of the list elements is the number of occurrences. In the second case we correlate the emojis ranked by sentiment to subsets of emojis from the 13 different languages—the property of the list elements is the sentiment score.
For any two listsxandy, of lengthn, we first compute the Pearson correlation coefficient [29]:
rðx;yÞ ¼
Pn
i¼1ðxi xÞðyi yÞ
ffiffiffiffiffiffiffiffiffiffiffiffiffiffiffiffiffiffiffiffiffiffiffiffiffiffiffiffiffiffiffiffiffiffiffiffiffiffiffiffiffiffiffiffiffiffiffiffiffiffiffiffiffiffiffiffi Pn
i¼1ðxi xÞ
2Pn
i¼1ðyi yÞ
2
q ;
wherexandyare the list’s mean values, respectively. The Spearman’s rank correlation coefficient [30] is computed in the same way, the property values of thexandyelements are just replaced with their ranks. In both cases we report the correlation coefficients at the 1% significance level.
Agreement measures
In general, an agreement can be estimated between any two methods for generating data. In our case we want to estimate the agreement between humans when annotating the same tweets for sentiment. A comparison of agreements between different datasets gives some clue about how difficult the task is. There are different measures of agreement, and to get a robust estimate of the differences, we apply three well-known measures.
Krippendorff’sAlpha-reliability [33] is a generalization of several specialized agreement measures. It works for any number of annotators, is applicable to different variable types and metrics (e.g., nominal, ordered, interval, etc.), and can handle small sample sizes.Alphais defined as follows:
Alpha¼1 Do De ;
whereDois the observed disagreement between the annotators, andDeis the disagreement expected by chance. When the annotators agree perfectly,Alpha= 1, and when the level of agreement equals the agreement by chance,Alpha= 0. The two disagreement measures are defined as follows:
Do¼
1
N X
c;c0
Nðc;c0Þ d2 ðc;c0Þ;
De¼
1
NðN 1Þ X
c;c0
NðcÞ Nðc0Þ d2 ðc;c0Þ:
The arguments,N,N(c,c0),N(c), andN(c0), refer to the frequencies in a coincidence matrix, defined below.δ(c,c0) is a difference function between the values ofcandc0, and depends on
the difference functionδis defined as:
dðc;c0Þ ¼ jc c0j c;c02 f 1;0;þ1g:
In [33], this is called theintervaldifference function. Note that the function attributes a dis-agreement of 1 between thenegative(orpositive) and theneutralsentiment, and a disagree-ment of 2 between thenegativeandpositivesentiments.
Acoincidence matrixtabulates all the pairable values ofcfrom two different annotators into ak-by-ksquare matrix, wherek= |c|. Unlike a contingency matrix (used in association and correlation statistics) which tabulates pairs of values, a coincidence matrix tabulates all the pairable values. A coincidence matrix omits references to annotators. It is symmetrical around the diagonal, which contains all the perfect matches. A coincidence matrix has the following general form:
c0 P
: : :
c : Nðc;c0Þ : NðcÞ
: : :
P
Nðc0Þ N
Herecandc0range over all possible values of the variable. In a coincidence matrix, each labeled unit is entered twice, once as a (c,c0) pair, and once as a (c0,c) pair.N(c,c0) is the number of units labeled by the valuescandc0by different annotators,N(c) andN(c0) are the totals for each value, andNis the grand total. Note thatNis two times the number of units labeled by the different annotators.
In the case of sentiment annotations, we have a 3-by-3 coincidence matrix. Two example matrices are shown in Tables9and10. Note that both coincidence matrices in Tables9and10
are symmetric around the diagonal, and that the totalsNare two times larger than inTable 3
because each annotated tweet is counted twice.
Table 9. Coincidence matrix for tweets with emojis.
Sentiment Negative Neutral Positive Total
Negative 1,070 354 196 1,620
Neutral 354 902 725 1,981
Positive 196 725 2,572 3,493
Total 1,620 1,981 3,493 7,094
doi:10.1371/journal.pone.0144296.t009
Table 10. Coincidence matrix for tweets without emojis.
Sentiment Negative Neutral Positive Total
Negative 15,356 7,777 3,004 26,137
Neutral 7,777 23,670 10,921 42,368
Positive 3,004 10,921 21,624 35,549
Total 26,137 42,368 35,549 104,054
In machine learning, a classification model is automatically constructed from the training data and evaluated on a disjoint test data. A common, and the simplest, measure of the perfor-mance of the model isAccuracy, which measures the agreement between the model and the test data. Here, we use the same measure to estimate the agreement between the pairs of anno-tators.Accuracyis defined in terms of the observed disagreementDo:
Accuracy¼1 D
o¼
1
N X
c
Nðc;cÞ:
Accuracyis simply the fraction of the diagonal elements of the coincidence matrix. Note that it does not account for the (dis)agreement by chance, nor for the ordering between the sentiment values.
Another, more sophisticated measure of performance, specifically designed for 3-class senti-ment classifiers [12], isF1(−, +):
F1ð ;þÞ ¼F1ð Þ þ2F1ðþÞ:
F1(−, +) implicitly takes into account the ordering of the sentiment values by considering only
thenegative(−) andpositive(+) labels, and ignoring the middle,neutrallabel. In general,F1(c)
(known as the F-score) is a harmonic mean of precision and recall for classc. In the case of a coincidence matrix, which is symmetric, the‘precision’and‘recall’are equal, and thusF1(c) degenerates into:
F1ðcÞ ¼Nðc;cÞ NðcÞ :
In terms of the annotator agreement,F1(c) is the fraction of equally labeled tweets out of all the tweets with labelc.
Acknowledgments
We acknowledge Gama System (http://www.gama-system.si) who collected most of the tweets (except English), and Sowa Labs (http://www.sowalabs.com) for providing the Goldfinch plat-form for the sentiment annotation of the tweets. We thank Sašo Rutar for generating the Emoji
Sentiment Ranking web page, Andrej Blejec for statistical insights, and Vinko Zlatićfor
sug-gesting an emoji distribution model.
Author Contributions
Conceived and designed the experiments: PKN JS BS IM. Performed the experiments: PKN JS BS. Analyzed the data: PKN JS BS IM. Wrote the paper: IM BS JS PKN.
References
1. Dimson T. Emojineering part 1: Machine learning for emoji trends [blog]; 2015. http://instagram-engineering.tumblr.com/post/117889701472/emojineering-part-1-machine-learning-for-emoji/.
2. SwiftKey PT. Most-used emoji revealed: Americans love skulls, Brazilians love cats, the French love hearts [blog]; 2015. http://swiftkey.com/en/blog/americans-love-skulls-brazilians-love-cats-swiftkey-emoji-meanings-report/.
3. Liu B. Sentiment Analysis and Opinion Mining. Synthesis Lectures on Human Language Technologies. 2012; 5(1):1–167. doi:10.2200/S00416ED1V01Y201204HLT016
5. Boia M, Faltings B, Musat CC, Pu P. A:) is worth a thousand words: How people attach sentiment to emoticons and words in tweets. In: Intl. Conf. on Social Computing (SocialCom). IEEE; 2013. p. 345– 350.
6. Hogenboom A, Bal D, Frasincar F, Bal M, de Jong F, Kaymak U. Exploiting emoticons in polarity classi-fication of text. Journal of Web Engeneering. 2015; 14(1–2):22–40.
7. Hogenboom A, Bal D, Frasincar F, Bal M, de Jong F, Kaymak U. Exploiting emoticons in sentiment analysis. In: Proc. 28th Annual ACM Symposium on Applied Computing. ACM; 2013. p. 703–710.
8. Davidov D, Tsur O, Rappoport A. Enhanced sentiment learning using Twitter hashtags and smileys. In: Proc. 23rd Intl. Conf. on Computational Linguistics: Posters. ACL; 2010. p. 241–249.
9. Liu KL, Li WJ, Guo M. Emoticon smoothed language models for Twitter sentiment analysis. In: Proc. 26th AAAI Conf. on Artificial Intelligence; 2012. p. 1678–1684.
10. Read J. Using emoticons to reduce dependency in machine learning techniques for sentiment classifi-cation. In: Proc. ACL Student Research Workshop. ACL; 2005. p. 43–48.
11. Zhao J, Dong L, Wu J, Xu K. Moodlens: An emoticon-based sentiment analysis system for Chinese tweets. In: Proc. 18th ACM SIGKDD Intl. Conf. on Knowledge Discovery and Data Mining. ACM; 2012. p. 1528–1531.
12. Kiritchenko S, Zhu X, Mohammad SM. Sentiment analysis of short informal texts. Journal of Artificial Intelligence Research. 2014;p. 723–762.
13. The Unicode Consortium, Allen JD, et al. The Unicode Standard, Version 6.0. Mountain View, CA; 2011. Available from:http://www.unicode.org/versions/Unicode6.0.0/.
14. The Unicode Consortium, Allen JD, et al. The Unicode Standard, Version 7.0. Mountain View, CA; 2014. Available from:http://www.unicode.org/versions/Unicode7.0.0/.
15. The Unicode Consortium, Allen JD, et al. The Unicode Standard, Version 8.0. Mountain View, CA; 2015. Available from:http://www.unicode.org/versions/Unicode8.0.0/.
16. Baccianella S, Esuli A, Sebastiani F. SentiWordNet 3.0: An enhanced lexical resource for sentiment analysis and opinion mining. In: LREC. vol. 10; 2010. p. 2200–2204.
17. Miller GA. WordNet: A lexical database for English. Communications of the ACM. 1995; 38(11):39–41. doi:10.1145/219717.219748
18. Go A, Bhayani R, Huang L. Twitter sentiment classification using distant supervision. CS224N Project Report, Stanford. 2009;1:12.
19. Pak A, Paroubek P. Twitter as a corpus for sentiment analysis and opinion mining. In: LREC. vol. 10; 2010. p. 1320–1326.
20. Thelwall M, Buckley K, Paltoglou G, Cai D, Kappas A. Sentiment strength detection in short informal text. Journal of the American Society for Information Science and Technology. 2010; 61(12):2544– 2558. doi:10.1002/asi.21416
21. Amalanathan A, Anouncia SM. Social network user’s content personalization based on emoticons. Indian Journal of Science and Technology. 2015; 8(23).
22. Ganesan KA, Sundaresan N, Deo H. Mining tag clouds and emoticons behind community feedback. In: Proc. 17th Intl. Conf. on World Wide Web. ACM; 2008. p. 1181–1182.
23. Kramer AD. The spread of emotion via Facebook. In: Proc. SIGCHI Conf. on Human Factors in Com-puting Systems. ACM; 2012. p. 767–770.
24. Kramer AD, Guillory JE, Hancock JT. Experimental evidence of massive-scale emotional contagion through social networks. Proc. National Academy of Sciences. 2014; 111(24):8788–8790. doi:10. 1073/pnas.1320040111
25. Coviello L, Sohn Y, Kramer AD, Marlow C, Franceschetti M, Christakis NA, et al. Detecting emotional contagion in massive social networks. PLoS ONE. 2014; 9(3):e90315. doi:10.1371/journal.pone. 0090315PMID:24621792
26. Zollo F, Novak Kralj P, Del Vicario M, Bessi A, MozetičI, Scala A, et al. Emotional dynamics in the age
of misinformation. PLoS ONE. 2015; 10(9):e138740. doi:10.1371/journal.pone.0138740
27. Gruzd A, Doiron S, Mai P. Is happiness contagious online? A case of Twitter and the 2010 Winter Olym-pics. In: Proc. 44th Hawaii Intl. Conf. on System Sciences (HICSS). IEEE; 2011. p. 1â??9.
28. Hatfield E, Cacioppo JT, Rapson RL. Emotional Contagion. Cambridge University Press; 1994.
29. Pearson K. Note on regression and inheritance in the case of two parents. Proceedings of the Royal Society of London. 1895; 58:240–242. doi:10.1098/rspl.1895.0041
31. Welch BL. The generalization of“Student’s”problem when several different population variances are involved. Biometrika. 1947; 34(1–2):28–35. doi:10.1093/biomet/34.1-2.28PMID:20287819
32. Fagerland MW. t-tests, non-parametric tests, and large studies—a paradox of statistical practice? BMC Medical Research Methodology. 2012; 12(78). doi:10.1186/1471-2288-12-78PMID:22697476
33. Krippendorff K. Content Analysis, An Introduction to Its Methodology. 3rd ed. Thousand Oaks, CA: Sage Publications; 2012.
34. Newman MEJ. Power laws, Pareto distributions and Zipf’s law. Contemporary Physics. 2005; 46 (5):323–351. Available from:http://arxiv.org/abs/cond-mat/0412004. doi:10.1080/
00107510500052444
35. SmailovićJ, Kranjc J, Grčar M,ŽnidaršičM, MozetičI. Monitoring the Twitter sentiment during the Bul-garian elections. In: Proc. IEEE Intl. Conf. on Data Science and Advanced Analytics (DSAA). IEEE; 2015.
36. Sluban B, SmailovićJ, Battiston S, MozetičI. Sentiment leaning of influential communities in social net-works. Computational Social Netnet-works. 2015; 2(9). Available from: http://dx.doi.org/10.1186/s40649-015-0016-5.
37. Ranco G, Aleksovski A, Caldarelli G, Grčar M, MozetičI. The effects of Twitter sentiment on stock price returns. PLoS ONE. 2015; 10(9):e138441. doi:10.1371/journal.pone.0138441
38. SmailovićJ, Grčar M, LavračN,ŽnidaršičM. Stream-based active learning for sentiment analysis in the
financial domain. Information Sciences. 2014; 285:181–203. doi:10.1016/j.ins.2014.04.034
39. Zhang W, Skiena S. Trading strategies to exploit blog and news sentiment. In: Proc. 4th Intl. AAAI Conf. on Weblogs and Social Media; 2010. p. 375–378.