DETECÇÃO DE INFLUÊNCIA NO TWITTER
CAROLINA ANDRADE SILVA BIGONHA
DETECÇÃO DE INFLUÊNCIA NO TWITTER
BASEADA EM SENTIMENTO
Dissertação apresentada ao Programa de Pós-Graduação em Ciência da Computação do Instituto de Ciências Exatas da Univer-sidade Federal de Minas Gerais como req-uisito parcial para a obtenção do grau de Mestre em Ciência da Computação.
Orientador: Mirella M. Moro
Coorientador: Marcos André Gonçalves
Belo Horizonte
CAROLINA ANDRADE SILVA BIGONHA
SENTIMENT-BASED INFLUENCE DETECTION
ON TWITTER
Dissertation presented to the Graduate Program in Computer Science of the Uni-versidade Federal de Minas Gerais - Detamento de Ciência da Computação in par-tial fulfillment of the requirements for the degree of Master in Computer Science.
Advisor: Mirella M. Moro
Co-advisor: Marcos André Gonçalves
Belo Horizonte
c
2012, Carolina Andrade Silva Bigonha. Todos os direitos reservados.
Bigonha, Carolina Andrade Silva.
B594d Detecção de influência no Twitter baseada em sentimento / Carolina Andrade Silva Bigonha. — Belo Horizonte, 2012
xxiii, 97 f. : il. ; 29cm
Dissertação (mestrado) — Universidade Federal de Minas Gerais - Departamento de Ciência da
Computação
Orientador: Mirella M. Moro
Coorientador: Marcos André Gonçalves
1. Computação Teses. 2. Redes sociais online -Teses. I. Orientador II. Coorientador III. Título.
Acknowledgments
I am deeply grateful to my supervisors, Mirella and Marcos. Their knowledge and guidance were essential to the development of this work. Additionally, I would like to show my gratitude to Professor Denilson Barbosa, for receiving me at the University of Alberta and for the insightful meetings. I also wish to thank my partners (and friends) at Zahpee, for whom I have great regard. Finally, my warm thanks are due to my parents Mariza and Roberto, to my sister Patrícia, to Thiago and to my dear friends for the love and support.
This work is partially supported by the project INCT-Web (MCT/CNPq grant 57.3871/2008-6) and by a FAPEMIG scholarship. This financial support is greatefully acknowledged.
“We perceive and are affected by changes too subtle to be described.” (Henry David Thoreau)
Resumo
O conteúdo gerado por usuários e disponível em comunidades online é fácil de criar e consumir. Ultimamente, esse tipo de conteúdo se tornou estrategicamente importante para empresas interessadas em obterfeedback da população em relação a produtos, pro-pagandas, etc. Uma das comunidadesonline mais importantes atualmente é o Twitter: estatísticas recentes reportam 65 milhões de novos tweets por dia. No entanto, além de processar todo o conteúdo disponível nessas comunidades ser uma tarefa custosa, uma parte considerável dos dados não é útil para análise estratégica. Neste contexto, com o objetivo de filtrar os dados a serem analisados, propõe-se um novo método para ordenar os usuários mais influentes no Twitter de acordo com um determinado tópico. Esta nova abordagem é baseada na combinação de três fatores relacionados a cada usuário: seu relacionamento com seus vizinhos, a polaridade das suas opiniões e as caracterís-ticas textuais dos seus tweets. A avaliação experimental deste trabalho mostra que a abordagem proposta pode, com sucesso, identificar alguns dos usuários mais influentes para três bases diferentes. Especificamente, avalia-se, para tais bases, o desempenho do método apresentado focando-se em interações entre usuários via tweets e em conexões explícitas; estuda-se o impacto de cada fator de um usuário no seu nível de influência; compara-se o desempenho do método apresentado com diversos baselines; e discute-se o impacto da análise automática do sentimento dos tweets na detecção de evangelistas e difamadores.
Abstract
The user generated content available in online communities is easy to create and con-sume. Lately, it also became strategically important to companies interested in obtain-ing population feedback on products, merchandisobtain-ing, etc. One of the most important online communities is Twitter: recent statistics report 65 million new tweets each day. However, processing this amount of data is very costly and a big portion of the content is simply not useful for strategic analysis. Thus, in order to filter the data to be ana-lyzed, we propose a new method for ranking the most influential users in Twitter. This new approach is based on a combination of the users’ position in networks that emerge from Twitter relations, the polarity of their opinions and the textual characteristics of their tweets. Our experimental evaluation shows that our approach can successfully identify some of the most influential users on three different datasets. Specifically, we evaluate the performance of the presented method focusing on the interactions be-tween users and the explicit connections bebe-tween them; we study the impact of each perspective of users’ behavior on their level of influence; we compare the performance of the presented method with distinct baselines; and, finally, we discuss the impact of automatic analysis of tweets’ sentiment on finding evangelists and detractors.
List of Figures
3.1 SaID overview. . . 17
3.2 Example of each interaction via tweets. . . 21
3.3 Example of positive tweets about Paypal. . . 25
3.4 Example of negative tweets about Paypal. . . 25
3.5 Example of neutral tweets about Paypal. . . 26
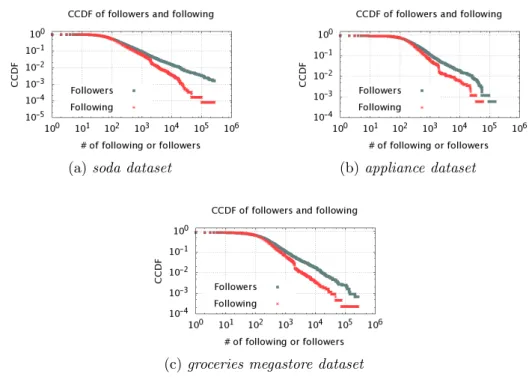
4.1 CCDF probabilities of following and followers for each dataset. . . 33
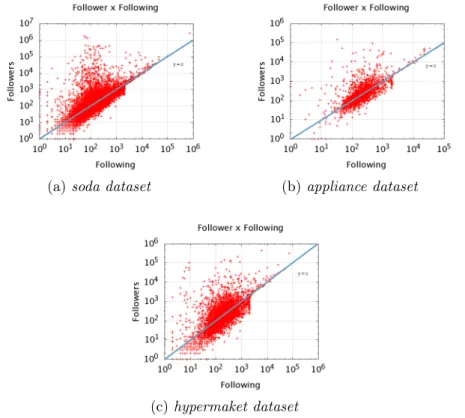
4.2 The relation between the number of followers and following of a user. . . . 34
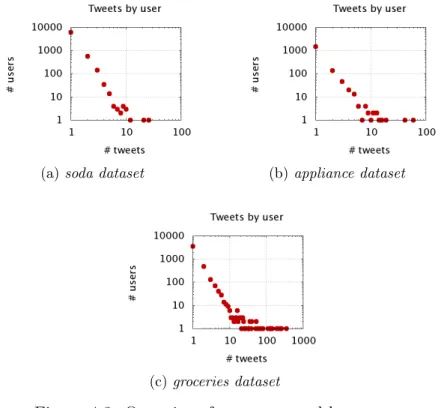
4.3 Quantity of tweets posted by users. . . 36
4.4 User data and analysis. . . 38
4.5 Evaluation pool results. . . 40
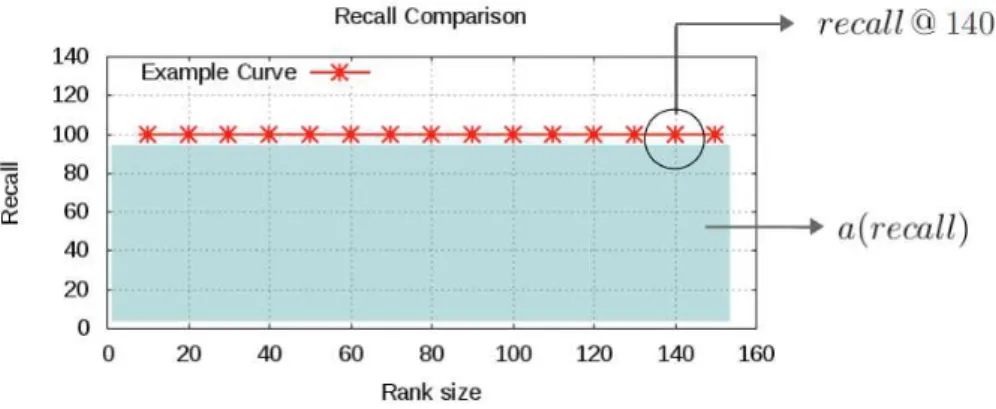
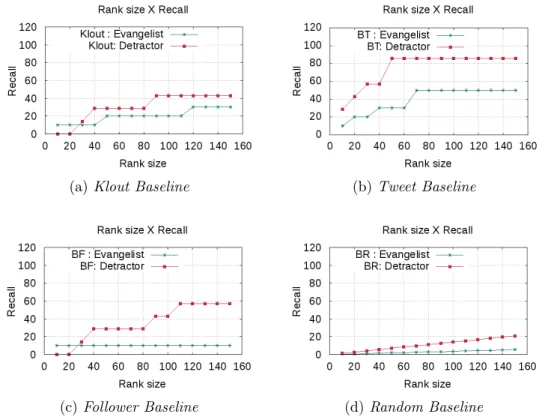
4.6 Example of plot for recall@x, 10≤x≤150. . . 42
4.7 Values ofrecall@x using each baseline, forsoda dataset. . . 46
4.8 Values ofrecall@x using each baseline, forappliance dataset. . . 47
4.9 Values ofrecall@x using each baseline, forgroceries megastore dataset. . . 48
4.10 Graphic representation of Gi and Gc for the datasets. . . 49
4.11 Paired observations for Interaction and Connection Graph approaches for evangelists and detractors’ recall @ x in both datasets. The parameters (α, β, γ)of Formula 3.5 are calculated using a leave-one-out procedure. . . 52 4.12 Plot of recall@x, using Gi, considering only polarity, relation and content
in both datasets. For polarity the parameters of Formula 3.5 are be α = 1, β = γ = 0, for relation, β = 1, α = γ = 0 and for content, gamma = 1, α=γ = 0. Baseline curves are also displayed for each case, for comparison. 55 4.13 Plot of recall@x, using Gi, considering only polarity, relation and content
in both datasets. For polarity the parameters of Formula 3.5 are be α = 1, β = γ = 0, for relation, β = 1, α = γ = 0 and for polarity, gamma = 1, α=γ = 0. Baseline curves are also displayed for each case, for comparison. 56
4.14 Plot ofrecall@x, using Gi, considering only polarity, relation and content in both datasets. For polarity the parameters of Formula 3.5 are be α = 1, β = γ = 0, for relation, β = 1, α = γ = 0 and for polarity, gamma = 1, α=γ = 0. Baseline curves are also displayed for each case, for comparison. 57 4.17 Leave one out for influence score. . . 63 4.18 Comparison of SaID with the baselines for evangelists and detractors. . . . 66
5.1 The 10-fold cross validation technique and final prediction of tweets. . . 70 5.2 The 10-fold cross validation technique and final prediction of tweets. . . 71 5.3 Comparing automatic and manual approaches. . . 74
A.1 Term cloud for positive, negative and neutral tweets for the soda dataset. . 84 A.2 Term cloud for positive, negative and neutral tweets for the appliance dataset. 85 A.3 Term cloud for positive, negative and neutral tweets for the groceries dataset. 86
List of Tables
1.1 Twitter numbers and statistics (Extracted from Twitter Blog Penner [2011]) . . . 2
2.1 Glossary of Twitter terms. . . 8
3.1 Characteristics of Influential Users. . . 16
3.2 Example of queries. . . 19
3.3 Construction of Connection and Interaction Graphs. . . 22
4.1 Datasets’ characteristics. . . 32
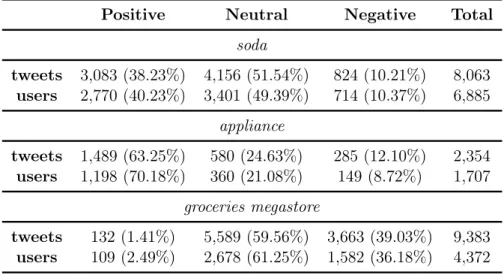
4.2 Tweets and users per sentiment. . . 35
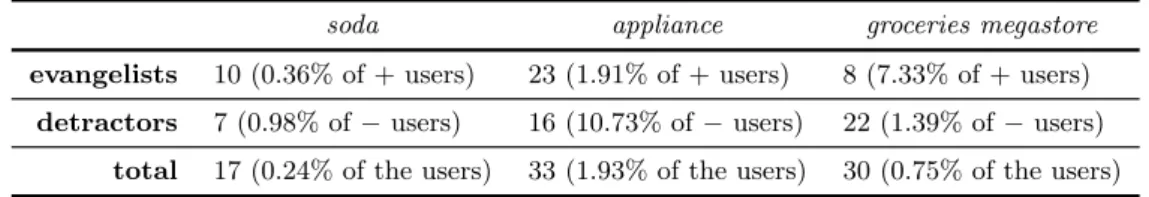
4.3 Number of influential users (evangelists and detractors) in each dataset and the fraction that they represent. . . 41
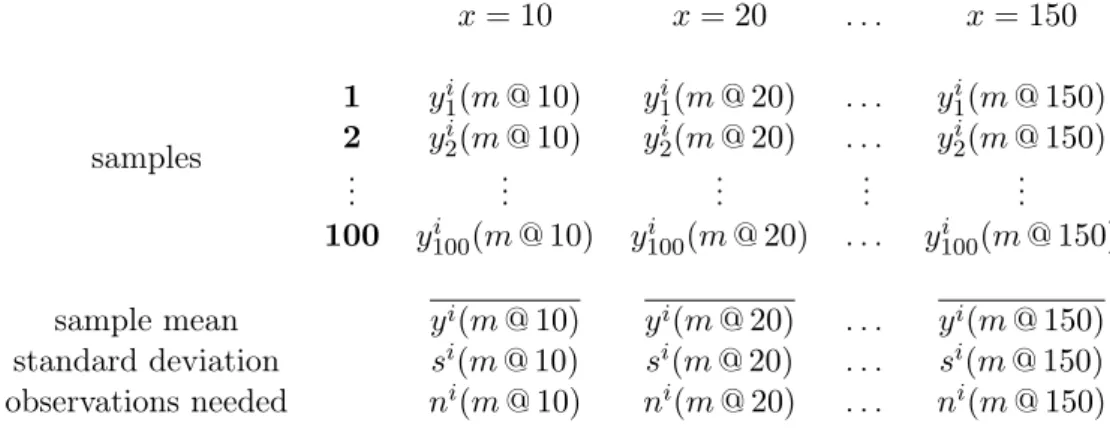
4.4 Notation used for recall@x and F2@x measures m calculated for the po-larity i={e, d} for each dataset. . . 45
4.5 Number of observations needed for recall and F2 random plots, with20% of accuracy and a level of confidence of 80%. . . 45
4.6 Statistics for Gi and Gc for each dataset. . . 48
4.7 Fi 2 values for the ranked lists. The arrows indicates the higher (best) (N) and lower (worst) (H) values. The circle (•) indicates equal or approximated values. The parametersα,β andγused in this experiment were determined in a leave-one-out procedure. . . 50
4.8 Difference of recall (Gi−Gc), with 90% confidence intervals. The symbol Nhighlights the cases in which Gi is better,H highlights when Gc is better and•shows the cases in which the difference between the approaches is not statistically significant. . . 51 4.9 Computing time comparison, in seconds, of betweeness and eigenvector
cen-trality inGi and Gc. The symbolNaccounts for the cases in whichGc have a higher time of execution thanGi and•for the cases in which the difference includes zero and both approaches have statistically equal time of execution. 54
4.10 Factorial design results for both evangelist (E) and detractors (D) for both datasets. . . 60 4.11 Result of the paired observation of SaID with each baseline. We show the
mean of the differences with their standard deviation and 90% confidence intervals. . . 64 4.12 Mean, standard deviation, minimum and maximum values for number of
neutral tweets, positive tweets an followers for the evangelists. . . 65
5.1 Tweet automatic sentiment classification results (with the 90% confidence interval). . . 72 5.2 Confusion matrix of the user polarity attribution. Each column represents
the users whose polarity was calculated based on the automatic classifica-tion. Each row represents the instances whose polarity was calculated using the manual classification. . . 73 5.3 Values of precision, recall, F1 and Macro-F1 for profile attribution using
automatic classification. . . 73
Contents
Acknowledgments ix
Resumo xiii
Abstract xv
List of Figures xvii
List of Tables xix
1 Introduction 1
1.1 (Eletronic) Word of Mouth . . . 1
1.2 Opinion Leaders, Influential Users . . . 3
1.3 Main Contributions . . . 5
1.4 Text Organization . . . 5
2 A Closer Look at Twitter 7 2.1 Twitter Basic Concepts . . . 7
2.2 Twitter’s Environment and Data . . . 9
2.3 User Influence on Twitter . . . 11
2.3.1 Related Work . . . 11
2.3.2 Our Work . . . 13
2.4 Concluding Remarks . . . 14
3 Sentiment-Based Influence Detection 15 3.1 What is influence and how to measure it on Twitter? . . . 15
3.2 SaID Overview . . . 17
3.3 Pre-processing . . . 18
3.3.1 Topic and time interval definition . . . 18
3.3.2 Crawling . . . 19
3.3.3 Tweet filtering and storage . . . 19 3.3.4 User Data Extraction . . . 19 3.4 Feature Extraction . . . 20 3.4.1 Relation Features . . . 20 3.4.2 Polarity Features . . . 24 3.4.3 Content Features . . . 27 3.5 Influence Score . . . 28 3.6 Concluding Remarks . . . 29
4 Experiments with Manual Assessment of Tweets’ Sentiment 31
4.1 Datasets . . . 31 4.1.1 Dataset Characteristics . . . 32 4.1.2 Tweet Sentiment Classification . . . 34 4.1.3 Influential Users: Ground Truth . . . 36 4.2 Experiment Setup . . . 41 4.2.1 Evaluation Metrics . . . 41 4.2.2 Baselines . . . 43 4.2.3 Analysis of the Baselines . . . 44 4.3 Interaction × Connection Approaches . . . 47 4.3.1 Plotting the Graphs . . . 48 4.3.2 Interaction × Connection-based Influence Detection . . . 49 4.4 Perspective Impact and Parameter Estimation . . . 54 4.4.1 The Impact of Each Perspective . . . 54 4.4.2 Estimating the Parameters . . . 61 4.5 Evangelists x Detractors . . . 63 4.6 Concluding Remarks . . . 66
5 Experiments: Towards a Fully Automatic Approach 69
5.1 Automatic Classification of Tweets . . . 69 5.2 From Tweets to Users . . . 72 5.3 Manual ×Automatic Classification . . . 74 5.4 Concluding Remarks . . . 75
6 Conclusion 77
6.1 Contributions . . . 77 6.2 Future Work . . . 79
Appendix A Characterizing the Content 81
A.1 Term Cloud . . . 81 A.2 Datasets’ Example Tweets . . . 82
Bibliography 87
Chapter 1
Introduction
1.1
(Eletronic) Word of Mouth
Word of mouth (WOM), defined as "oral often inadvertent publicity" by Merriam-Webster, is commonly known as the process of transferring information from person to person. Several studies in consumer behavior [Brown and Reingen, 1987, Engel et al., 1969, Katz et al., 1955] show that WOM communication is more effective in influenc-ing consumers’ attitudes than mass media, such as television, radio and newspapers. Indeed, WOM is perceived by consumers as more reliable, credible and trustworthy compared to firm-initiated communications, as stated in Schiffman and Kanuk [1999]. As interpersonal communication environments evolved to online venues, con-sumers started to engage in the called electronic word of mouth (eWOM), offering and gathering unbiased product information on the Web [Hennig-Thurau et al., 2004]. eWOM may take place in news groups, discussion forums, opinion platforms, online social networks or other environments that allow the creation of user-generated con-tent. Nielsen’s Global Online Consumer Survey of 2009 [The Nilsen Company, 2009] showed that 90% of the Internet consumers worldwide trust recommendations from people they know, while 70% trust consumer opinions posted online.
Among the broad variety of user-generated content environments, such as question-answer databases, blogs, digital videos, podcasts, forums, review sites, so-cial networks, wikis and so on, Twitter1 stands out for its simplicity and diversity. Twitter is a micro-blogging tool that represents a real-time information network. Mo-tivated by the question “What’s happening?”, users of Twitter post messages of up to 140 characters, called statuses, or more familiarly, tweets. A tweet may include,
be-1
Twitter. http://www.twitter.com/
2 Chapter 1. Introduction
Table 1.1: Twitter numbers and statistics (Extracted from Twitter Blog Penner [2011])
#tweets 3 years, 2 months and 1 day. The time it took from the first Tweet to the billionth Tweet.
1 week. The time it now takes for users to send a billion Tweets.
50 million. The average number of Tweets people sent per day, one year ago.
140 million. The average number of Tweets people sent per day, in the last month.
177 million. Tweets sent on March 11, 2011.
456. Tweets per second (TPS) when Michael Jackson died on June 25, 2009 (a record at that time).
6,939. Current TPS record, set 4 seconds after midnight in Japan on New Year’s Day.
#accounts 572,000. Number of new accounts created on March 12, 2011.
460,000. Average number of new accounts per day over the last month.
182%. Increase in number of mobile users over the past year.
sides pure text, links to websites, photos, videos and other media, as well short strings preceded by a hash symbol (#), calledhashtags, usually employed to filter or promote content [Huang et al., 2010].
One of the main characteristics of Twitter is that, due to the message short size and the effortless posting / reading from anywhere, it is easy to both produce and consume content. Jansen et al. [2009], indicate this immediacy of posting (one can send a tweet at the moment of a purchase or a problem in the bank) and the simplicity of finding out what people are talking about as the main factors why Twitter plays a major role in eWOM. Moreover, O’Connor and Balasubramanyan [2010] show that text streams (such as Twitter) are a potential substitute and supplement for traditional public opinion surveys.
In summary, opinions, experiences and suggestions are shared by users on Twitter in large scale. Considering the Twitter users as potential consumers / voters and the WOM generated by their discussions, micro-blogging networks have become a rich source of data in any situation in which feedback is desired. Reacting properly to the information available in Twitter has become essential for businesses [Brown et al., 2007]. By studying the data and the users, they can gather market intelligence and improve their campaigns, products or services acceptance.
1.2. Opinion Leaders, Influential Users 3
1.2
Opinion Leaders, Influential Users
Katz et al. [1955] defined asopinion leaders “the individuals who were likely to influence other persons in their immediate environment”. Although some (e.g., Watts and Dodds [2007]) may question the existence of opinion leaders (or “influentials” as they are also called [Merton, 1968]), their presence and importance are widely discussed on marketing and business environments [Barabasi, 2002, Berry and Keller, 2003, Chan and Misra, 1990, Evangelopoulos and Visinescu, 2012, Gladwell, 2002, Slywotzky and Shapiro, 1993, Van den Bulte and Joshi, 2007]. According to Chan and Misra [1990], the propagation of information through word of mouth communication makes opinion leaders prominent among their group. Their leadership, which may be an indication of innovativeness, comes from their persuasion as early adopters towards later adopters to try a new product or service. This happens, as stated in [Katz et al., 1955, Lazarsfeld et al., 1948], because in a variety of decision-making scenarios, individuals may be influenced more by exposure to each other than to the media.
Assuming the existence of such influential users, we explore what we call sentiment-based influence given a topic. The focus on topics is because people are often interested in monitoring one particular topic or context, e.g., a product, a per-sonality, an event [Savage, 2011]. And it is sentiment-based motivated by insights that can be extracted from polarized content [Arndt, 1967, Chevalier and Mayzlin, 2006, Diakopoulos and Shamma, 2010, O’Connor and Balasubramanyan, 2010]. We perform an analysis focusing on positively and, especially, negatively biased users: as shown in Lee et al. [2008], Mizerski [1982], negative online reviews have a more powerful im-pact on product attitude than the positive ones. The intuition is that negative posts are more likely to induce consumers to change their mind about a product (and choose another one) than positive ones. Moreover, on a crisis manager perspective, identifying negatively biased users may simplify the marketing analysis for branding strategy and brand-customer interaction.
We define the characteristics expected on influential users and propose an ap-proach for finding them on Twitter. Specifically, we formalize influential users as the well connected ones who produce content with potential for changing people’s opinions. In other words, influential users are those:
(i) who are convincing positively or negatively;
(ii) who act like bridges in interactions among a subject;
4 Chapter 1. Introduction
(iv) whose content satisfies a minimum expected quality.
Once we have defined the influential user general profile, the question is then how to identify those users among all. Hence, the method presented in this work for identifying influential users is based on three main perspectives that summarize the behavioral profile of a user on Twitter: polarity, relation and content. First, the polarity features, calculated based on the classification of tweets, consider the user overall contribution to the topic discussion. In other words, the content must be either positive, neutral or negative such that we can classify the user as an evangelist or a detractor. Second, for the relation features, we capture network properties that represent user’s interactions around a topic. Based on such network properties, we apply centrality metrics to rank the notoriety of users according to their position in the network. Influential users have to be well connected to other users, and play a central role in the graph in which they are embedded. Finally, we study content features of the user. We hypothesize that if users are to influence other people, their tweets are expected to have a minimum quality. As shown by Brown et al. [2007], consumers seem to evaluate the credibility of online WOM information in relation to the individual contributor of that information. Content features correspond to the analysis of the readability of the tweet content, ranking higher posts (and, consequently, their authors) that are well written and understandable according to readability metrics.
With that information at hand, the next step is to rank the users according to their level of influence. In order to do so, we have also defined an Influence Score, that combines all user features into one single factor.
For testing our techniques, we built three datasets for specific topics (two product brands and a groceries megastore chain). Each tweet was manually classified aspositive / negative / neutral. Also, each user was categorized as evangelist / detractor / not influential. We used this categorization as ground truth experiments.
1.3. Main Contributions 5
1.3
Main Contributions
The main contributions of this work are summarized as follows.
(a) A new and clear definition of what an influential user is;
(b) A method, called SaID (Sentiment-based Influence Detection on Twitter) for de-tecting influential users based on the polarity of their tweets;
(c) Fully analyzed datasets (users and tweets) that can be used as benchmark for future work;
(d) Detailed comparison of the effect of interactions via tweets and follower/following on influence detection;
(e) Detailed evaluation of the contribution of polarity, relations features and content quality on influence detection;
(f) Analysis of the impact of an automatic tweet sentiment analysis on influence de-tection.
Contributions (a) to (e) are also published in the following papers:
• Detecting Evangelists and Detractors on Twitter. C. Bigonha, T. N. C. Cardoso, M. M. Moro, V. Almeida, and M. A. Gonçalves. In Brazilian Symposium on Multimedia and the Web (WebMedia), 2010.
• Sentiment-based Influence Detection on Twitter. Carolina Bigonha, Thi-ago N. C. Cardoso, Mirella M. Moro, Marcos A. Gonçalves and Virgílio A. F. Almeida,Journal of the Brazilian Computer Society, 2011. DOI:10.1007/s13173-011-0051-5.
1.4
Text Organization
Chapter 2
A Closer Look at Twitter
In this Chapter, Twitter’s main characteristics and features are visited in order to facilitate the understanding of this dissertation. We describe basic concepts of Twitter (along with a glossary table) and several studies that aim to characterize the users and data of Twitter. Then, an overview of recent work concerning influence on Twitter is presented.
2.1
Twitter Basic Concepts
Twitter is a micro-blogging service anda real-time information network, in which con-tent is shared between users through short length text-based posts called tweets. Twit-ter was created in early 2006 [Arrington, 2006, Penner, 2011], and its popularity has increased quickly [Weil, 2010]. The number of Twitter users is estimated in about 200 million [Shiels, 2011]; only on March 12, 2011, 572 thousand new accounts were created [Penner, 2011]. As this service evolved, both the research and business com-munities became more interested in it and plenty analysis of this environment’s users and data took place, as discussed next.
Twitter asks its users the question "What’s happening?", allowing them to answer in quick and frequent Twitter status updates, or tweets. A tweet is a text-only message with at most 140 characters. It can be sent through Twitter’s website, SMS, instant messaging, email, mobile devices and desktop applications.
In addition to posting tweets, users of Twitter can follow each other. Following others on Twitter means subscribing to their tweets as a follower. To follow a user is a unilateral action. Users can follow other users that do not follow them back.
Lists of tweets arranged in real-time order are called timeline. All users have a home timeline in which their tweets and new tweets from the people they follow appear
8 Chapter 2. A Closer Look at Twitter
in real time, as the content is created. Newest messages are at the top. Besides the timeline of tweets, the users’ profile pages display their respective number of posted tweets, number of followers, number of people they are following, a picture, a short bibliography, the user’s provided real name, and so on.
Table 2.1: Glossary of Twitter terms.
TERM DEFINITION
User Each user in Twitter has a unique username, a profile page, and a set of tweets.
Tweet Messages with 140 characters or less posted to Twitter. It appears on the sender’s profile page and in the home timeline of anyone who is following the sender.
Timestamp The time and day the tweet was posted. It appears within each tweet.
Timeline Any ordered real-time list of tweets. It appears on profile pages (the list of tweets posted by the respective user), on users’ home page (the list of tweets they have posted along with the tweets the people they follow posted), as the results of a search, and so on.
Profile page Users’ profile page contains their personal data, such as picture, real name and description. Also it contains their timeline and some quantitative data, such as follower count, following count, number of tweets posted, and so on.
To Follow To subscribe to another user’s tweets.
Follower A follower of a user is one that is subscribed to her tweets.
Friend (Following) A friend of a user is one who is followed by her.
Protected Account The tweets from protected account users are only seen by approved followers and they do not appear on searchs.
@Mention Tweets containing other user’s username, preceded by the "@" (at mark) symbol. It appears on the sender’s Profile page and in the recipient’s @Mentions tab, in Twitter home page. If the recipient is following the sender, it will also appear in the recipient’s timeline. @Mention tweets usually have the format ’<content> @username <content>’.
@Reply A tweet that begins with another user’s username and is in reply to one of their tweets. It appears on the sender’s profile page and in the recipient’s @Mentions tab, in Twitter home page. If the recipient is following the sender, it will also appear in the recipient’s timeline. @Reply tweets usually have the format ’@username <content>’.
Direct Messages Private message sent directly to another user that follows the sender. It appears only in the sender’s "Sent" folder and in the recipient’s "Direct Messages" folder. It is not public.
Retweet A Retweet happens when users share to their followers a tweet posted by another user they follow. It is the act to post again a content already published. They are usually identified by the letters "RT" in the beginning of the tweet or by a "retweet icon" in timelines.
hashtag (#) Words preceded by the # symbol, that are considered keywords or topics in a tweet. Hash-tags can occur anywhere in the tweet.
Trending Topic A Trending Topic is a immediately popular topic (identifyed by a Twitter’s algorithm). The goal is to present to people the "hottest emerging trends and topics of discussion on Twitter". It appears on the user’s profile page and also on Twitter’s landing page.
Twitter Search Twitter provides a tool, called Twitter Search, that enables querying and filtering tweets.
Twitter API The data generated in Twitter is exposed by Twitter via an Application Programming Interface (API). The goal is to enable developers to build applications for Twitter and also to permit the data analysis.
Geotagging Some tweets have a geolocation tag attached specifying where the message was posted.
2.2. Twitter’s Environment and Data 9
visible to everyone. In addition, their tweets can be searched using Twitter Search1 or retrieved using Twitter API2. On the other hand, for accounts with protected tweets, a manual approval is required for each person who may want to see the tweets. Tweets posted on these accounts are visible only for the approved ones.
Users may interact with each other via tweets in different forms, such as@Replies, @Mentions andRetweets. These forms of interaction are considered variations of a nor-mal tweet and all of them contain references to other users (their usernames preceded by an @ – at mark) in the post. These references occur in different ways and with different purposes: @Replies consists on sending tweets as reply to one user, @Men-tions consists on mentioning a user in the middle of one tweet, and Retweets consists on sending a tweet already posted by another user.
Table 2.1 serves as a glossary for future reference and summarizes some of these definitions and other Twitter terms that may be important for understanding this work. More information concerning Twitter vocabulary and definitions can be found at Twitter Help Center3.
2.2
Twitter’s Environment and Data
Twitter drew the attention of several researchers in the last years. Among the wide range of studies about the micro-blogging tool, there are both characterization- and application-focused studies about Twitter’s environment, users and data that are worth mentioning. This section summarizes the main contributions of some of these studies. Although many people may consider Twitter as a social network service, it actu-ally is not. Twitter facilitates social networking, but it does not necessarily act as a social networking website. A social network is a social structure made of nodes (ac-tors, individuals, organizations) and ties (relationships) among them [Barnes, 1954, Bornholdt and Schuster, 2003, Wasserman and Faust, 1994]. In actual online social networks, such as Facebook and Flickr4, the relation between the users (friendship) is reciprocal. When a user adds another one as a friend, both sides share this connec-tion. On the other hand, the possibilities of connections provided by Twitter are not necessarily mutual: following, mentioning and retweeting are one-way actions. For ex-ample, one may opt to receive the updates from another user without requiring mutual following from that user.
1
Twitter Search: http://search.twitter.com
2
Twitter API:http://dev.twitter.com
3
Twitter Help Center: https://support.twitter.com/groups/31-twitter-basics
4
10 Chapter 2. A Closer Look at Twitter
To study this property of Twitter, Kwak et al. [2010] analyze over 41 million user profiles and 1.47 billion follower/following relationships to conclude that only 22% of the connections are reciprocal, whereas the majority (78%) are one-way relationships. These facts highlight Twitter’s power as a content distribution platform. Users follow others seeking not only to maintain in touch with "real life" connections, but, more importantly, to get access to information and links of interest.
Still on the relationships between users, Huberman et al. [2008] define two types of public posts: direct and indirect ones. Direct posts are destined to one specific person (using an ’@’ - at mark - in front of the user’s name), whereas indirect posts do not include mentions to any other user: they are destined to everyone. Using this definition, Huberman et al. introduce the concept of a ”user’s friend” as a person to whom the user has written at least two public direct posts. Their work shows that the explicit relations between users (following relation) do not correspond to the real connections between them. The number of people with whom the users interact is way lower than the number of their connections: not every link between two people implies in a real interaction between them.
The content produced by users on Twitter is highly heterogeneous and rich. Much of what is discussed in Twitter is inspired by the news: according to Kwak et al. [2010], 85% of Twitter posts are news-related. In this context, several studies explore Twitter’s power as a real-time news source. For example, Cataldi et al. [2010], Sankaranarayanan et al. [2009], and Phelan et al. [2009] try to retrieve real-time breaking news (or emer-gent topics) from Twitter users’ posts; whereas Chen et al. [2010] propose ways of filtering Twitter stream down to items that are indeed of interest of the user. Castillo et al. [2011] assess information credibility (in the sense of believability) of news spread in Twitter. They automatically determine which topics are newsworthy and, more specifically, what their level of credibility is.
In summary, Twitter users can act as eitherproviders of news(for example dur-ing the 2009 post-election protests in Iran [Zhou et al., 2010]) or asopinion sources
about existing topics. In the former scenario, Sakaki et al. [2010] propose an algorithm for monitoring tweets for target event detection (such as an earthquake). Moreover, users’ posts usually provide good insights about the impact of news events [Math-ioudakis et al., 2010, Tsagkias et al., 2011] and also relevant information related to politics [Diakopoulos and Shamma, 2010, Golbeck and Hansen, 2011, Wigand, 2010] and for gathering market intelligence [Brown et al., 2007, Jansen et al., 2009, Kwon and Sung, 2011].
2.3. User Influence on Twitter 11
and Grier et al. [2010] tried to identify this type of behavior. Grier et al. found that Twitter has a higher incidence of users visiting spam pages than email, which may happen due to features unique to Twitter exploited by spammers. For example, mentions are used by spammers to personalize messages in an attempt to increase the likelihood of victim to follow a spam link. Retweets and trending topic hashtags are also exploited by spammers with similar objetives.
Finally, the constraints in Twitter posts (the length restriction, the variety of so-cial relation types, the complex linguistic style [Danescu-Niculescu-Mizil et al., 2011]) are actual obstacles in terms of content analysis. Therefore, sentiment classifica-tion [Guerra et al., 2011, Jiang et al., 2011, Speriosu et al., 2011, Thelwall et al., 2010] as well as text classification for information filtering [Sriram et al., 2010] specific for this environment are important research topics.
2.3
User Influence on Twitter
The target content for studying influence is user-generated, so the characteriza-tion of the authors of the tweets in terms of their general behavior is crucial for a better understanding of the data. Specifically, as aforementioned, the identification of influential users or opinion leaders is important for marketers, businesses or other people interested in general feedback [Barabasi, 2002, Berry and Keller, 2003, Chan and Misra, 1990, Gladwell, 2002, Slywotzky and Shapiro, 1993, Van den Bulte and Joshi, 2007].
In this section, we list the main characteristics of each relevant work studying user influence on Twitter and discuss our main contributions when compared to them.
2.3.1
Related Work
The report presented in [Leavitt et al., 2009] highlights interactions (replies, retweets, mentions and attributions) as markers of influence, rather than solely the number of followers. The authors select a few famous users belonging to the categories “celebrity”, “news outlet” and “social media analyst” and compare several influence indicators, such as average content spread per tweet, for each user.
12 Chapter 2. A Closer Look at Twitter
results, they compare three different algorithms (number of followers, pagerank and topic-sensitive pagerank) studying the correlation between the rank lists generated.
In Cha et al. [2010], influence is divided into three types: the in-degree influence (the number of followers that a user has), the tweet influence (the number of re-tweets containing ones name), and mention influence (the number of times a user is mentioned). The authors study the dynamics of influence across topics and time, analyzing whether users can hold significant influence over a variety of topics, and examining the rise and fall of influential users over time.
Based on the concept that influence is measured by the replication of already performed actions, Goyal et al. [2010] propose a technique for constructing influence probability graphs from social networks (friendship graph) and action logs. From these two sources of data, the authors build a propagation graph (in which nodes are the users who perform the actions and edges represent the direction of the propagation), apply models of influence (static, discrete and continuous time) and finally construct the graph of influence probabilities. Both Goyal et al. [2010] and Lee et al. [2010a] emphasize the temporal aspect of influence detection, which is indicated as future work of this dissertation.
In Bakshy et al. [2011], the authors measure influence based on the user’s ability to spread brand new content. Given a propagation path traced from the user that created the content (URL) to the last user that received it, they identify the users who are nearer to the origin as the most influent. The attributes considered for the calculation of influence are: the number of followers, number of followings, number of tweets posted and date the user joined Twitter. The authors also analyzed the content of the links posted, observing the average cascade size for different interest ratings, types and categories of posts.
friend-of-a-2.3. User Influence on Twitter 13
friend influence) and topic-specific influence. They conduct experiments on Twitter, Digg and Cora (a citation network), aiming to evaluate the influence strength predic-tion, the user behavior prediction and the topic-level influence model.
Pal and Counts [2011] address the problem of finding topical authorities in micro-blogs. They list some metrics of potential authorities and group them in higher level indicators, which consider the authors’ level of involvement in the topic, the originality of their tweets, their conversational level, the impact of the content the author gen-erates, their information diffusion and so on. Pal et al. use a probabilistic clustering over the feature set and within-cluster ranking procedure to generate a final list of important authors for one topic. They explore three different topics (extracted, using keyword matching, from all tweets posted in a 5-day interval), comparing their method with three baselines (one that uses graph properties, other that uses textual properties and a third that randomly selects non-important authors). They manually evaluate the ranks generated by each aforementioned options. One interesting metric used in that paper is the self-similarity score, which reflects how many users borrow words from their own previous posts (concerning or not the topic).
Finally, academic researchers are not the only ones to study user influence. Klout5 is a tool that measures influence online. It provides a way to measure influence on Twitter using a score also called Klout, with a range is from 0 to 100. Light users score below 20, regular users around 30, and celebrities start around 75. Klout defines influence based in three concepts: True Reach (size of the audience of a user – true followers count, total of retweets, mentions and lists in which the user is included); Amplification Probability (chance that the published content will spread – interaction between users and their followers, ratio between the number of retweets and the number of followers); and Network Influence (analysis of the audience influence considering the interaction between the followers). Even though some may question the meaning of Klout Score [Braunstein, 2011] and there is no clear explanation of how the score is calculated, it is broadly known and used [Ishida, 2011].
2.3.2
Our Work
Our contributions in this work stand out from previous work in key aspects. First, our proposed method, SaID, considers more complete metrics for measuring the repercus-sion of users’ actions: we evaluate features of users within an interaction network that captures all the conversations about a topic. Second, we are the first to apply a tweet content quality analysis: our hypothesis is that users who want to influence others tend
5
14 Chapter 2. A Closer Look at Twitter
to produce better written and more understandable tweets. Also, we evaluate the com-mitment of the users with the topic, that is, if they have a positive or negatively biased content and with what frequency they post about the subject. This allows our method to identify the potential evangelists and detractors concerning the topic. Finally, no previous work has evaluated their proposed method using a specialists’ ground truth. Instead of generating various ranked lists and simply comparing them, we validate our technique based on marketing and communication specialists’ point of view and on an evaluation pool.
2.4
Concluding Remarks
In this Chapter we addressed the characteristics of Twitter, a modern and trendy online environment, that can be seen as a large information network. In this environment, diverse types of users post short length messages (called tweets) concerning various matters, that go from personal comments to breaking news.
It did not take long for businesses to realize that Twitter is a valuable tool for connecting to customers in a real-time basis. By engaging on this environment, en-trepreneurs are able to gather market intelligence, feedback, build relationships with customers and partners as well as react properly to negative word-of-mouth. However, given the vast amount of tweets per day, even for a specific subject, sometimes it is im-practical (and not strategical at all) to analyze the whole data. In order to save time (and resources) it is critical for the businesses to find opinion leaders, or influential users, who drive the conversations about the topic.
Chapter 3
Sentiment-Based Influence
Detection
In this chapter, we explicitly define what are the characteristics of the users that we consider influential and how these features may be measured on Twitter (Section 3.1). Furthermore, we present SaID, our Sentiment-based Influence Detection method, which is based on (1) the definition of a topic of interest, (2) a crawling of the correspondent tweets, (3) the identification of the profiles, (4) the sentiment classification, interaction parsing and content analysis of the gathered data and (5) the extraction of features for associating an influence score to each user. Specifically, we discuss SaID’s three phases: pre-processing (Section 3.3); feature extraction (Section 3.4) and calculation of the influence score (Section 3.5).
3.1
What is influence and how to measure it on
Twitter?
Given Twitter power as an intelligence source for branding strategy [Jansen et al., 2009] and the importance of uncovering the key influential users [Goyal et al., 2010, Pal and Counts, 2011, Weng et al., 2010], our first challenge was to define the characteristics of an influential user on Twitter.
The terminfluencecomes from Latin influens, present participle of influere: to flow in. It means, according to Merriam Webster, “the act or power of producing an effect without apparent exertion of force or direct exercise of command” or “the power or capacity of causing an effect in indirect or intangible ways”.
In word of mouth environments, this effect flows from opinion leaders [Katz
16 Chapter 3. Sentiment-Based Influence Detection
Table 3.1: Characteristics of Influential Users.
Characteristic How we measure it
Their actions imply in other persons’ actions.
This point is directly derived from the basic definition of influence (by Merriam Webster) and opinion leaders (by Chan and Misra [1990] and Katz et al. [1955]). A influential user is usually the one whose actions cause effect on others.
We measure this characteristic by analyzing mentions, replies and retweets of a user contextualized on the topic of matter (Relation Fea-tures, Section 3.4.1).
They act like bridges on interactions about a subject.
To maintain a leadership role on a topic, the user has to be a part of the active public, of the active discus-sion [Chan and Misra, 1990]. Moreover, since they gen-erate buzz around their posts [Lazarsfeld et al., 1948, Slywotzky and Shapiro, 1993], they act like bridges on interactions, that is: they are central in the discussions.
We evaluate the user position on both connection (follower-following) and interaction (mention, reply, retweet) networks. Users that are more central, play a more important role in the network. (Relation Fea-tures, Section 3.4.1).
They have a positive or negative bias on their opinion.
Several insights can be extracted by analyzing a polar-ized content [Arndt, 1967, Chevalier and Mayzlin, 2006, Diakopoulos and Shamma, 2010, Kwon and Sung, 2011, Mizerski, 1982, O’Connor and Balasubramanyan, 2010] and, specially for marketing strategy, the management of positive and negative feedback is important. By target-ing negatively influent users, marketers can react prop-erly, leveraging less resources [Slywotzky and Shapiro, 1993].
For each Twitter user, we analyze the sentiment of each tweet and the overall user polarity. (Polarity Fea-tures, Section 3.4.2).
Produces a content with a minimum quality.
Byminimum quality, we mean well structured sentences, with the intention of presenting an idea, usually with a source (URL) [Weng et al., 2010]. Influential users are not occasionally talking about the topic, they have a purpose for posting content. Furthermore, there is indi-cation of a positive correlation between opinion leaders and a higher level of education [Chan and Misra, 1990, Robertson and Myers, 1969].
We evaluate the content generated by each user on Twitter. We an-alyze the readability features, and the presence of the user on the topic (amount of tweets on the subject). (Content Features, Section 3.4.3).
3.2. SaID Overview 17
Most of the studies that discuss influential users on Twitter [Bakshy et al., 2011, Cha et al., 2010, Leavitt et al., 2009, Liu et al., 2010, Pal and Counts, 2011, Romero et al., 2011, Weng et al., 2010] propose a definition of influence based on user content diffusion. Bakshy et al. [2011] and Romero et al. [2011] study influence as the ability of the user to post (as a seed) URLs which diffuse through the Twitter follower graph; Cha et al. [2010] focus on users’ potential to lead others to engage in a certain act, their size of audience and their amount of content with pass-along value; Weng et al. [2010] say that the influence of users on their followers is based on the relative amount of content the followers receive from them. Finally, Pal and Counts [2011] consider the level of involvement of the user with the topic and how much the author is mentioned with regards to the topic of interest as the most important features to evaluate a influential user.
In this dissertation, we try to refine the definition of influence on Twitter, fo-cusing on a marketing and consumer point of view [Kwon and Sung, 2011]. Table 3.1 introduces each of the key points of our definition as well as our way of measuring each corresponding characteristic on Twitter.
3.2
SaID Overview
In this dissertation, we present a method called SaID (Sentiment-based Influence
Detection on Twitter) for identifying influential users on Twitter, which relies on the aforementioned characteristics.
Figure 3.1 shows an overview of the proposed method. Our method is divided into three main phases: pre-processing, feature extraction and influence score. The
18 Chapter 3. Sentiment-Based Influence Detection
first phase (I) consists on topic and query definitions, crawling the tweets, filtering the content, user identification and data extraction. The second phase (II) corresponds to the processing of the metrics: SaID parses the content, the interactions and connections between the users and analyze the sentiment of the tweets. At the end of this phase there are metrics associated with three groups of features: the ones related tocontent,
relationandpolarity. Finally, in the third phase (III), SaID combines these metrics into a single influence score.
Each of these phases are described next: Section 3.3 presents the pre-processing phase, Section 3.4 defines the features (and explains their extraction) and Section 3.5 describes how the separate features are combined into one influence score.
3.3
Pre-processing
The pre-processing phase consists of four steps. The first one is determining the topic and time interval of the desired content; the second is crawling; the third one is the tweet filtering and storage; and the fourth is the extraction of user data. This section describes each one of them.
3.3.1
Topic and time interval definition
In the marketing environment (considering business owners, investors and advertising agencies, for example) the interest is usually directed to a topic-restricted analysis of influence rather than a global one. For example, an important biologist is possibly not as influent as a politics-engaged user when it comes to discussing this year’s election.
Under those circumstances, this work evaluates users’ influence factors consid-ering topic-related scenarios. Thus, the first step in the pre-processing phase is to determine which topic is going to be analyzed and for how long. It may be a brand, a product, a personality, an event, and so on. Based on the chosen topic, keyword-based queries are built.
Table 3.2 shows examples of the keywords-based queries used for some of the datasets evaluated in Chapter 4. It is important to notice that some knowledge about the topic of interest is required in order to produce a good query. In the case of brastemp (an appliance brand), the name of a line of products (allblack) was included as keyword, in order to improve the recall of relevant results.
3.3. Pre-processing 19
Table 3.2: Example of queries.
Topic Keyword-based query
brastemp brastempORallblackORbgourmet OR(inverse AND(geladeiraORfreezer))
carrefour carrefourORcarrefourbrasilORcarrefourcombrOR#carrefurtoORcarrefourfail
may be as wide as desired, but has to be defined. As future work, we address SaID’s capability of adapting the user Influence Score over time.
3.3.2
Crawling
For collecting the data concerning the chosen topic, we use the Twitter Search API, a dedicated API for running searches against the real-time index of recent tweets. The Search API is not a complete index of all tweets, but instead an index of recent Tweets. Due to resource constraints, the results are focused in relevance and not completeness. That means that some tweets and users may be missing from search results.
We have built a crawling module, that uses Twitter Search API for collecting tweets, publicly available from the user’s timeline, which contains the defined keywords. Since Twitter Search API cannot be used to collect tweets older than a week, our crawler does real-time requests, during the desired time interval. Before storing the retrieved tweets in our database, we analyze its validity, as described in the next step.
3.3.3
Tweet filtering and storage
Once the content is retrieved from Twitter, we carefully eliminate occasional spams and tweets that fit into the keyword search, but in a different context. For example, on a search with the keyword “house”, there may be tweets concerning “house”, the human habitat, or “House”, the TV series. This process was conducted manually. After this filtering, the remaining tweets are stored.
3.3.4
User Data Extraction
20 Chapter 3. Sentiment-Based Influence Detection
3.4
Feature Extraction
The second phase is the actual influence analysis, in whichrelation,polarity andcontent features of the user are extracted, as explained next.
3.4.1
Relation Features
We assume that the level of influence of users is directly associated with their social re-lation with other users in the same topic context. Thus, the set ofrelation featurestries to capture the user role among the others, in terms of follower-following connections and interactions via tweets, as described next.
On follower and following relations
The early studies examining influence on Twitter used to confound influence and pop-ularity, by measuring the level of influence of users by their number of followers. Ac-cording to the results presented in previous work [Cha et al., 2010, Huberman et al., 2008, Weng et al., 2010], the number of followers and followees of users is not the pre-ferred way to measure influence, because most of the users’ followers do not even read or process the received posts.
However, the ratio of followers to followees, Twitter Follower-Followee Ratio (tff), may be useful as an influence indicator, because it can communicate the intended purpose of a user [Krishnamurthy et al., 2008, Leavitt et al., 2009]. According to Krishnamurthy et al. [2008] and Leavitt et al. [2009], if the ratio approaches infinity (↑ followers, ↓ following), the user is likely to be a “broadcaster”, such as news media profiles, celebrities or other popular users. On the other hand, if the ratio approaches 1 (followers≃followees), the users have reciprocity on their connections. This describes the most common types of user. Finally, if the ratio approaches zero (↓ followers, ↑
followees), the user might be categorized as a spammer or a robot, which follows way more users than is followed by (people do not usually follow back spammers/robots).
3.4. Feature Extraction 21
(a) Reply.
(b) Retweet.
(c) Mention.
(d) Attribution.
Figure 3.2: Example of each interaction via tweets.
Interactions via Tweets
Previous work [Huberman et al., 2008] has shown that the number of people with whom users truly interact is inferior when compared to the number of their explicit follower-following connections: not every link between two people implies in a real interaction between them. Thus, in order to truly understand the relation between users, we analyze the interactions that occur via tweets.
It is very common for a user to interact with others via tweets by using the “@” notation prefacing their username. For example, on the tweet “@cacobart imagine if it was raining coke, you’d love it” the author interacts with the user @cacobart.
We acknowledge four types of possible interactions via tweets: replies, retweets, mentions and attribution. A reply corresponds to a situation in which one user wants to answer a post from another one or simply direct the message to someone else. For example, a tweet of user A in reply to user B would be a post like “@B [content of the tweet]”. A retweet is used to propagate a message: A retweets B means that
22 Chapter 3. Sentiment-Based Influence Detection
retweet identification. Finally, amention is a tweet that contains another user in the middle of the text (e.g. “[content] @A [content]”) and an attribution is similar to a retweet, except that it cites the username using the notation “(via @B)” instead of “RT @B”. We parse each gathered tweet and store all the interactions between users that discuss the topic for further analysis. Table 3.2 shows examples of each type of interaction.
Complex Network Approach
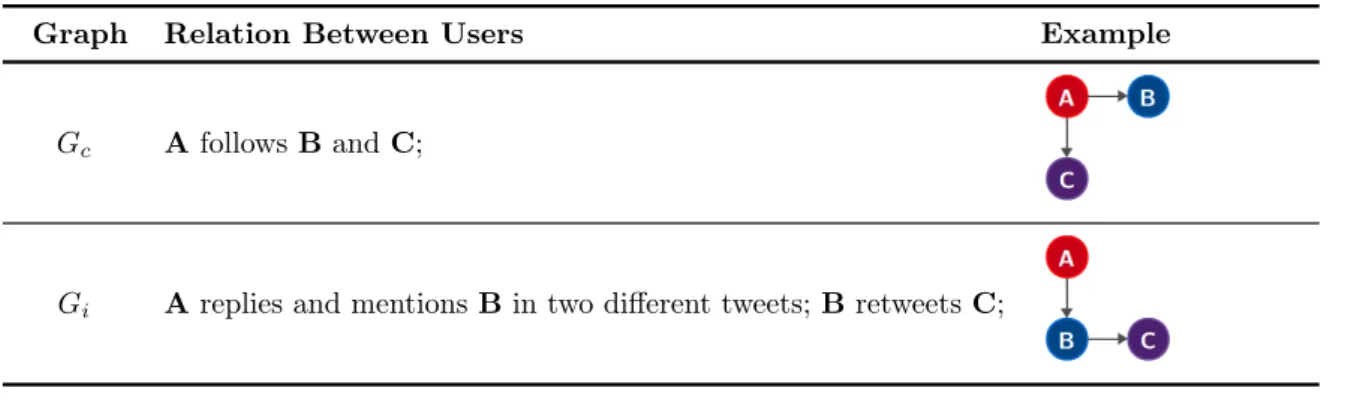
Next, in order to extract other metrics for characterizing the roles of users on Twitter and identify the influential ones, we adopt a complex network approach. From the several networks that naturally emerge from user relations enabled by Twitter features, we select two of them for an in-depth analysis: the Connection Graph (Gc) and the Interaction Graph (Gi). Formally, the networks are defined as follows.
Definition 1 Connection Graph. For a given subset of users involved in a specific theme, let (Gc, U) be the user directed unweighted graph, where (u1, u2) is a directed arc in U if user u1 ∈ Gc follows user u2 ∈ Gc.
Definition 2 Interaction Graph. For a given subset of users involved in a specific theme, let (Gi, U) be the user directed unweighted graph, where (u1, u2) is a directed arc in U if user u1 ∈ Gi has cited at least once (i.e., mention, reply or re-tweet) user
u2 ∈ Gi.
Intuitively, the first network captures the declared connections between users (following-follower relation) whereas the second one captures the user interactions via tweets. Table 3.3 illustrates the construction of both graphs. Note that both graphs are unweighted, so the number of times a pair of users has interacted is not represented on them.
Table 3.3: Construction of Connection and Interaction Graphs.
Graph Relation Between Users Example
Gc AfollowsBandC;
3.4. Feature Extraction 23
Different measures for networks analysis could be exploited (such as shortest paths, distance, component connectivity, clustering, clique, among others [Costa et. al, 2007]). The measurements that make more sense for influence estimation are those based on centrality (defined on the vertices of a graph), because these metrics are designed to rank the notoriety of users according to their position in the network.
Similarly, influential users have to be well connected to other users, and play a central role in the graph in which they is embedded. For that matter, two centrality measures were chosen. We also analyze the in-degree of the users1, as follows.
• Betweenness centrality (bc) is the first centrality measure and is defined by the fraction of shortest paths between node pairs that pass through the node of interest [Brandes, 2008]. In both graphs Gi and Gc, users with high betweenness have an important role in the information dissemination process, since they act as bridges for the data flow.
• The centrality measure Eigenvector centrality (ec)[Bonacich, 2007, Ruhnau, 2000] considers that users are more central if they are related to users that are themselves central. Thus, the centrality of some node does not only depend on the number of its adjacent nodes, but also on their value of centrality. It is important to remark that Eigenvector centrality is an algorithm similar to Pagerank, applied to social networks [Chen et al., 2007]. We use this metric to rank higher users that are related to many other users or with a few users that are related to lots of other users.
• The In-degree (id) of each user is a key characteristic of the structure of a directed network. In the Interaction Graph, the in-degree measures the number of times a user was cited or had her tweets replied or retweeted, whereas in the Connection Graph, the in-degree stands out for the number of users within the topic that follows the user in focus.
It is important to emphasize that, in the Connection Graph, the in and out -degrees of the users are different from the following and follower counts that appear on their profile, because the degree concerns the connections between the users within the collected dataset.
1
24 Chapter 3. Sentiment-Based Influence Detection
Combined Metric for Relation Features
From an influence detection point of view, the most influential user for a topic is the one with the higher value for each of the four aforementioned metrics (tf f, bc, ec,
id). For this reason, the metrics were combined in an arithmetic mean (as shown in Equation 3.1).
urelation = (bc+ec+id+tf f)/4 (3.1)
In order to combine the metrics equally, they were normalized individually to a [0,1] scale [Jain, 1991]. Specifically, we did a Range Normalization [Jain, 1991], in which the range is changed from [xmin, xmax] to[0,1]. The scaling formula is:
x′ i =
xi−xmin
xmax−xmin
,
where{x1, x2, . . . , xm} are the measured values and x′i the scaled value corresponding toxi.
The result urelation is also in this range. Due to the broad distribution of cen-trality measure values, the normalization ofecand bcwas calculated using logarithmic quantities.
3.4.2
Polarity Features
The next perspective of our influence study corresponds to the author’s polarity. This sentiment analysis allows the detection of engagement of the users towards the defined topic and, consequently, leads to identifying users who are well connected regarding interactions and responsible for influencing others’ decisions due to the polarity of their tweets. Furthermore, in a “crisis management” point of view, recognizing the users who lead the positive and, mainly, the negative information flow is essential. The steps for extracting the user overall polarity on a given topic are described next.
Tweet Sentiment
3.4. Feature Extraction 25
(a) (b)
(c) (d)
Figure 3.3: Example of positive tweets about Paypal.
(a) (b)
(c) (d)
Figure 3.4: Example of negative tweets about Paypal.
26 Chapter 3. Sentiment-Based Influence Detection
(a) (b)
(c) (d)
Figure 3.5: Example of neutral tweets about Paypal.
Manual and Automatic Analysis
In this work, we employ two approaches for analyzing the tweets and evaluating our results: a manual and an automatic one. The goal to cover both types of analysis is to evaluate the potential of the influence detection method (using the manual analysis) and the impact of using automatic sentiment classification in comparison.
In the manual approach, tweets were manually classified by a marketing analysts’ team, in a process in which each tweet’s sentiment was verified at least by two analysts and a supervisor. In case of disagreement, the supervisor’s decision was taken into account.
For the automatic approach, we employed a supervised classification, that is, a manual categorization is performed only for a set of tweets, used as training for a machine learning algorithm. The chosen algorithm was Support Vector Machine (SVM), a state-of-the-art classifier [Joachims, 1998, Vapnik, 1995].
Combined Metric for Polarity Features
Based on the classification of tweets, we calculate the overall polarity of the users, i.e., their overall contribution to the topic discussion. If users post mostly positive-biased content, they are considered as potential evangelists. On the other hand, if they post mostly negative-biased content, they may be potential detractors. Users that do not have a biased content are considered neutral.
3.4. Feature Extraction 27
user, the polarity value is the summation of the sentiment of all tweets of the user, as shown in Equation 3.2 In the formula, ti is the ith tweet (of nu total tweets) of user
u and w+, wo and w− are the weights associated with positive, neutral and negative tweets, respectively. The weight is used for balancing the sentiments.
upolarity = i≤nu
X
i=1
ti, where: ti =
w+ if ti is positive
wo if ti is neutral
w− if ti is negative
(3.2)
For instance, one may want to increase the weight of negative tweets to highlight detractors. Also, one may argue that if users made the effort to write a non-negative tweet on the topic, they are positively contributing to the spread of news about the subject, thus neutral and positive tweets could be considered as equivalent.
In this dissertation, following the specialists’ instructions, we considered that there are three classes of tweet sentiment and that the neutral ones contribute (with lower intensity) to the user’s positive polarity, by using the weights:
w+ = +2
wo = +1
w− =−2
Similarly to the network perspective, the polarity values were range normalized. Positive and negative values were normalized separately: positive values to [0,1] and negative values to[−1,0]. The normalization was calculated using logarithmic quanti-ties.
3.4.3
Content Features
Finally, a lot can be extracted from the content a user publishes. In this perspective, we analyze the content of the tweet itself and what it may indicate about the user characteristics and intentions.
Tweet Readability
28 Chapter 3. Sentiment-Based Influence Detection
For that matter, each tweet is evaluated using the Flesch-Kincaid Grade Level metric [Ressler, 1993] (kincaid), which was designed to indicate comprehension diffi-culty when reading a passage of contemporary academic English. This metric, success-fully applied in the identification of high-quality Wikipedia articles [Dalip et.al, 2009], increased the accuracy of the influential identification for some cases, as studied in the experiments in Chapter 4.
For each tweet, it computes the average number of syllables per word and the average sentence length – see Equation 3.3. For instance, a tweet like “aaaaaaa haaate justin bieber!" has a low quality value, whereas “PayPal is dangerously easy." a high one. Even though the readability metrics are not expected to work flawlessly for the short sized and noisy content of tweets, the results show that the metric helps eliminating undesirable content.
kincaid= 0.39∗ words
sentences+ 11.8∗
syllables
words −15.59 (3.3)
For calculating this metric, we used the packageStyle and Diction2.
Combined Metric for Content Features
The user quality perspective was determined as the average of the Kincaid metric computed for each tweet of the user, as defined in Equation 3.4.
ucontent = i≤nu
X
i=1
kincaidi× 1
nu
(3.4)
3.5
Influence Score
So far, we have presented different types of information that can help characterizing Twitter users, divided into three perspectives: relation, polarity and content. By exploiting them together, we aim to assign a single value (influence score) to each user in order to obtain a final (and possibly better) user rank.
The obvious intuition is to build a formula that combines the three feature sets. The user influence score (Iscore) is given by Equation 3.5, which, by the way, is one of the main contributions of this work.
Iscore =
α∗upolarity +ϕ∗(β∗urelation+γ∗ucontent)
α+β+γ (3.5)
where:
2
3.6. Concluding Remarks 29
upolarity, urelation, ucontent are the normalized polarity, relation and content perspec-tives;
α, β, γ are constants, greater or equal to zero, that weight each of the three perspec-tives; and
ϕ = upolarity |upolarity| .
As mentioned before, both relation and content perspective values were normal-ized to fit into the range [0,1], whereas the polarity perspective values fit into [−1,1]. The auxiliary variableϕadjusts both relation and content perspectives according to the polarity result. If a user has a polarity equal to zero, the result of the equation is zero (regardless of the other features). Also, if the polarity is negative, both relation and content have their signal changed. The resulting influence score, for each user, is in the range[−1,1]. By sorting the users in descending order, the top ones, withIscore >0, are evangelists or neutral users and the bottom ones, with Iscore <0, detractors.
The idea behind combining different perspectives into a single influence score is that a feature alone may not be enough to characterize whether a user is influent or not, whereas the combination of the features may be. A user who is well positioned in the graph, has a biased opinion, and writes fairly well written tweets should be ranked higher as an influential user. The formula eliminates types of profiles that are erroneously appointed as influent. For example: (i) someone that is well connected to other users, but does not have a biased opinion about the subject; (ii) someone that posts, daily, hundreds of positive/negative tweets about the topic, but, for some reason, no one pays any attention to; (iii) a person whose content is too noisy and does not have a persuasive speech. For the specific cases listed above, the low values of polarity (i), relation (ii) and content (iii), respectively, do keep those users from being considered as influent.
3.6
Concluding Remarks
In this Chapter we have defined influential users for a topic as those responsible for producing an effect on other users. Particularly, their actions imply in other persons’ actions; they act like bridges on the interactions about the topic; they have the inten-tion of persuading the others positive or negatively; and they produce content with a minimum expected readability.
30 Chapter 3. Sentiment-Based Influence Detection
Chapter 4
Experiments with Manual
Assessment of Tweets’ Sentiment
This chapter presents the experimental validation of SaID considering first a manual assessement of the sentiment of the tweets. A fully automatic approach is evaluated in Chapter 5.
We start this Chapter by describing the datasets built for influential detection purposes (Section 4.1). Then, we discuss statistics of the collections, the classification of their tweets and the influential users used as ground truth. Next, we list the metrics employed when evaluating SaID and details about the implemented baselines (Sec-tion 4.2). The following Sec(Sec-tions discuss the actual experiments, divided into three parts. The first part compares the performance of SaID using the different graphs: Connection and Interaction (Section 4.3). We evaluate both approaches comparing their effectiveness on detecting the influential users. We also measure the execution time for calculating each network metric for both approaches. In the second part, we analyze the impact of each individual perspective (polarity, relation and content) on our method (Section 4.4). Furthermore, we present an approach for optimizing the Influence Factor of each user. Finally, the third part presents a comparison of SaID results against different baselines (Section 4.5).
4.1
Datasets
There is no established benchmark for evaluating user influence detection on Twitter. So, a major effort in this work was to build such datasets. Although expensive and demanding, this process is essential for the experimental validation presented in this Chapter. In the present Section, we describe each dataset and their characteristics.