Submitted9 June 2016 Accepted 7 October 2016 Published21 December 2016 Corresponding author
Zhiyong Wang, [email protected], [email protected]
Academic editor María Ángeles Esteban
Additional Information and Declarations can be found on page 17
DOI10.7717/peerj.2664 Copyright
2016 Xiao et al.
Distributed under
Creative Commons CC-BY 4.0 OPEN ACCESS
Whole-genome single-nucleotide
polymorphism (SNP) marker discovery
and association analysis with the
eicosapentaenoic acid (EPA) and
docosahexaenoic acid (DHA) content in
Larimichthys crocea
Shijun Xiao, Panpan Wang, Linsong Dong, Yaguang Zhang, Zhaofang Han, Qiurong Wang and Zhiyong Wang
Fisheries College, Jimei University, Xiamen, Fujian, China
ABSTRACT
Whole-genome single-nucleotide polymorphism (SNP) markers are valuable genetic resources for the association and conservation studies. Genome-wide SNP development in many teleost species are still challenging because of the genome complexity and the cost of re-sequencing. Genotyping-By-Sequencing (GBS) provided an efficient reduced representative method to squeeze cost for SNP detection; however, most of recent GBS applications were reported on plant organisms. In this work, we used anEcoRI-NlaIII based GBS protocol to teleost large yellow croaker, an important commercial fish in China and East-Asia, and reported the first whole-genome SNP development for the species. 69,845 high quality SNP markers that evenly distributed along genome were detected in at least 80% of 500 individuals. Nearly 95% randomly selected genotypes were successfully validated by Sequenom MassARRAY assay. The association studies with the muscle eicosapentaenoic acid (EPA) and docosahexaenoic acid (DHA) content discovered 39 significant SNP markers, contributing as high up to ∼63% genetic variance that explained by all markers. Functional genes that involved in fat digestion and absorption pathway were identified, such asAPOB,CRATandOSBPL10. Notably, PPT2Gene, previously identified in the association study of the plasma n-3 and n-6 polyunsaturated fatty acid level in human, was re-discovered in large yellow croaker. Our study verified thatEcoRI-NlaIII based GBS could produce quality SNP markers in a cost-efficient manner in teleost genome. The developed SNP markers and the EPA and DHA associated SNP loci provided invaluable resources for the population structure, conservation genetics and genomic selection of large yellow croaker and other fish organisms.
SubjectsAquaculture, Fisheries and Fish Science, Biodiversity, Genomics
INTRODUCTION
Whole-genome single nucleotide polymorphism (SNP) is one of the most important genomic resources for population diversity, conservation genetics and functional gene identification for biological traits (Seeb et al., 2011). To obtain the molecular markers of the shared genomic loci among individuals, many technologies were invented and developed to probe whole-genome polymorphisms. The techniques allowing synthesizing DNA probes in chips have led to the advent and application of SNP microarrays (Lipshutz et al., 1999), making it possible to explore genome-wide SNP in a high-throughput manner. However the cost of array design and application obstructs the wider usage in non-model species, especially for endangered and economic organisms (De Donato et al., 2013). More importantly, microarray approaches cannot discover novel SNP loci for species without reference sequences (Popova et al., 2013). With the development of next-generation sequencing (NGS), the state-of-art sequencing platform enable scientists to scan small variants in genomes at an unprecedentedly scale with rapidly decreasing price. The multiplex library strategies were widely used to further reduce the cost per sample. However, the budget is still one of the biggest challenges for whole-genome resequencing in non-model samples (Muir et al., 2016). Furthermore, the whole-genome sequencing data for hundreds of individuals also inevitably burdens the limited computational and bioinformatics capacity in labs.
Teleost, representing a large portion of fish species, has been showed to undergo the third round of whole-genome duplication (WGD) 370 million years ago (Braasch et al., 2016;Xiao et al., 2015b). The extra WGD left a large portion of duplicated and repetitive sequences in teleost genomes (Berthelot et al., 2014;Jaillon et al., 2004), making the accurate whole-genome SNP marker development was still challenging in many teleost species (Wang et al., 2008). We speculated that GBS technique provided an efficient way and was suitable for genotyping in teleost complex genome. However, the whole-genome SNP development and association studies based on GBS is rarely reported on teleost fish species. Large yellow croaker (Larimichthys crocea), belonging to the Sciaenidae family of teleost, is an important marine fish in China and East Asia (Xiao et al., 2015a). Due to over-fishing and habitat degradation in last decades, the wild stock of the species has rapidly collapsed (Liu, Mitch-eson & Sadovy, 2008). The environmental changes and over-dense aquaculture pose more challenges on population conservation and sustainable development of the aquaculture for large yellow croaker. Whole-genome molecular markers and genome-wide association studies (GWAS) for important traits are prerequisites for the population conservation and genomic selection of the species (Steiner et al., 2013). However, the association studies are rarely reported for large yellow croaker, largely because of the lacking of abundant stable genomic SNP markers.
GBS technique provides the potential cost-efficient way for whole-genome SNP marker development in complex teleost genome. In the present investigation, we used large yellow croaker to verify the applicability of GBS on teleost. Two restriction enzymes ofEcoRI and NlaIII based GBS protocol was developed and optimized. Massive whole-genome SNP markers were developed from the sequencing reads by bioinformatic pipelines, which were subsequently validated by Sequenom MassARRAY assay. The detected SNP markers in this work were then applied to the whole-genome association study of the muscle Eicosapen-taenoic Acid (EPA) and Docosahexaenoic Acid (DHA) content in large yellow croaker. Our study confirmed the suitability of GBS on whole-genome SNP marker development in teleost genome. The developed whole-genome SNP markers and functional genes involved in muscle EPA and DHA contents offered valuable genetic resources for conservation genetics and genomic selection of large yellow croaker.
MATERIALS AND METHODS
Ethics statementThe sample collection and experiments in the study was approved by the Animal Care and Use Committee of Fisheries College of Jimei University (Animal Ethics no. 1067).
Sample preparation and DNA extraction
Total genomic DNA was prepared in 1.5 ml microcentrifuge tubes containing 550µl TE
buffer (100 mM NaCl, 10 mM Tris, pH 8, 25 mM EDTA, 0.5% SDS and proteinase K, 0.1 mg/ml). The samples were incubated at 55 ◦C overnight and subsequently extracted twice using phenol and then phenol/chloroform (1:1) method. DNA was precipitated by adding two and a half volumes of ethanol, collected by brief centrifugation, washed twice with 70% ethanol, air dried, re-dissolved in TE buffer (10 mM Tris–HCl, 1 mM EDTA, pH 7.5). DNA concentration and quality were estimated with an ND-1000 spectrophotometer (NanoDrop, Wilmington, DE, USA) and by electrophoresis in 0.8% agarose gels with a lambda DNA standard.
In silicoenzyme assessment for GBS library construction
To assess how endonucleases influence the DNA fragment length distribution, four enzyme combinations were designed forin silicodigestion of large yellow croaker genome:
ApeKI-PstI, EcoRI-BstNI,EcoRI-NlaIII and PstI-NlaIII (NEB, Ipswich, MA, USA).
The activation and heat-inactivation temperature, location in chromosome and length distribution of all fragments were analyzed to evaluation the best performance of each enzyme combination.
GBS library construction and sequencing
The GBS libraries were constructed based on two DNA endonucleases:EcoRI (NEB, Ipswich, MA, USA) andNlaIII (NEB, Ipswich, MA, USA). A pilot GBS experiment was performed before the library construction to optimize the temperature and time parameters for yield, size distribution. Based on the pilot experiment, the GBS libraries of large yellow croaker based onEcoRI andNlaIII were constructed following the similar method in previous report (Beissinger et al., 2013). Briefly, genomic DNA (20 ng/µl) was incubated at 37◦C withEcoRI
andNlaIII, 10XCutSmartTMBuffer. The restriction reactions were heat-inactivated at 65◦C by 20 min and were kept in 8 ◦C for the following experiments. Sequencing adaptor and barcode mix, T4 DNA Ligase, 10 mM ATP and 10XCutSmartTMBuffer were incubated
at 16 ◦C for 2 h for ligation reactions. The reactions were then heat-inactivated at 65 ◦C by 20 min and the reaction systems were kept in 8 ◦C. Then, polymerase chain reactions (PCR) experiments were performed in the reaction solutions (20 µL) containing the
diluted restriction/ligation samples (4 pM, 2 µL), dNTP (each at 10 mM, 5 µL), Taq
DNA polymerase (NEB, Ipswich, MA, USA) (5 units/µL, 0.25 µL), Illumina Primers
(each at 10 µM, 1µL) and Indexing Primers (10µM, 1µL). The PCR procedure was:
95 ◦C 2 min; 15 cycle of 95 ◦C 30 s 60 ◦C 30 s, 72 ◦C 30 s; 72 ◦C 5 min and kept in 4 ◦C. The PCR products were run on a 8% polyacrylamide gel electrophoresis. Fragments of 200–300 bp were isolated using QIAGEN QIAquickR Gel Extraction Kit and diluted
for pair-end sequencing on an Illumina HiSeq 2500 sequencing platform (Illumina, Inc, San Diego, CA, USA).
Sequencing read quality control and genotyping
the digest site sequences of EcoRI and NlaIII were retained for the following quality control. Second, the overall base and read quality were accessed by FastQC. To avoid the negative influence of ambiguous bases for SNP detection, reads with more than 5% of N were removed. Then, the resulted reads were cleaned by the following steps: (1) discarding the reads that the quality lower than 20; (2) deleting 5 bp windows in reads end that the average quality smaller than 20; (3) removing read pairs if one end was shorter than 50 bp.
The cleaned reads were mapped to large yellow croaker genome by BWA 0.7.6a (Li & Durbin, 2009). The mapping was preceded by a short reads alignment with BWA-MEM algorithm. The alignment were then sorted by coordinates and duplicate marked by SortSam and MarkDuplicates programs in Picard tools 1.107 (picard.sourceforge.net), respectively. To reduce the false positives of SNP detection in this study, three processes were carried out: (1) short read mapping were re-aligned by local bases matches; (2) base Quality Score Recalibration (BQSR) was employed to adjust the accuracy of the base and mapping quality scores; (3) only reads pairs that both aligned on genome with a mapping score higher than 30 were used for SNP calling. Then, the SNP markers were detected by GATK UnifiedGenotyper utility.
SNP validation by Sequenom MassARRAY assay
Genomic DNA was extracted from dorsal fin ray tissue as the method described before. PCR amplification was performed in the reaction system (5µl total volume) containing
20 ng of genomic DNA, 0.5U HotstarTaq (Qiagen), 0.5µl 10×PCR buffer, 0.1µl dNTPs
for each nucleotide and 0.5 pmol of each primer. All PCR experiments were carried out in a PTC-100 PCR instrument (Eppendorf) with the following program: 4 min denaturation at 94 ◦C, 35 cycles of 20 s at 94 ◦C, 30 s at 56 ◦C and 1 min at 72 ◦C and a final extension at 72 ◦C for 3 min. After the PCR products were cleaned using 2
µl SAP (SEQUENOM),
the single base extension used 2µl EXTEND Mix (SEQUENOM) contained 0.94µl Extend
primer Mix, 0.041µl iPLEX enzyme and 0.2µl iPLEX termination mix and performed
with the following steps: initial denaturation at 94 ◦C for 30 s, followed by 40 cycles of 3-step amplification profile of 5 s at 94 ◦C, additional 5 cycles of 5 s at 52 ◦C and 5 s at 80 ◦C and a final extension at 72 ◦C for 3 min.The PCR product was cleaned by resin purification and then analyzed using MassARRAY Analyzer Compac (SEQUENOM) and software TYPER (SEQUENOM).
as the number of true positives divided by the number of true positives plus the number of false negatives as the following formula:
Specificity= true negative
true negative+ false positive
Sensitivity= true positive
true positive+ false negative
.
Association analysis with the muscle EPA and DHA content
From the 500 large yellow croaker population, 200 individuals were randomly selected for the muscle EPA and DHA content measurement for the following statistics and association analysis. The fat acid composition analysis followed the similar methods in previous reports (Murillo, Rao & Durant, 2014). Briefly, the total lipid was extracted from the fresh muscle tissue using the chloroform-methanol method (Folch, Lees & Sloane-Stanley, 1957). After saponification with 1 ml of 50% KOH in 15 ml ethanol, the lipid was then esterified in 80 ◦C for 20 min using 6.7% boron trifluoride (BF3) in methanol (Morita chemical industries Co., Ltd., Osaka, Japan). After making up in hexane (20 mg/ml), fatty acid methyl esters (FAME) preparations were analyzed by gas chromatography (GC). The temperature increase of 170–260 ◦C at 2 ◦C/min was set and helium was used as the carrier gas. Since the muscle contents of EPA and DHA were highly correlated, we combined those two components together in fish muscle.
Prior to the association study, pairwise clustering based on the alleles shared identical by state (IBS) between any two individuals was performed to assess the genetic relatedness. The population stratification was analyzed by multi dimensional scaling (MDS) clustering methods available in the PLINK software (Purcell et al., 2007).
With the developed SNP markers, the association analysis was performed between genotypes and measured muscle EPA and DHA content using Plink 1.07 A simple linear regression of phenotype on genotype was performed in the analysis. Markers withp-values
0.0 0.5 1.0 1.5
100 200 300 400 500 600 700 800 900 1000
fragment length (bp)
n
umber (million)
group
ApeKI_PstI
EcoRI_BstNI
EcoRI_NlaIII
PstI_NlaIII
Figure 1 Fragment length distribution by restraint enzyme combination.Note that all fragments
longer than 1 kb were accumulated in the last bar.
RESULTS
Enzyme assessment and GBS construction for large yellow croaker According to the principles of the enzyme combination design for GBS library construction, four enzyme combinations were designed for the GBS analysis of large yellow croaker genome: ApeKI-PstI,EcoRI-BstNI,EcoRI-NlaIII and PstI-NlaIII (NEB, Ipswich, MA, USA). To assess the fragment size distribution and the number of potential SNP marker developed, the public large yellow croaker draft genome sequences (Ao et al., 2015) werein
silicodigested by the four two-enzyme combinations to mimic the genomic fragmentation.
‘Method’ for details). By the assessment of the combination ofEcoRI-NlaIII, roughly 1.5 million fragments would be collected in libraries.
Library sequencing and reads mapping
GBS libraries were constructed by the two enzyme based digestion (see ‘Method’ for the details). The NGS sequencing of GBS libraries for 500 individuals generate roughly 314 Gb raw sequencing reads. To evaluate the raw data distribution among samples, we found that the majority of individuals (∼95%) had the raw sequencing reads ranged from 600 to 650 Mb, indicating the excellent sequencing uniformity among samples from library construction and sequencing. The raw reads were cleaned by HTSeq to trim low quality ends (average quality < 20) and eliminate short reads (length < 50 bp). The cleaned reads were mapped to large yellow croaker reference genome sequences (Ao et al., 2015) by BWA (Li & Durbin, 2009). To assess the quality of GBS library, the mapped reads distribution of Sample 88 along the linkage groups were illuminated as an example (Fig. S1). We found that reads were evenly covered all linkage groups of large yellow croaker, indicating an ideal representativeness of the libraries at the whole genome level. The covered loci depth distribution (Fig. S2) showed that the majority of depth ranged from 5 to 20 and extreme reads enrichment on genome local regions were successfully avoided in sequencing libraries.
SNP discovery among samples in large yellow croaker genome
50,000 40,000 30,000 20,000 10,000
marker number
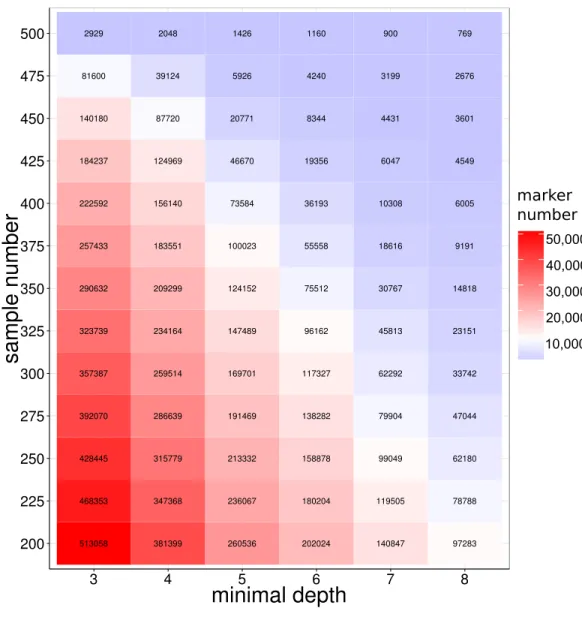
Figure 2 SNP number against sequencing depth and completeness.Note that only SNP loci witha
qual-ity score larger than 100 were used in the analysis.
sharp decreases on the number of shared SNPs for the population size from 450 to 500, which could be attributed to the samples with extremely low sequencing amount.
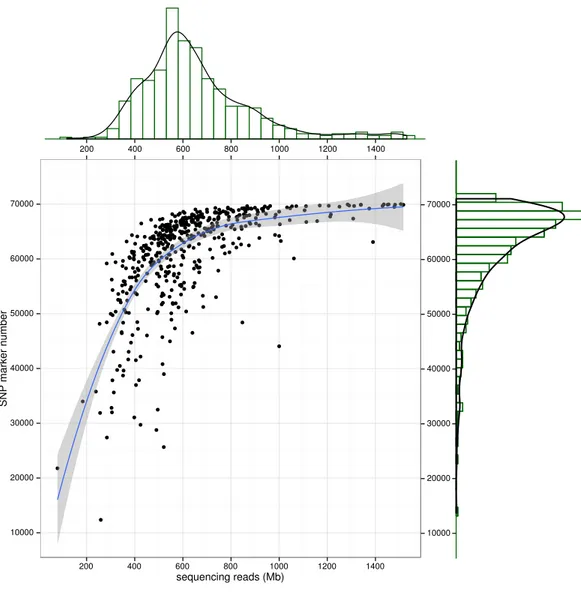
Figure 3 SNP number against sequencing amount.The distribution of sequencingamount (top) and SNP marker number (right) were plot by sides. The line in the scatter is the smoothed curve cross all sam-ples, and the grey area represent the 95% of the confidence region.
location
Figure 4 SNP distribution along chromosome.The lines along the chromosomes represent SNP loci.
The SNP location in exon, intron, UTR and intergenic regions are showed by red, blue, purple and green, respectively.
the biological functions of the hosting genes and thus influence the biological traits that controlled by those genes.
Experimental validation of detected SNP loci
To assess the reliability of the SNP makers developed from the reduced representation libraries, 50 loci from 30 individuals were randomly selected to validate the marker polymorphism by the Sequenom MassARRAY assay. As shown inTable 1, MassARRAY assay verified the most of detected SNP markers in those samples. Among 1,500 markers, 1,421 were validated by MassARRAY, confirming our library construction, sequencing and SNP marker calling pipelines. The primers for SNP validation and the detailed genotypes were listed inTables S1andS2, respectively. As shown in theTable 1, the specificity and sensitivity for the SNP genotype detection in the present study were estimated as 94.2% and 98.3%, respectively. Notably, we found that the majority of discordant genotypes were het-erozygous, which was consistent with the reports for other organisms (Sonah et al., 2013). We attributed the error-prone genotypes in heterozygous markers to the fact that those markers need more supporting reads than their homozygous counterparts. However, the Sequenom MassARRAY assay still successfully validated∼95% of the detected SNP marker developed by the GBS library sequencing, providing us solid SNP genotypes of the following trait association and other genetics studies for large yellow croaker.
The association study with the muscle EPA and DHA content
● ● ● ● ● ● ● ● ● ● ● ● ● ● ● ● ● ● ● ● INTRAGENIC CODON_CHANGE_PLUS_CODON_INSERTION SYNONYMOUS_STOP CODON_CHANGE_PLUS_CODON_DELETION STOP_LOST CODON_INSERTION CODON_DELETION SPLICE_SITE_REGION CODON_CHANGE STOP_GAINED FRAME_SHIFT START_GAINED SYNONYMOUS_CODING NON_SYNONYMOUS_CODING UPSTREAM UTR_5_PRIME UTR_3_PRIME DOWNSTREAM INTRON INTERGENIC 100 10000
number
SNP functional impacts
Figure 5 Biological impact annotations of high quality SNP markers that shared by at least 80% of the
population with 500 large yellow croakers.
Table 1 SNP validation by Sequenom MassARRAY assay.NNs indicate the failed genotypes during the
SNP filtering.
Genotypes Sequenom MassARRAY assay
AA AB BB NN
AA 901 0 2 0
AB 54 404 7 0
BB 0 2 116 0
SNP calling
NN 11 1 2 0
test) with an average of 21.5 mg/g and a standard deviation of 4.1 mg/g (Fig. S3). The difference of the highest and the lowest EPA and DHA contents was∼13.8 mg/g.
(A)
(B)
(C)
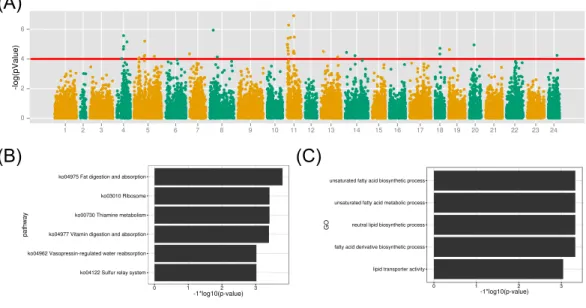
Figure 6 GWAS analysis on the muscle EPA and DHA content and the functional analysis therelated
protein-coding genes.(A) The association results were illuminated in the Manhattan plot. The red line is thep-value threshold for significant markers; (B) KEGG pathway enrichment of functional genes; (C) GO term enrichment of related biological functions for the associated genes.
dimension value (arbitrary value) were all smaller than 0.05, indicating homogeneous geno-types among samples. The association study of SNP marker with the muscle EPA and DHA content was performed with the linear model with a covariance to sex in Plink (Purcell et al., 2007). 69,845 SNP loci developed above with depth threshold of 5 were used to perform the association study (Fig. 5). As shown inFig. 6, 39 markers from 11 linkage groups were exhibited significant association with the EPA and DHA content (p-value < 1e–4). Notably, many associated markers were significant by clusters in linkage group 4, 5 and 11, suggesting the credibility of the association studies. The results might also imply that many genes contributed to the muscle EPA and DHA levels in large yellow croaker. With the variance estimation by Restricted Maximum Likelihood (REML) method (Smith & Graser, 1986), we found that those 39 significant markers could interpret as high up to∼63.0% of genetic variance explained by all 69,845 markers.
(CRAT) and oxysterol binding protein 10 (OSBPL10).APOBis a crucial lipid transport protein in organism. Previous nutriology studies confirmed the correlation of EPA and DHA contents with APOB genotypes and gene expression (Anil, 2007). Given their close relationship, we speculated that the polymorphisms on APOBgene might contribute to the EPA and DAH accumulation in large yellow croaker muscle.CRAT andOSBPL10 may also involved in the muscle EPA and DHA content since carnitine and oxysterol were important components and regulators in EPA and DHA synthesis pathways according to previous reports (Qiu, 2003;Rise, Marangoni & Galli, 2002). Notably, we observed palmitoyl-protein thioesteraes 2 (PPT2) (around a maker with ap-value of 6.7e−06) as a potential functional gene contributing to muscle EPA and DHA contents.PPT2gene was also identified by genome-wide association study on n-3 and n-6 polyunsaturated fatty acid levels in Chinese and European-ancestry populations (Dorajoo et al., 2015;Hu et al., 2016).
DISCUSSIONS
The advent and development of NGS have unprecedentedly prompted the application of the whole-genome marker development (Seeb et al., 2011). Recently, SNP developments on ge-nomic level were performed in many species, including livestock and fish in agriculture (Sun et al., 2014). However, the cost for whole-genome re-sequencing is still one of the largest challenges in genomic marker developments. Based on NGS, GBS generally used multiple endonucleases to obtain the desired genomic length and the number of fragments to squeeze the sequencing cost (De Donato et al., 2013;Elshire et al., 2011;Sonah et al., 2013), thus improving the specificity of marker detection along individuals; however, most of the GBS application were reported for plant genomes. Teleost, representing a large portion of fish species, has been showed to undergo the additional third round of whole-genome duplication (WGD) 370 million years ago. The extra genome duplication led to a large portion of duplicated and repetitive sequences in teleost genomes (Sémon & Wolfe, 2007). GBS techniques provided an efficient way to probe polymorphism markers from complex genomes; however, the whole-genome SNP development and association studies based on GBS is rarely reported on teleost fish species. In this work, we used teleost large yellow croaker to verify the applicability of GBS on genomic marker development on teleost species. So far as we know, this is the first GBS implementation in large yellow croaker genome. The developed SNP markers provided useful resources for the following genetic studies, including population structure, conservation and functional gene mapping of important traits of the species. The enzyme combination and GBS protocols used in this study could also be valuable reference for other teleost species.
Ourin silicoexperiments mimicked the two enzyme digestion on large yellow croaker
previous GBS libraries were constructed with the fragment length 100–300 bp or even wider (Elshire et al., 2011;Sonah et al., 2013); however, we predicted∼3 million fragment would
be generated in that range. The large number of fragment implied a large amount of sequencing reads to cover those genomic regions, which would increase the unit-cost for the sequencing. To reduce the genomic fragments needed to be sequenced for libraries in this study, we attempted to narrow the length range to 200–300 bp, which was predicted to generate roughly 1.5 million genomic fragment for sequencing.
Taking the SNP frequency of 1 per 1,000 bp (Pushkarev, Neff & Quake, 2009), the library sequencing might result into roughly 300 thousand SNP markers along large yellow croaker genome. Our estimation was based on the assumption that all individuals have no mutation on endonuclease digesting site and the read depth were high enough to cover SNP loci. However, because of the divergent genomic background among populations, it is very hard to detect all SNP markers that shared by all individuals. In this work, 489,246 raw SNP markers supported by more than three reads were detected with an average sequencing amount of 600 Mb in at least 200 individual from the 500 large yellow croaker population. To facilitate the following marker association study and breeding practise, previous studies proposed several methods to filter the high quality SNP that shared in more individuals, such as depth-based (Li et al., 2009), quality score-based (Brockman et al., 2008) and population-based (Bansal et al., 2010) manner. In this study, we employed a composite strategy for SNP filtering by simultaneously considering loci depth, marker quality and shared population size. As a result, 69,845 SNP markers were left with a depth higher than 5, quality score higher than 100 and shared with at least 80% individuals (400 large yellow croakers). More than half (∼53%) of those detected quality SNP markers resided in genic regions, enabling us to probe the possible association of trait with the nearby functional genes. We noticed that the percentage of markers in genic regions was higher than that of previous reports in soybean (39.5%) (Sonah et al., 2013) but lower than that of sweat cherry (65.6%) (Guajardo et al., 2015). Those SNP markers generated from the reduced representation library, especially those in genic regions, provided us an easy and efficient manner to detect genomic small variants and to identify genomic regions related to important traits of large yellow croaker at genomic scale. The detected SNP markers were then validated by Sequenom MassARRAY assay for the randomly selected 50 loci in 30 individuals. Although the success rate (94.6%) was slight lower than that reported in the similar study in soybean (98%) (Sonah et al., 2013), the library preparation protocol and bioinformatics pipeline provided us high quality genotypes on those SNP loci in the population for the following association studies.
of fish meat are highly dependent on polyunsaturated fatty acid levels; therefore the EPA and DHA content in muscle is one of the important indicants for the meat quality of fish. The genetic bases controlling EPA and DHA accumulation in fish species are highly interconnected and not fully revealed. Identifying key SNP loci and functional genes will increase our knowledge of molecular mechanism of polyunsaturated fatty acid synthesis and metabolism in marine fish. To the best of our knowledge, most of the previous researches were focus on the genetic variants on poly unsaturated fatty acid metabolism after fish oil supplements in human or gene expression and EPA and DHA level changes with different feed in fish (Gregory et al., 2016;Li et al., 2014;Li et al., 2013;Trushenski et al., 2012). The association studies aiming to identity potential functional genes contributing to EPA and DHA accumulation in fish meat is rarely reported.
Among 176 individuals that were used to measure the muscle EPA and DHA level, the average muscle EPA and DHA content in the top 20 large yellow croakers (28.4 mg/g) was almost two-fold of that in the lowest 20 ones (14.6 mg/g). Given that those fish were reared in the same cage and fed with the identical feed, there was a great potential to raise the muscle EPA and DHA content in large yellow croaker via genetic improvements. Using the developed quality SNP markers by GBS protocol, 39 SNP markers from 11 linkage groups were observed to be significantly associated with muscle EPA and DHA levels. From the coordinates of gene and SNP loci, 122 protein-coding genes were identified around those significant markers. The functional analysis by homological searching found that many genes were involved in fat metabolism and transport, such asAPOB,CRAT andOSBPL10. Unsaturated fatty acid biosynthetic process, fatty acid derivative biosynthetic process and lipid transporter activity and fat digestion and absorption pathway were significantly enriched in GO terms and KEGG pathways for the identified functional genes. Meanwhile, we observed large numbers of genes functions in cellular metabolism, gene expression and translation regulation, which may also play a role in modulating muscle EPA and DHA contents (Tables S2andS3). Interestingly, we identified the potential functional gene of PPT2gene in large yellow croaker that was previously discovered during the whole-genome association of plasma n-3 and n-6 polyunsaturated fatty acid level in Asian and European populations (Hu et al., 2016). ThePPT2gene in the linkage group 5 of large yellow croaker might play a similar function in human and also contribute to the muscle EPA and DHA level. This result suggested that teleost fish and human may shared similar metabolic pathway for the polyunsaturated fatty acid synthesis and accumulation; however biological functions ofPPT2gene for the muscle EPA and DHA content in large yellow croaker and other vertebrates need further gene functional analysis.
CONCLUSIONS
GBS applications in other fish species. For large yellow croaker, about 70,000 high quality SNP markers, supported by at least 400 individuals in population, were detected from the GBS libraries. Those SNP markers were further experimentally validated by Sequenom MassARRAY assay. The even distribution and diversified biological impacts of those molecular makers confirmed the effect and efficiency of the GBS-based SNP development in large yellow croaker. With muscle EPA and DHA contents from 176 individuals, a genome-wide association study between genotypes and EPA and DHA level were performed. 39 and 122 significantly associated SNP loci and related protein-coding genes were identified. The functional analysis of the related genes confirmed the results of the association study. For the aspect of molecular resources, our developed SNP markers could be valuable genetic resources for large yellow croaker, and would be used in the following population structure, conservation genetics and the association studies for other important economic traits. The associated results for the muscle EPA and DHA content, namely the significant SNP loci and functional genes, provided us important guidance for the further investigation of genetic bases of the muscle EPA and DHA accumulation in large yellow croaker and would eventually aid the technological development towards the genetic improvement of meat quality via the molecular-aided selection of the species.
ADDITIONAL INFORMATION AND DECLARATIONS
Funding
This work was supported by grants from National Natural Science Foundation of China (U1205122 and 31602207), Natural Science Foundation of Fujian Province (2016J05081), National ‘863’ Project of China (2012AA10A403), and the Foundation for Innovation Research Team of Jimei University (2010A02). The funders had no role in study design, data collection and analysis, decision to publish, or preparation of the manuscript.
Grant Disclosures
The following grant information was disclosed by the authors: National Natural Science Foundation of China: U1205122, 31602207. Natural Science Foundation of Fujian Province: 2016J05081.
National ‘863’ Project of China: 2012AA10A403.
Foundation for Innovation Research Team of Jimei University: 2010A02.
Competing Interests
The authors declare there are no competing interests.
Author Contributions
• Shijun Xiao conceived and designed the experiments, performed the experiments, analyzed the data, contributed reagents/materials/analysis tools, wrote the paper, prepared figures and/or tables, reviewed drafts of the paper.
• Panpan Wang and Zhaofang Han analyzed the data, reviewed drafts of the paper.
• Yaguang Zhang and Qiurong Wang performed the experiments, contributed reagents/materials/analysis tools, reviewed drafts of the paper.
• Zhiyong Wang conceived and designed the experiments, reviewed drafts of the paper.
Animal Ethics
The following information was supplied relating to ethical approvals (i.e., approving body and any reference numbers):
This sample collection and experiments was approved by the Animal Care and Use committee of Fisheries College of Jimei University (Animal Ethics no. 1067).
Data Availability
The following information was supplied regarding data availability:
The sequencing short reads were deposited in the NCBI Sequence Read Archive (SRA): https://www.ncbi.nlm.nih.gov/bioproject/?term=309464.
Supplemental Information
Supplemental information for this article can be found online athttp://dx.doi.org/10.7717/ peerj.2664#supplemental-information.
REFERENCES
Altschul SF, Madden TL, Schäffer AA, Zhang J, Zhang Z, Miller W, Lipman DJ. 1997.
Gapped BLAST and PSI-BLAST: a new generation of protein database search programs.Nucleic Acids Research25:3389–3402DOI 10.1093/nar/25.17.3389.
Anil E. 2007.The impact of EPA and DHA on blood lipids and lipoprotein metabolism: influence of apoE genotype.Proceedings of the Nutrition Society66:60–68
DOI 10.1017/S0029665107005307.
Ao J, Mu Y, Xiang LX, Fan D, Feng M, Zhang S, Shi Q, Zhu LY, Li T, Ding Y. 2015.
Genome sequencing of the perciform fishLarimichthys croceaprovides insights into molecular and genetic mechanisms of stress adaptation.PLoS Genetics11:e1005118 DOI 10.1371/journal.pgen.1005118.
Baird NA, Etter PD, Atwood TS, Currey MC, Shiver AL, Lewis ZA, Selker EU, Cresko WA, Johnson EA. 2008.Rapid SNP discovery and genetic mapping using sequenced RAD markers.PLoS ONE3:e3376DOI 10.1371/journal.pone.0003376.
Bansal V, Harismendy O, Tewhey R, Murray SS, Schork NJ, Topol EJ, Frazer KA. 2010.
Accurate detection and genotyping of SNPs utilizing population sequencing data.
Genome Research20:537–545DOI 10.1101/gr.100040.109.
Beissinger TM, Hirsch CN, Sekhon RS, Foerster JM, Johnson JM, Muttoni G, Vail-lancourt B, Buell CR, Kaeppler SM, De Leon N. 2013.Marker density and read depth for genotyping populations using genotyping-by-sequencing.Genetics
193:1073–1081DOI 10.1534/genetics.112.147710.
Berthelot C, Brunet F, Chalopin D, Juanchich A, Bernard M, Noël B, Bento P, Da Silva C, Labadie K, Alberti A. 2014.The rainbow trout genome provides novel insights into evolution after whole-genome duplication in vertebrates.Nature
Communications5:3657–3657DOI 10.1038/ncomms4657.
Braasch I, Gehrke AR, Smith JJ, Kawasaki K, Manousaki T, Pasquier J, Amores A, Desvignes T, Batzel P, Catchen J. 2016.The spotted gar genome illuminates vertebrate evolution and facilitates human-teleost comparisons.Nature Genetics
48:427–437DOI 10.1038/ng.3526.
Brenna JT, Carlson SE. 2014.Docosahexaenoic acid and human brain development: evidence that a dietary supply is needed for optimal development.Journal of Human Evolution77:99–106DOI 10.1016/j.jhevol.2014.02.017.
Brockman W, Alvarez P, Young S, Garber M, Giannoukos G, Lee WL, Russ C, Lander ES, Nusbaum C, Jaffe DB. 2008.Quality scores and SNP detection in sequencing-by-synthesis systems.Genome Research18:763–770DOI 10.1101/gr.070227.107.
Correa K, Lhorente JP, López ME, Bassini L, Naswa S, Deeb N, Di Genova A, Maass A, Davidson WS, Yáñez JM. 2015.Genome-wide association analysis reveals loci associated with resistance against Piscirickettsia salmonis in two Atlantic salmon (Salmo salar L) chromosomes.BMC Genomics16:1–9DOI 10.1186/1471-2164-16-1.
De Donato M, Peters SO, Mitchell SE, Hussain T, Imumorin IG. 2013. Genotyping-by-sequencing (GBS): a novel, efficient and cost-effective genotyping method for cattle using next-generation sequencing.PLoS ONE8:e62137
DOI 10.1371/journal.pone.0062137.
De Pristo MA, Banks E, Poplin R, Garimella KV, Maguire JR, Hartl C, Philippakis AA, Del Angel G, Rivas MA, Hanna M. 2011.A framework for variation discovery and genotyping using next-generation DNA sequencing data.Nature Genetics
43:491–498DOI 10.1038/ng.806.
Dorajoo R, Sun Y, Han Y, Ke T, Burger A, Chang X, Low HQ, Guan W, Lemaitre RN, Khor C-C. 2015.A genome-wide association study of n-3 and n-6 plasma fatty acids in a Singaporean Chinese population.Genes & Nutrition10:1–11 DOI 10.1007/s12263-014-0449-8.
Elshire RJ, Glaubitz JC, Sun Q, Poland JA, Kawamoto K, Buckler ES, Mitchell SE. 2011.A robust, simple genotyping-by-sequencing (GBS) approach for high diversity species.PLoS ONE6:e19379DOI 10.1371/journal.pone.0019379.
Folch J, Lees M, Sloane-Stanley G. 1957.A simple method for the isolation and purifica-tion of total lipids from animal tissues.Journal of Biological Chemistry226:497–509.
Gregory M, Collins R, Tocher D, James M, Turchini G. 2016.Nutritional regulation of long-chain PUFA biosynthetic genes in rainbow trout (Oncorhynchus mykiss).The British Journal of Nutrition115:1–9DOI 10.1017/S0007114515003736.
Guajardo V, Solís S, Sagredo B, Gainza F, Muñoz C, Gasic K, Hinrichsen P. 2015.
Hiremath PJ, Kumar A, Penmetsa RV, Farmer A, Schlueter JA, Chamarthi SK, Whaley AM, Carrasquilla-Garcia N, Gaur PM, Upadhyaya HD. 2012.Large-scale development of cost-effective SNP marker assays for diversity assessment and genetic mapping in chickpea and comparative mapping in legumes.Plant Biotechnology Journal 10:716–732DOI 10.1111/j.1467-7652.2012.00710.x.
Hoffmire CA, Block RC, Thevenet-Morrison K, Van Wijngaarden E. 2012. Associa-tions between omega-3 poly-unsaturated fatty acids from fish consumption and severity of depressive symptoms: an analysis of the 2005–2008 National Health and Nutrition Examination Survey.Prostaglandins, Leukotrienes and Essential Fatty Acids
86:155–160DOI 10.1016/j.plefa.2012.03.003.
Hu Y, Li H, Lu L, Manichaikul A, Zhu J, Chen YD, Sun L, Liang S, Siscovick DS, Steffen LM, Tsai MY, Rich SS, Lemaitre RN, Lin X. 2016.Genome-wide meta-analyses identify novel loci associated with n-3 and n-6 polyunsaturated fatty acid levels in Chinese and European-ancestry populations.Human Molecular Genetics
25(6):1215–1224.
Jaillon O, Aury J-M, Brunet F, Petit J-L, Stange-Thomann N, Mauceli E, Bouneau L, Fischer C, Ozouf-Costaz C, Bernot A. 2004.Genome duplication in the teleost fish Tetraodon nigroviridis reveals the early vertebrate proto-karyotype.Nature
431:946–957DOI 10.1038/nature03025.
Li Q, Ai Q, Mai K, Xu W, Zheng Y. 2013.A comparative study:in vitroeffects of EPA and DHA on immune functions of head-kidney macrophages isolated from large yellow croaker (Larmichthys crocea).Fish & Shellfish Immunology 35:933–940 DOI 10.1016/j.fsi.2013.07.004.
Li H, Durbin R. 2009.Fast and accurate short read alignment with Burrows–Wheeler transform.Bioinformatics25:1754–1760DOI 10.1093/bioinformatics/btp324.
Li R, Li Y, Fang X, Yang H, Wang J, Kristiansen K, Wang J. 2009.SNP detection for massively parallel whole-genome resequencing.Genome Research19:1124–1132 DOI 10.1101/gr.088013.108.
Li H, Liu J-P, Zhang M-L, Yu N, Li E-C, Chen L-Q, Du Z-Y. 2014.Comparative analysis of fatty acid profiles in brains and eyes of five economic fish species in winter and summer.Journal of Food and Nutrition Research2:722–730 DOI 10.12691/jfnr-2-10-11.
Lipshutz RJ, Fodor SP, Gingeras TR, Lockhart DJ. 1999.High density synthetic oligonucleotide arrays.Nature Genetics21:20–24DOI 10.1038/4447.
Liu M, Mitcheson D, Sadovy Y. 2008.Profile of a fishery collapse: why mariculture failed to save the large yellow croaker.Fish and Fisheries9:219–242
DOI 10.1111/j.1467-2979.2008.00278.x.
McKenna A, Hanna M, Banks E, Sivachenko A, Cibulskis K, Kernytsky A, Garimella K, Altshuler D, Gabriel S, Daly M. 2010.The Genome Analysis Toolkit: a MapReduce framework for analyzing next-generation DNA sequencing data.Genome Research
Miller MR, Dunham JP, Amores A, Cresko WA, Johnson EA. 2007.Rapid and cost-effective polymorphism identification and genotyping using restriction site associ-ated DNA (RAD) markers.Genome Research17:240–248DOI 10.1101/gr.5681207.
Muir P, Li S, Lou S, Wang D, Spakowicz DJ, Salichos L, Zhang J, Weinstock GM, Isaacs F, Rozowsky J. 2016.The real cost of sequencing: scaling computation to keep pace with data generation.Genome Biology17:1–9DOI 10.1186/s13059-015-0866-z.
Murillo E, Rao K, Durant AA. 2014.The lipid content and fatty acid composition of four eastern central Pacific native fish species.Journal of Food Composition and Analysis
33:1–5DOI 10.1016/j.jfca.2013.08.007.
Narum SR, Buerkle CA, Davey JW, Miller MR, Hohenlohe PA. 2013. Genotyping-by-sequencing in ecological and conservation genomics.Molecular Ecology
22:2841–2847DOI 10.1111/mec.12350.
Nguyen TTT, Hayes BJ, Ingram BA. 2014.Genetic parameters and response to selection in blue mussel (Mytilus galloprovincialis) using a SNP-based pedigree.Aquaculture
420–421:295–301 DOI 10.1016/j.aquaculture.2013.11.021.
Poland JA, Rife TW. 2012.Genotyping-by-sequencing for plant breeding and genetics.
The Plant Genome5:92–102DOI 10.3835/plantgenome2012.05.0005.
Popova T, Boeva V, Manie E, Rozenholc Y, Barillot E, Stern M-H. 2013.Analysis of so-matic alterations in cancer genome: from SNP arrays to next generation sequencing.
Sequence and Genome Analysis I–Humans, Animals and Plants204:63–97.
Purcell S, Neale B, Todd-Brown K, Thomas L, Ferreira MA, Bender D, Maller J, Sklar P, De Bakker PI, Daly MJ. 2007.PLINK: a tool set for whole-genome association and population-based linkage analyses.The American Journal of Human Genetics
81:559–575DOI 10.1086/519795.
Pushkarev D, Neff NF, Quake SR. 2009.Single-molecule sequencing of an individual human genome.Nature Biotechnology27:847–850DOI 10.1038/nbt.1561.
Qiu X. 2003.Biosynthesis of docosahexaenoic acid (DHA, 22: 6–4, 7, 10, 13, 16, 19): two distinct pathways.Prostaglandins, Leukotrienes and Essential Fatty Acids68:181–186 DOI 10.1016/S0952-3278(02)00268-5.
Rise P, Marangoni F, Galli C. 2002.Regulation of PUFA metabolism: pharmacological and toxicological aspects.Prostaglandins, Leukotrienes and Essential Fatty Acids
67:85–89DOI 10.1054/plef.2002.0403.
Rowe H, Renaut S, Guggisberg A. 2011.RAD in the realm of next-generation sequencing technologies.Molecular Ecology20:3499–3502.
Seeb J, Carvalho G, Hauser L, Naish K, Roberts S, Seeb L. 2011.Single-nucleotide polymorphism (SNP) discovery and applications of SNP genotyping in nonmodel organisms.Molecular Ecology Resources11:1–8.
Sémon M, Wolfe KH. 2007.Rearrangement rate following the whole-genome duplica-tion in teleosts.Molecular Biology and Evolution24:860–867.
Shi J, Walker MG. 2007.Gene set enrichment analysis (GSEA) for interpreting gene ex-pression profiles.Current Bioinformatics2:133–137
Smith S, Graser H-U. 1986.Estimating variance components in a class of mixed models by restricted maximum likelihood.Journal of Dairy Science69:1156–1165 DOI 10.3168/jds.S0022-0302(86)80516-1.
Sonah H, Bastien M, Iquira E, Tardivel A, Légaré G, Boyle B, Normandeau É, Laroche J, Larose S, Jean M. 2013.An improved genotyping by sequencing (GBS) approach offering increased versatility and efficiency of SNP discovery and genotyping.PLoS ONE8:e54603DOI 10.1371/journal.pone.0054603.
Steiner CC, Putnam AS, Hoeck PE, Ryder OA. 2013.Conservation genomics of threatened animal species.Annual Review of Animal Biosciences1:261–281 DOI 10.1146/annurev-animal-031412-103636.
Sun L, Liu S, Wang R, Jiang Y, Zhang Y, Zhang J, Bao L, Kaltenboeck L, Dunham R, Waldbieser G. 2014.Identification and analysis of genome-wide SNPs provide insight into signatures of selection and domestication in channel catfish (Ictalurus
punctatus).PLoS ONE9:e109666DOI 10.1371/journal.pone.0109666.
Swanson D, Block R, Mousa SA. 2012.Omega-3 fatty acids EPA and DHA: health benefits throughout life.Advances in Nutrition3:1–7DOI 10.3945/an.111.000893.
Trushenski J, Schwarz M, Bergman A, Rombenso A, Delbos B. 2012.DHA is essential, EPA appears largely expendable, in meeting the n-3 long-chain polyunsaturated fatty acid requirements of juvenile cobia Rachycentron canadum.Aquaculture 326:81–89.
Van der Auwera GA, Carneiro MO, Hartl C, Poplin R, Del Angel G, Levy-Moonshine A, Jordan T, Shakir K, Roazen D, Thibault J, Banks E, Garimella KV, Altshuler D, Gabriel S, DePristo MA. 2013.From FastQ data to high-confidence variant calls: the genome analysis Toolkit best practices pipeline.Current Protocols in Bioinformatics
43:11.10.1–11.10.33DOI 10.1002/0471250953.bi1110s43.
Wang S, Meyer E, McKay JK, Matz MV. 2012.2b-RAD: a simple and flexible method for genome-wide genotyping.Nature Methods9:808–810 DOI 10.1038/nmeth.2023.
Wang S, Sha Z, Sonstegard TS, Liu H, Xu P, Somridhivej B, Peatman E, Kucuktas H, Liu Z. 2008.Quality assessment parameters for EST-derived SNPs from catfish.BMC Genomics9:1DOI 10.1186/1471-2164-9-1.
Xiao S, Han Z, Wang P, Han F, Liu Y, Li J, Wang ZY. 2015a.Functional marker detec-tion and analysis on a comprehensive transcriptome of large yellow croaker by next generation sequencing.PLoS ONE10:e0124432DOI 10.1371/journal.pone.0124432.