Working
Paper
402
The Manufacturing Industry in Brazil in
the era of Global Value Chains
Lucas P. do C. Ferraz
Leopoldo Gutierre
Rodolfo Cabral
CCGI - Nº04
Working Paper Series
– • •
Os artigos dos Textos para Discussão da Escola de Economia de São Paulo da Fundação Getulio Vargas são de inteira responsabilidade dos autores e não refletem necessariamente a opinião da
FGV-EESP. É permitida a reprodução total ou parcial dos artigos, desde que creditada a fonte.
Escola de Economia de São Paulo da Fundação Getulio Vargas FGV-EESP
The Manufacturing Industry in Brazil in the era of Global Value
Chains
Lucas P. do C. Ferraz1
Leopoldo Gutierre2
Rodolfo Cabral3
Abstract
This article presents a comprehensive and detailed overview of the international trade
performance of the manufacturing industry in Brazil over the last decades, emphasizing its
participation in Global Value Chains. It uses information from recent available global
input-output tables such as WIOD (World Input-input-output database) and TIVA (Trade in Value Added,
OECD) as well as complementary information from the GTAP 8 (Global Trade Analysis
Project) database. The calculation of a broad set of value added type indicators allows a
precise contextualization of the ongoing structural changes in the Brazilian industry,
highlighting the relative isolation of its manufacturing sector from the most relevant
international supply chains. This article also proposes a public policy discussion, presenting
two case studies: the first one related to trade facilitation and the second one to preferential
trade agreements. The main conclusions are twofold: first, the reduction of time delays at
customs in Brazil may significantly improve the trade performance of its manufacturing
industry, specially for the more capital intensive sectors which are generally the ones with
greater potential to connection to global value chains; second, the extension of the concept of
a “preferential trade partner” to the context of the global unbundling of production may pave
the way to future trade policy in Brazil, particularly in the mapping of those partners whose
bilateral trade relations with Brazil should receive greater priority by policy makers.
1 São Paulo School of Economics (FGV-EESP); Centre for Global Trade and Investment (CGTI-EESP). 2
University of São Paulo (FEA-USP).
1. Introduction
International trade governance and the very nature of trade have changed significantly over the last decades. Firstly, the growing difficulties faced by the past multilateral trade negotiations have paved the way to the escalation of preferential trade agreements (PTA’s) at the bilateral, regional and even plurilateral levels. Just over the last two decades, more than four hundred PTAs were notified at the WTO. Secondly, regarding the nature of trade, countries have been progressively trading in tasks (Grossman and Rossi-Hansberg, 2008) instead of trading in goods. Nowadays, more than two-thirds of global exports correspond to trade in intermediate goods and services, reflecting the increasing importance of the fragmentation of production (Baldwin and Lopez-Gonzales, 2013).
The global unbundling of production gave rise to the formation of regional/global value chains and has become an alternative path to industrialization for many developing countries worldwide, especially for those located in Asia and Eastern Europe. It turns out that joining international production networks, instead of building entire domestic supply chains, has proven to be a much more efficient path towards industrialization (Baldwin, 2012).
This article has two objectives. The first one is to offer a quantitative and detailed overview of the recent evolution of foreign trade in Brazil from both aggregate and sectorial perspectives, taken its level of integration to global value chains (GVCs) as the main focus of the analysis. This analysis is itself different from traditional ones found in the empirical literature on trade as it tries to evaluate the trade performance of several production sectors in Brazil according to the value chain logic, i.e., tracing out trade in value added instead of gross trade flows. This new approach has proven more adequate to the analysis of a global economy under a continuous process of fragmentation of production, where the usual correlation between gross trade flows and welfare gains has been progressively fading away. The second objective of this article is to offer additional ingredients to the national debate on public policy regarding the role of government on promoting the necessary conditions to foster integration of the manufacturing industry in Brazil to relevant GVCs. Taken the existing empirical evidence as a guide, two sensitive issues in Brazil are then tackled in a row: (1) the quality of its port infrastructure and the impact of streamlining border procedures on trade; (2) the relevance of promoting preferential trade agreements with natural trade partners (according to the logic of value chains) to foster trade in value added.
Most of the stylized facts reported in this article were built from value added measures. This approach allows the estimation of the sources of value added in the production of final goods and services in a given country, revealing how fragmented – and therefore connected to GVCs - its production structure actually is.
Beyond this introduction, this article has five additional sections. Section 2 presents an overview of the most recent theoretical and empirical literature on Global Value Chains. Section 3 describes the main methodological aspects involved in the construction of the GVC indicators reported in this work. Section 4 presents the stylized facts related to the evolution of foreign trade in Brazil over the last decades, focusing on trade in value added. The policy implications are discussed in section 5, where the two case studies are presented. Section 6 concludes.
2. Literature Review
Global value chains (GVC)4 can be defined as the whole set of activities developed by firms and workers in different countries that are responsible for taking a product from its initial conception towards its final consumption (Gereffi and Fernandez-Stark, 2011, apud Backer and Miroudot, 2013; Timmer et al, 2013). In each stage of production along a value chain a given producer employs local factors (capital, labor and land) whose payments correspond to domestic value added. This process is repeated in a next stage – possibly in a different country - such that the previous value added corresponds to input costs to the next producer (Koopman et al, 2014; Backer and Miroudot, 2013).
The international fragmentation of production is not exactly a new phenomenon. Even before the 80’s it is possible to find plenty of examples of GVCs. At that time, however, the relevance of international supply chains was much lower (trade in intermediates corresponded to over 40% of global exports compared to near 70% nowadays) and they were concentrated among developed countries in the so called “intra-industry” trade.
The literature on GVCs gained its momentum as soon as it became clear that a new pattern of production was taking shape in the global arena: trade in intermediate goods significantly increased its participation in global exports (Backer & Miroudot, 2013) and began to occur between developed and developing nations (North-South trade in intermediates) (Baldwin &
4
Lopez-Gonzalez, 2013). Moreover, the stampede of GVCs gave rise to industrialization waves in several emerging economies such as China and more recently in eastern European countries such as Poland, Hungary and Czech Republic.
According to Grossman and Rossi-Hansberg (2006), among the forces that helped to promote the global unbundling of production (also known in the literature as “offshoring” or “trade in tasks”) were the significant reduction in international transport costs and the new advances in information technology. The authors point out that this process has benefited to a higher extent the global trade in manufactured intermediate goods, mostly because of the lower correlation between the production of those goods and the relative factor proportion of countries in terms of their land and natural resources. The logic behind this idea is that a manufactured good can be potentially produced in any economic region in the world. The same does not happen to the production of an agricultural good, given its higher dependence on the existence of country specific comparative advantages.
Regarding the geography of global value chains it can be said that they are markedly regional in nature, meaning the existence of a higher concentration of trade in intermediates goods in the neighborhood of large economies such as the USA, Germany and Japan5, also called “Headquarter economies” (Johnson and Noguera, 2012; Baldwin and Lopez Gonzalez, 2013). However, more recent evidence brought about by Timer at al (2014) suggests that GVCs are becoming truthfully global, with the progressive incorporation of more remote countries from several regions in the world.
Another noteworthy aspect related to GVCs is the fact that they are not restricted to the flows of intermediate goods and services among countries, but they also tend to increase the international mobility of managerial expertise, i.e., firms usually offshore not only stages of production but also their whole set of best practices, helping to improve productivity in less developed offshoring regions in the world (Baldwin & Lopez-Gonzalez, 2013).
The theoretical implications of the global unbundling of production to relative factor prices were first discussed in the works by Kohler (2004) and Antràs et al (2006), with different assumptions regarding factor mobility. The work by Grossman and Rossi-Hansberg (2008) sets up a perfect competition model where bilateral trade in tasks (stages of production) comes up endogenously. This work is the first in the literature to formalize the analogy between offshoring and a technological shock. In this sense, the model proposed by the authors draws the conditions under which productivity gains stemming from offshoring less
5
efficient domestic stages of production to foreign countries may result in higher salaries and increased (net) demand for jobs in the offshoring nation.
The input-output analysis carried out by Timer et al (2013) suggest that in the case of Germany, the outsourcing of parts of its local production chains to eastern European countries such as Hungary, Poland and Czech Republic resulted in net losses of jobs in sectors directly involved with those activities. On the other hand, there was a strong increase in net job positions in other sectors indirectly related to the domestic chains, particularly in services. In general, the results are suggestive that the whole offshoring process benefited all the countries involved, with the creation of net job positions in the offshoring nation (Germany) as predicted by Grossman and Rossi-Hansberg (2008).
The recent literature on GVCs has also contributed to a better understanding of some of the ongoing structural changes in the global economy, such as: (1) the increasing economic interdependence among countries and its impact on the very concept of competitiveness: goods are nowadays “made in the world” and competitiveness is no longer obtained within domestic confinements alone (Timer et al, 2013); (2) Instead of specialization in final goods, countries nowadays specialize in stages of production and the relevant competition among nations is about the possible roles to perform inside GVCs; (3) the international trade governance has been facing new challenges regarding the imposition of trade instruments - such as antidumping measures - in the context of supply chains comprised by many countries. Also, as a consequence of the global unbundling of production, traditional trade statistics based on gross trade may be misleading as a measure of the competitiveness of a country (Koopman et al, AER, 2014). Therefore, double counting and the possible overestimation of the correlation between gross trade flows, income and jobs should be correctly addressed. Last, the trade in value added perspective has highlighted the crucial role of services to the competitiveness of a country (OECD-WTO 2012).
In order to clearly identify the trade flows inside a GVC, it is necessary to trace out international trade in intermediates. However, this data is not available in traditional trade databases. The most trustable way to gather information about trade flows in intermediates is through the use of global input-output databases. This is the approach taken in this article.
3. Data Base and Methodology
3.1. The global input-output databases
The global input-output databases used in this work stem from the estimation of trade flows among industries located in a broad set of different countries and regions. More precisely, these tables trace out the interrelations among producers and consumers located in either the same country/region or in different countries/regions (OECD-WTO 2011).
The two basic accounting relations contained in global input-output tables are the following:
𝑥! 𝑠 = 𝑧!" 𝑠,𝑡 !
!!! !
!!!
+ 𝑓!" 𝑠 !
!!!
,∀𝑖=1,…,𝑁; ∀𝑠=1,…,𝑆; (1)
𝑥!
𝑡 = 𝑧!" 𝑠,𝑡 !
!!!
!
!!!
+𝑣!
𝑡 ,∀𝑗=1,…,𝑁; ∀𝑡=1,…,𝑆; (2)
where:
𝑥! 𝑠 is the output of sector 𝑠 in country 𝑖;
𝑧!" 𝑠,𝑡 is the quantity of intermediates from sector 𝑠 in country 𝑖 used to produce
output in sector 𝑡 in country 𝑗;
𝑓!" 𝑠 is the quantity of final goods from sector 𝑠 in country 𝑖 absorbed in destination 𝑗;
𝑣!"
𝑡 is the value added by sector𝑠 from country 𝑖;
𝑆 is the number of productive sectors considered;
𝑁 is the number of countries considered;
Equation (1) guarantees that total output in a given sector of a given country is allocated between intermediate consumption and final consumption. Equation (2) shows that total output in a given sector reflects expenses with intermediate products and primary factors.
The system of equations (1) and (2) can be written in matrix form as:
𝒙=𝒁𝒊+𝒇 (3)
𝒙=𝒊′𝒁+𝒗 (4)
where 𝒊 is a unitary row vector of a convenient dimension.
Table 3.1 – Stylized example of a global input output matrix
Source: Authors’ elaboration.
The construction of global input-output matrices is extremely data intensive, involving the consolidation and harmonization of accounting information from different countries/regions. This explains why these matrices are generally built with the direct or indirect support of international projects and organizations such as: the Global Trade Analysis Project (GTAP), OECD Inter-country Input-Output database (OECD-WTO), World Input-Output Database
(WIOD). Results from this work are fully based on the information made available from these sources. Their structures are synthesized in Table 3.2.6:
Table 3.2 – Description of the input-output matrices used in this work.
Source: Research data and Author’s elaboration.
At this point, some important reservations must be made: 1) the complete global input-output matrix from OECD is not publicly available. Only a few indicators can be extracted from its website and for rather aggregated sectors (18 sectors in total); 2) the GTAP source does not
6
This Table was adapted from OECD-WTO 2011.
Project Institution Sources Number of countries Number of sectors Years available
Global Trade Analysis Project
Purdue University, consortium of 27
institutions
GTAP Network members contribution
(including multiple sources and is not limited to official
statistics)
134 regions 57 sectors (GTAP
commodities) 2004, 2007
OECD Inter-‐country
Input-‐Output database OECD
Input-‐Output Tables and National Accounts
(use and production tables)
55 countries + Rest of
World (ROW) 37 sectors 1995, 2000, 2005, 2009
World Input-‐Output Database
University of Groningen, consortium
of 27 institutions
National Accounts (use and production tables)
41 countries + Rest of World (ROW)
35 industries, 59
deliver a ready-to-use global input-output database. The original GTAP database must be adequately worked out through the methodology proposed by Johnson and Noguera (2012)7.
The methodology proposed by Johnson and Noguera (2012) uses the proportionality assumption, which is the standard approach in the literature. This assumption is necessary because the GTAP database only gives information on the total volume of imports of intermediates and final goods for each importer, without discriminating the origin of those imports. On the other hand, for a given importer, the database gives information on the total volume of imports (intermediates plus final goods) from each source country. The proportionality assumption takes the share of each source country on the total volume of imports of a given importer and applies it to its total volume of intermediates and final goods imported.
3.2. Value chain indicators
The indicators used in this work are based on the recent literature of input-output applied to the analysis of global value chains (Hummels et al (2001); Daudin et al (2011); Koopman et al (2010, 2014); Jonhson and Noguera (2012)).
The first indicator calculated is the so called “exported value added”, which is based on the concept of “trade in value added” developed by Johnson and Noguera (2012). This indicator captures the amount of domestic value added a given country exports to another embedded in the final goods consumed in the destination country (Stehrer (2012)).
This indicator can be built taking the technical coefficient a!"(𝑠,𝑡), which is defined as:
a
!"(
𝑠
,
𝑡
)
=𝑧𝑖𝑗 𝑠,𝑡
𝑥
𝑖𝑗 𝑠
(5)
Being 𝐴 the matrix of technical coefficients, it is possible to derive the following matrix form from equation (1):
𝒙= 𝑰−𝑨 !!.𝒇=𝑩.𝒇 (6)
7
. 𝒙 𝟏 𝒙𝟐 ⋮ 𝒙 𝑵 =
𝑩𝟏𝟏 𝑩𝟏𝟐
𝑩𝟐𝟏 𝑩𝟐𝟐 ⋯
𝑩𝟏𝑵
𝑩𝟐𝑵
⋮ ⋱ ⋮
𝑩𝑵𝟏 𝑩𝑵𝟐 ⋯ 𝑩𝑵𝑵
. 𝒇𝟏𝒋 ! !!! 𝒇𝟐𝒋 ! !!! ⋮ 𝒇𝑵𝒋 ! !!! =
𝑩𝟏𝟏 𝑩𝟏𝟐
𝑩𝟐𝟏 𝑩𝟐𝟐 ⋯
𝑩𝟏𝑵
𝑩𝟐𝑵
⋮ ⋱ ⋮
𝑩𝑵𝟏 𝑩𝑵𝟐 ⋯ 𝑩𝑵𝑵
𝒇𝟏 𝒇𝟐
⋮
𝒇𝑵
(7)
We define the matrix 𝒇 as the final demand matrix whose typical element is 𝒇!" is the vector
𝑆𝑥1 of final demand of the country 𝑖 for country 𝑗 products. Therefore, it is also possible to
write the total output vector 𝒙 as follows:
𝑿
=
𝒙𝟏𝟏
𝒙
𝟏𝟐𝒙𝟐𝟏 𝒙𝟐𝟐
⋯
𝒙 𝟏𝑵 𝒙
𝟐𝑵
⋮
⋱
⋮
𝒙𝑵𝟏 𝒙𝑵𝟐
⋯
𝒙𝑵𝑵
=
𝑩𝟏𝟏 𝑩𝟏𝟐 𝑩𝟐𝟏 𝑩𝟐𝟐
⋯
𝑩𝟏𝑵 𝑩𝟐𝑵
⋮
⋱
⋮
𝑩𝑵𝟏 𝑩𝑵𝟐
⋯
𝑩𝑵𝑵.
𝒇𝟏𝟏 𝒇𝟏𝟐 𝒇𝟐𝟏 𝒇𝟐𝟐
⋯
𝒇𝟏𝑵 𝒇𝟐𝑵
⋮
⋱
⋮
𝒇𝑵𝟏 𝒇𝑵𝟐
⋯
𝒇𝑵𝑵(8)
Let be 𝑣 vector of value added coefficients by total product unit given by:
𝒗
=
𝑰
𝑵𝑺−
𝑨
!.
𝒊
=
𝑰
𝑺𝟎
𝟎
𝑰
𝑺⋯
𝟎
𝟎
⋮
⋱
⋮
𝟎
𝟎
⋯
𝑰
𝑺−
𝑨𝟏𝟏
𝑨
𝟏𝟐 𝑨𝟐𝟏 𝑨𝟐𝟐⋯
𝑨𝟏𝑵 𝑨𝟐𝑵
⋮
⋱
⋮
𝑨𝑵𝟏 𝑨𝑵𝟐
⋯
𝑨𝑵𝑵!
.
𝒊
=
𝒗 𝟏 𝒗 𝟐
⋮
𝒗 𝑵 (9)Considering additionally the vector of bilateral exports:
𝒆𝒊𝒋 =𝑨𝒊𝒋𝒙𝒋+𝒇𝒊𝒋 (10)
𝒆=𝑬.𝒊
=
𝟎
𝒆
𝟏𝟐
𝒆
𝟐𝟏
𝟎
⋯
𝒆𝟏𝑵 𝒆
𝟐𝑵
⋮
⋱
⋮
𝒆
𝑵𝟏 𝒆𝑵𝟐
⋯
𝟎
.
𝒊
=
𝒆𝟏 𝒆 𝟐
⋮
𝒆 𝑵 (11)Finally, assuming that the vectors with the circumflex superscript are diagonalized vectors, we can define the export in value added of country 𝑖 to country 𝑗 as:
𝒗𝒂𝒆𝒊𝒋 =𝒗𝒊.𝒙𝒊𝒋 (12)
Thus, the trade balance vector of 𝑖 in relation to 𝑗 is given by:
𝒗𝒂𝒕𝒃𝒊𝒋= 𝒗𝒂𝒆𝒊𝒋−𝒗𝒂𝒆𝒋𝒊 (13)
The ratio of the export value added and total exports of 𝑖 can be written as:
𝑉𝐴𝑋𝒊 =
𝒊!. 𝑵𝒗𝒂𝒆𝒊𝒋
𝒋
𝒊!. 𝑵𝒆𝒊𝒋
𝒋
(14)
Following Johnson & Noguera (2012) we have the following exports decomposition:
𝒊′.𝒆𝒊𝒋= 𝒊′. 𝑨𝒊𝒋.𝒙𝒋𝒋+𝒇𝒊𝒋 +𝒊′.𝑨𝒊𝒋.𝒙𝒋𝒊+ 𝒊′.𝑨𝒊𝒋.𝒙𝒋𝒌
𝒌!𝒋,𝒊 (15)
These three terms have the following interpretations : 1) the first is called absorption because it captures the portion of country 𝑖 exports that are absorbed and consumed in the country 𝑗,
embedded in the consumption of own goods produced by the destination country; 2) the second term is called reflection, because it captures the intermediate goods produced by country 𝑖 that returns embedded in the final goods exported by 𝑗 to 𝑖; 3) the third term is called
redirection and capture the sum of intermediate goods 𝑖 embedded in the goods exported by 𝑗
and consumed in all other countries (Johnson & Noguera 2012).
Finally, like Koopman et al (2010, 2014), we consider that the import content of exports of 𝑖 is:
𝑉𝑆! =
𝒗𝒋.𝑩𝒋𝒊 𝑵
𝒋!𝒊 .𝒆𝒊
𝒊!.𝒆𝒊 (16)
Following Backer and Miroudot (2013) it’s possible interpret this index as backward link in the value chain (or upstream chaining or foreign content of exports). Another index used in this work is the VS1, which is set for the country 𝑖 as:
𝑉𝑆1! =
𝒗𝒊.𝑩𝒊𝒋 𝑵
𝒋!𝒊 .𝒆𝒋
𝒊!.𝒆𝒊 (17)
Following again Backer and Miroudot (2013), it’s possible interpret this index as forward link (or chaining downstream or proportion of the total corresponding export to domestic intermediate goods that are re-exported by the rest of the world).
4. The Brazilian economy and the phenomenon of Global Value Chains
This section aims to present the trade performance of the Brazilian Economy over the last decades from a global comparative perspective. Given the implicit objective of identifying possible channels of connections to global value chains, the analysis will focus on trade in intermediates and on the quantification and discrimination by source of the value added created by gross exports.
4.1. Some stylized facts on the trade performance of the Brazilian economy over the
period 1995-2011
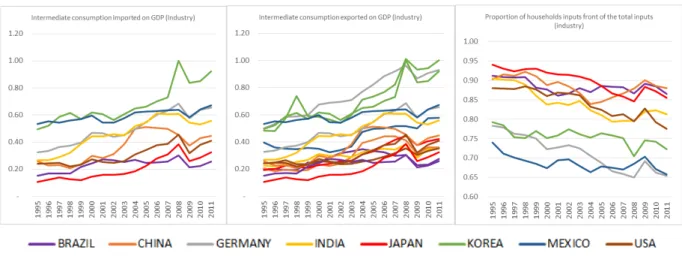
4.1. Currently, more than two thirds of global exports corresponds to intermediate goods. Just between 1995 and 2008 this share has grown nearly 8%. Moreover, there is compelling evidence that the fragmentation of production has benefited developing countries at a higher degree, at least in aggregated terms. This is shown in the central panel in Figure 4.1, where the share of domestic value added generated by global exports, calculated by equation (12), is represented for a group of medium income (increasing line) and high income (decreasing line) economies8. It shows that, from 1995 to 2011, medium income countries have increased their share in domestic value added generated by global exports by nearly 10%, to the detriment of high income countries.
An expected result of the fragmentation of production is the increase in the foreign content embedded in gross exports, which means less domestic value added created per unit of exports. For instance, in the left panel of Figure 4.1 it is shown that, in the case of China, a country strongly connected to GVCs, for each dollar exported, 61 cents correspond to the payment of domestic production factors and the remaining 39 cents correspond to the payment of production factors located overseas. In the case of Brazil, only 13 cents of each dollar exported remunerate foreign production factors (meaning 87 cents remunerate domestic production factors), a number close to the one found for Russia exports (10 cents)9.
Figure 4.1 – (Left) Domestic value added generated as a share of gross exports; (Center) Share of domestic
value added generated by global exports; (Right) Share of intermediates in global exports.
Source: OECD-WTO and WIOD. Authors’ elaboration
In summary, the stylized facts presented in Figure 4.1 suggest that the process of international fragmentation of production has evolved continuously over the recent decades and that
8 According to the World Bank Classification. 9
medium income countries are the ones reaping the benefits from trade at a higher degree than high income countries.
Given these findings, it is important to investigate to what extent Brazil participates in this process. As a first approach, we note that Brazil and Russia are the economies which, among the BRICS, have the highest rates of domestic value added in their gross exports. When we think about the new international production fragmentation context, we expect smaller rates of domestic value added in gross exports for integrated countries. It is worth highlighting that for a more rigorous analysis of major commodity exporters (such as Brazil and Russia) it is necessary to control for the importance of these sectors (commodities) in total exports, given the fact that they are structurally less integrated to GVC.
We build some indicators (Figure 4.2) from the information available in the input-output tables provided by the WIOD project that may help us understand Brazil's position in the GVC context10. The focus is the performance of its manufacturing industry, a sector traditionally more integrated to GVCs, according to the international evidence.
Figure 4.2 – Evolution of IMG/MGDP, EIMG/MGDP and DIG/TIMG
Source: WIOD. Authors’ elaboration
The first indicator (left-hand side panel of Figure 4.2) measures the volume of imports of intermediate manufactured goods over the manufacturing sector’s GDP (IMG / MGDP) for a set of countries. The analysis of this indicator over the period 1995-2011 reveals that, in general, there is a rising trend of this indicator (left panel of Figure 4.2). Specifically for Brazil, it is noted that the country has a IMG / MGDP slightly increasing but still below other countries that are commonly identified in the literature as highly integrated to GVC, such as China,
10 It is important to emphasize that many times we compute statistics only for the manufacturing sector
Korea, Germany and Mexico. Interestingly, IMG/MGDP for Brazil is close to those found in developed and highly efficient countries that have a more self-sufficient industry, such as Japan and USA.
The indicator for the total exports of intermediate manufactured goods over the manufacturing sector’s GDP (EIMG / MGDP) is shown in the middle panel of Figure 4.2. While this indicator reached almost 100% in 2011 for countries like Germany and Korea, it doesn't reach more than 30% in the case of Brazil. As expected, the manufacturing sector in Brazil corroborates the well established empirical evidence that low importing industries are also typically low exporting ones.
The low level of international trade in intermediate goods practiced by the manufacturing sector in Brazil is consistent with the analysis of another indicator that express the share of domestic intermediate goods over total intermediate goods consumed by the manufacturing sector (DIG / TIGM) (right-hand side panel of Figure 4.2). Despite the global downward trend over the period, this indicator reached 87.5% for the manufacturing industry in Brazil in 2011, far above the shares found for manufacturing industries deemed references in the fragmentation of production, such as Germany and Mexico, with values near 65%.
Figure 4.3 – Foreign content of manufacturing exports (VS)
Source: OECD-WTO. Authors’ elaboration
When Brazil’s most relevant preferential trade agreement over the last 23 years is taken into consideration - the Mercosur – poor existing signs of fragmentation and specialization of production activities do not inspire optimism. First, the VS index for the second most important country in the agreement, Argentina, is only one position above Brazil (see Figure 4.3). This is an indication that Argentina is also relatively little integrated to international supply chains. Second, indicators on the total imports of manufactured intermediates over manufacturing GDP as well as on the total imports of manufactured goods over manufacturing GDP, measured for both Brazil and Argentina, are quite low from a comparative perspective with 133 countries, as seen in Table 4.1. These results, therefore, also reinforce the general impression that Brazil and Argentina are countries still relatively closed to international trade. According to Table 4.1, the manufacturing industry in Bra
zil ranks 132 out of 133 countries when it comes to the penetration of its total imports (M/GDP) over GDP.
Table 4.1 –Supply chain indicators for the manufacturing sectors in Brazil and Argentina (year = 2007)
Source: GTAP 8.1. Authors’ elaboration
Finally, in order to assess how deep trade integration according to the value chain logic might be among countries in Mercosur, tables of "triangulation" were constructed, following the decomposition proposed in equation (15). Additional tables were built in order to track evidence on other relevant regional value chains, such as NAFTA (North American Free Trade Agreement) and the European Union as well as a “truly global” value chain called
Value Rank Value Rank Value Rank Argentina 48% 84/133 87% 109/133 63% 59/133
"Trans-Pacific". This would allow the establishment of a relatively broader pattern of comparison.
Table 4.2 – Tables of Triangulation - Mercosur (year = 2007)11
Table 4.3 - Tables of Regional and Trans-Regional Triangulation (year = 2007)
Source: GTAP 8.1. Authors’ elaboration
The analysis of the Table 4.2 suggests that “reflection” (re-exports of imported intermediates back to the country of origin after they have been reprocessed in a foreign country) and “redirection” (re-export of the imported intermediate good to third countries) are relatively low for regional trade among countries in Mercosur in comparison to other regional/global value chains in Table 4.3. For instance, for every $100 exported from Brazil to Argentina, only $32.80 are redirected to other countries, of which $5.5 return to Brazil (reflection) as Brazilian intermediates embedded in final goods imported from Argentina. When compared to regional value chains in NAFTA, where reflection is around 20%, or the existing redirection in European regional value chains that, in the case of exports from Germany to Czech Republic, reaches 48% (reflection included), we note how poorly integrated are countries in Mercosur when it comes to the logic of regional supply chains. Last, If we consider a "Trans-Pacific" global value chain in Table 4.3, for every $100 exported from South Korea to China, about $38 corresponds to South Korean intermediates that are redirected to other country destinations embedded in final goods exported from China, of which $ 11.2 goes to the USA.
In summary, based on the evidence presented, it seems safe to conclude that the world economy has undergone a significant process of production unbundling over the last decades. However, Brazil’s economy does not seem to be actively inserted in this movement, according to information available from both its general trade liberalization indicators as well as the
11
Last available year for the GTAP database.
Value chain in Mercosur Value chain in Mercosur
Brazil export to: Argentina export to:
Argentina Paraguay Uruguay Brazil Paraguay Uruguay
Argentina 77.2% Paraguay 81.0% Uruguay 75.7% Brazil 83.0% Paraguay 83.1% Uruguay 72.9%
Brazil 5.5% Brazil 4.2% Brazil 3.3% Argentina 2.0% Brazil 3.4% Brazil 4.5%
Uruguay 0.4% Argentina 1.6% Argentina 2.0% Paraguay 0.2% Argentina 1.4% Argentina 1.9%
Paraguay 0.3% Uruguay 0.1% Paraguay 0.3% Uruguay 0.2% Uruguay 0.1% Paraguay 0.4%
Value Chain in NAFTA Value Chain in Europe Trans-‐Pacific Value Chain USA export to: Germany export to: Korea export to: Mexico Canadá France Czech Rep. China Japan
existing shallow signs of integration with its regional trade partners in Mercosur when it comes to the supply chain logic. The next section will focus on how these movements may be occurring at the micro-sectorial level.
5. The evolution of the industry perspective in the period 1995-2011
This section addresses three specific questions12 : 1) What is the level of participation and distribution of domestic/imported intermediates over sectorial activity in Brazil?; 2) Has there been some tendency of sectorial specialization in the production of specific intermediates/final goods in the Brazilian economy?; 3) Is it possible to infer how the sectorial activity in Brazil has evolved in terms of specialization in high/low valued added stages of production over the last decades?
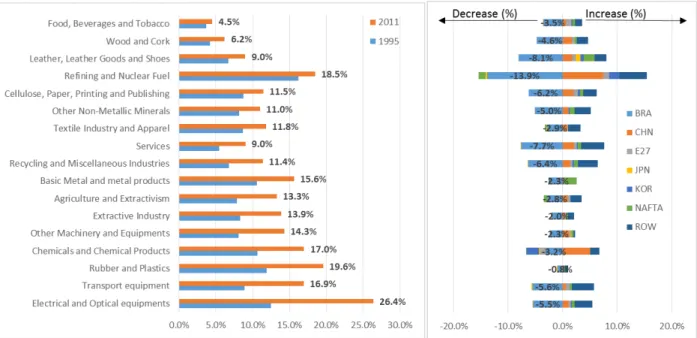
To address the first question, Figure 5.1 (left panel) represents the evolution of imported intermediates consumed by 14 sectors in the Brazilian industry between 1995 and 201113, measured as its share on total intermediates (imported and locally produced intermediates) consumed by each sector. It can be seen that from 1995 to 2011, the share of imported intermediates on total consumption increased for all sectors in the Brazilian economy, mainly in high-tech manufacturing sectors, which showed a greater increase in this ratio. In particular, the Electrical and Optical equipments sector showed both the highest level of participation of imported intermediates on total consumption at the end of the period (26.4%) as well as the highest relative growth over the period (about 15 percentage points). Despite its significant fall over the period analyzed, sectorial consumption of locally sourced intermediates is still predominant for all sectors in the Brazilian economy (the share of domestically produced intermediates on national consumption of intermediates is 86.7%) and higher than expected in an international comparative perspective, as discussed in the previous section. The right-hand panel of Figure 5.1 shows the origin of the new imported intermediates consumed by each sector in Brazil over the period analyzed and which countries have lost ground with these changes. As suggested by the data, China is the country that has benefited the most as a supplier of intermediates to Brazil and has played a prominent role in all sectors of the Brazilian economy. Furthermore, the increasing presence of China as a foreign source of intermediates occurred predominantly at the expense of domestic participation. Therefore, according to information in Figure 5.1, there are some signs of trade integration under the
12 The analysis carried out in this section partially follows the one described in Baldwin et al., 2013, to the specific
case of China.
13
logic of GVC for sectorial activity in Brazil. This fact, however, was largely a consequence of increased bilateral trade integration with China.
Figure 5.1 – Share of imported intermediates on total consumption of intermediates by sector in Brazil
(1995 vs 2011)
Source: WIOD. Authors’ elaboration
Brazilian economy, particularly in more technology-intensive sectors such as transport equipment, Chemical and Electrical and Optical equipment (Figure 5.1). Last, It’s worth mentioning that, over the same period period, there has been strong sectorial relocation of resources towards a greater specialization in the production of inputs related to services. In 2011, this sector accounted for about 50.1% of total production of intermediates in Brazil, above the international average of 48.5% (Figure 5.2, left panel). In 1995, the international average exceeded the Brazilian average by about four percentage points.
Figure 5.2 - Revealed Comparative Intermediate Production Advantage (RIPA) (year=2011)
Source: WIOD. Authors’ elaboration
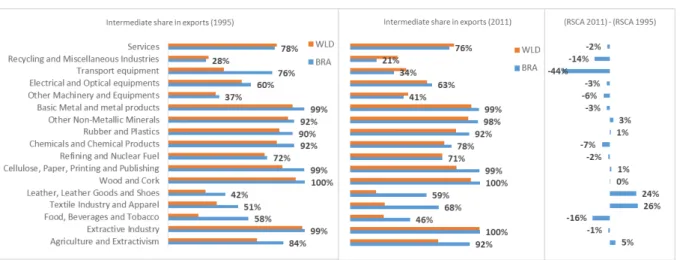
Figure 5.3 - Revealed Supply Chain Advantage (RSCA)
Source: WIOD. Authors’ elaboration
Considering the sectorial structural changes underway, the next question to be examined is whether Brazil's economy is moving “up” or “down” in value chains. It is generally said that a given sector has "moved up" (moved down) in a given value chain when it becomes more specialized in higher value-added (lower value-added) tasks.
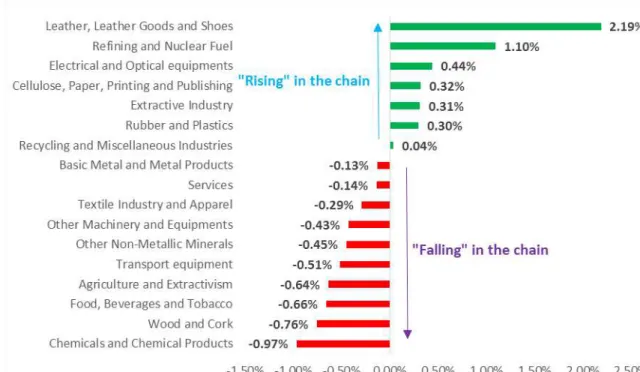
In Figure 5.4 it is possible to trace out how Brazilian sectors have evolved in terms of value added created per unit of output14 produced. It is expected that, at least in part, changes in the ratio of value added per unit of output may keep a correlation with structural changes in the production of intermediates for the Brazilian economy. In this regard, it is observed that the sector of Electrical and Optical equipments, which has witnessed a significant increase in the consumption of imported intermediates over the period 1995-2011, "moved up" in value chain. This fact suggests a move towards specialization in more sophisticated stages of production. Other equally sophisticated sectors, such as Transportation and Chemicals Equipments, have witnessed a decline in the ratio of value added created per unit of output produced, suggesting specialization in less "noble" stages of their respective value chains. The transportation equipment sector includes companies such as Embraer, which is deeply inserted into GVC. Other sectors that have experienced significant penetration of imported intermediates also "moved down" in their international supply chains, as seems to be the case of the Textiles and Apparel industries, which became relatively more specialized in less noble stages of their value chains. Finally, the services sector, which has strategic importance to the manufacturing industry, also showed loss of its value added per unit of output produced, suggesting specialization in less sophisticated stages of production.
14
Figure 5.4 – Average annual growth of value added per unit of output produced (1995-2011)
Source: WIOD. Authors’ elaboration
In summary, there seems to have signs of a progressive international productive integration for all sectors in Brazil, when it comes to the participation of imported intermediates in local industry consumption. This process has been more intensive in high-tech sectors of the Brazilian economy and the main source of imported intermediates has been China, which has gained ground at the expense of Brazil's local production of intermediates. Another relevant point is that Brazil’s economy seems to be developing revealed comparative advantages in the production of low-tech intermediates. Furthermore, when it comes to exports, the indicator on the revealed comparative advantage in supply chain (Figure 5.3) suggests that high-tech exporting sectors in Brazil have become more specialized in the exports of final goods whereas low-tech exporting sectors have become more specialized in the exports of intermediates. Finally, as long as structural changes underway have exerted some influence on the behavior of sectors in terms of value added per unit of output produced, technology-intensive sectors, such as Transport and Chemical Equipment, seem to have “moved down” towards greater specialization in less noble stages of the their value chains. An exception was the high-tech Electrical & Optical Equipment sector, which seems to have “moved up” towards greater specialization in tasks that generate higher value added per unit of output produced.
evidence showed in Timmer et al. (2013) for the case of Germany, it is very likely that the ongoing process of integration of the Brazil's economy detected at the sectorial level be, in the end, a net job creator. For a more rigorous analysis, however, the concept of value chain must be put into a broader perspective, taking into consideration the sectors both directly and indirectly involved in the production of a given final good. This is surely a promising and highly relevant research agenda for Brazil.
6. Public Policy Implications
The growth of global value chains has given new impetus to the debate on industrial policy in Brazil and worldwide. Old paradigms, such as the imperative of local consolidation of production chains or even the essentiality of high value added exports for sustainable long run growth have become increasingly challenged. For instance, current industrialization levels achieved by emerging Asian as well as Eastern European countries were fully based on the international fragmentation of production and the consequent increase in the foreign content embedded in their exports, resulting in less domestic value added per unit of exports. However, as already mentioned in the text, the significant price competitiveness achieved by exports in these economies, which are reflected in a significant increase in total volume exported, have enabled a progressive growth in their participation on the total value added generated by global exports.
Having recognized the growing importance of the integration of Brazil’s economy to global/regional value chains, local debate in the country has focused on the creation of public incentive mechanisms devoted to the development of domestic high value-added stages of production, particularly in sectors more prone to the creation of technological externalities, such as aerospace, electronics and telecommunications. An example of these kinds of public policies in Brazil was the creation of RECOF15, which allows tariff exemption of imported intermediates used in the exports of specific sectors as well as maximum efficiency in customs clearance procedures, a critical factor for “just in time” operation in global value chains. However, it is important to note that some other public policies currently under implementation by the Brazilian government, such as the exigency of local content requirements for specific sectors as well as other public incentives aiming to the consolidation of fully domestic production chains, seem to be conflicting with the very market-oriented logic of global value chains, which demands as more flexibility as possible on the choice of intermediate suppliers.
15
It seems not reasonable to believe on the existence of a single key requirement for the integration of a country into global value chains. However, there seems to exist a set of public policies that may help to create the necessary conditions for integration, according to the reality of each country, without being able, however, to assure their sufficiency. In the case of Brazil, the implementation of public policies of horizontal nature seems to be more important than industrial policies focused on the correction of market failures in specific sectors of the economy. Examples of such horizontal policies are those focused on the general reduction of high transaction costs in the country. In this regard, a set of important issues must be tackled by the government, such as: 1) a existing logistic infrastructure that gives clear signs of exhaustion, 2) the persistence of high import tariffs and non trade barriers to trade that seems to contribute to Brazil’s global trade isolation 3) the poor quality of the domestic business environment, and 4) the low level of education of country’s labor force.
Without denying the strategic importance of sectorial policies for sectors where there are clear signs of externalities to be encouraged, it is quite unlikely that they would reach the fullness of their objectives without a significant improvement in the country’s current overall business environment. In other words, when total factor productivity is low in the country, the expected social returns of sectorial policies tend to be low as well, mainly in sectors such as manufacturing, where over 67% of total domestic labor force involved in the production of a final good is located in other sectors of the economy, such as services (37.2%) and agriculture (29.6%)16. Therefore, the current government’s focus on sectorial policies in detriment of horizontal ones may prove to be misguided, even in the case where sectorial market failures could be clearly detected by policy makers, which is quite unlikely. On the other hand, policies devoted to improve systemic efficiency on the use of productive resources in the economy seem to be the ones to maximize expected social returns.
The next two subsections deal with two apparently necessary conditions to the integration of a country to global value chains, according to the recent empirical literature on global value chains: Trade facilitation and Preferential Trade Agreements.
16
6.1. The importance of trade facilitation for international trade in parts and
components
The latest ranking on the quality of logistics released by the World Bank (2014) puts Brazil at position 94 out of 160 countries, when it comes to the efficiency of customs. Best positioned than Brazil are the customs of smaller developing countries like El Salvador, Paraguay and Ecuador.
The empirical literature on the importance of delays for international trade is relatively recent and seeks to quantify the impact of time on trade flows. According to Djankov (2006), the impact of one day of delay can mean over 1% less of exports for a country. Nordas & Piermartini (2004) highlight the importance of time in global value chains, putting the quality of logistics in a country as a necessary condition to its integration into GVC, even more important than the reduction of import tariffs.
More recently, the influential work by Hummels et al (2013) developed a methodology for calculating the tariff equivalents of a “one day delay” at customs for more than 4000 products at the HS4 disaggregation level. According to author's estimates, each day of delay in transit may cost, on average, from 0.6% up to 2.1% of traded cargo’s value. Furthermore, Hummels et al (2013) points out that the sensitivity to delays for manufactured parts and components is about 60% higher compared to other products, such as standard commodities. The strong growth of global trade by air witnessed in recent decades seems to corroborate the estimates made by the authors17.
In Brazil, the average time spent on customs procedures at ports is about 17 days for imports and about 13 days for exports (World Bank, 2013). The average delays for clearance at ports in the United States, for instance, is about 5 days. Translated into an ad valorem equivalent, using estimates of per day costs of delays by Hummels et (2013) and bilateral trade flows for Brazil from WITS (World integrated Trade Solution, World Bank), total costs of delays at customs in Brazil may represent a additional tax of 13.04% on Brazil’s exports, and an additional protection barrier of 14.20% for imports in 2013. It is noteworthy that weighted average import tariffs in Brazil reached 7.80% in the same year.
Simulations conducted by Ferraz et al (2014a), through a dynamic computable general equilibrium model18, suggest that if delays at customs in the country were reduced by over 40% on average, there would be a positive impact on real GDP of around 2.3% per year by
17
Between 1965 and 2004, global trade by air grew 2.6 times faster than maritime trade.
18
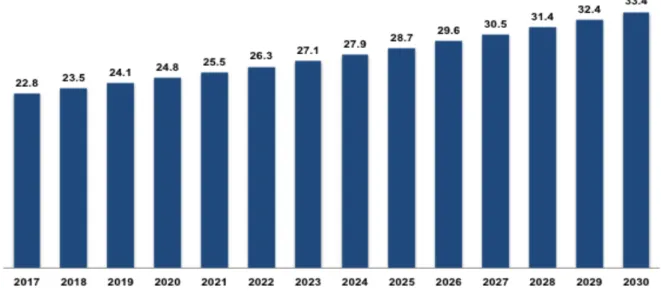
2030. Regarding countries’ performance on trade in manufactured goods, the impact would be positive by 26.5% for export volumes and by 11.64% for imports, by 2030. The reduction in delays at customs would also mean significant and increasing gains for the economy as a whole, as suggested by Figure 6.1.
Figure 6.1. Additional Cost Savings for Imports and Exports in Comparison to the Baseline Scenario
(US$bi, 2013)
Source: GDyn and authors’ elaboration
Finally, as manufactured goods tend to be relatively more benefited, there would be a tendency to increase the share of manufactured goods in Brazil’s total exports, apparently reverting the ongoing concentration in low-value added commodities.
6.2. Preferential Trade Agreements
According to Baldwin et al (2012), the possible channels through which a PTA can generate the necessary incentives to integration into GVC are: 1) reduction of import tariffs and 2) establishing of common disciplines in several areas such as investments, trade facilitation and technical barriers to trade as well as sanitary and phyto-sanitary measures (deep integration).
Considering that the empirical indications in the literature are causal and that Brazil is interested in strengthening their productive integration via the formation of PTA, which one of its trade partners should Brazil prioritize? A possible way to address this question is by extending the concept of "natural trading partners" that comes from the regional integration literature (Wonnacott and Lutz, 1989; Krugman, 1991; Venables, 2003; Ferraz, 2012). According to this literature, the formalization of preferential agreements with the most efficient suppliers (natural trade partners), at the expense of the less efficient ones, may result in trade creation (a social welfare improvement). When it comes to the logic of trade in value added, backward and forward linkage indicators may prove useful to the extension of this concept. In the case of the backward linkages, the higher the relevance of a given country as a source of intermediates to exports in Brazil (backward linkages), the greater the potential for the creation of an international supply chain involving Brazil. By the same token, but from the perspective of the use of exports of intermediates produced in Brazil, the greater the relevance of Brazil as a source of intermediates to be used in a given country’s exports (forward linkages), the greater the potential for the creation of an international supply chain involving Brazil (in this case as a seller of intermediate goods, rather than a buyer).
The decomposition of the two indicators for trade relations in Brazil can be seen in Figure 6.2 The left panel shows the backward linkages involving Brazil and a set of trade partners. It suggests that China, NAFTA and the EU account for over 54% of the foreign content in Brazil’s exports, and, on average, the most important region in the composition of the foreign content is the EU, with about 25%19. On the right panel (forward linkages), It can be seem that these same three regions receive on average more than 60% of the intermediate goods exported by Brazil. Again, the European Union stands out as the most important region, and it is the destination of almost 38% of the intermediates exported from Brazil.
The data presented in Figure 6.2 suggest that if policymakers in Brazil intend to encourage the formalization of preferential trade agreements as a way to incentivize the integration of Brazil into global value chains, the more likely (natural) partners to achieve this goal would be the
19
European Union, NAFTA region and China. These regions are also "natural partners" of Brazil if we consider the traditional Vinerian definition (Viner, 1950).20
Figure 6.2 - Decomposition by Region of Backward and Forward Linkages to Brazil (year = 2011)
Source: WIOD. Authors’ elaboration
The fact that the EU is a natural partner of Brazil, also under the logic of global value chains, generates even greater expectations about the possible conclusion of a PTA between Mercosur and the EU, currently under negotiation. Simulations of a PTA between the EU and Mercosur were analyzed in Ferraz et al. (2014b), through the use of a static computable general equilibrium model. For the specific issue of causality between PTA and GVC, the authors argue that the use of CGE models are generally more appropriate than traditional econometric analysis to tackle this problem, because the achievement of a PTA can be always characterized as an exogenous shock by construction. Therefore, the potential for integration into value chains was measured by a simulation of a hypothetical cut of 100% of bilateral trade tariffs and quotas between the countries of both blocs. Backward and forward linkages were measured before and after the simulation of the agreement. For the first indicator, the simulations suggest that the EU would increase its share in the imported content embedded in Brazil’s exports of manufactured goods from 24% to over 32%. On the other hand, for the second indicator, the fraction corresponding to the EU as a buyer of the intermediates exported by Brazil would increase from 32% to 37%.
20 It could be argued that the results are biased to the EU due to the fact that the database used has mostly
7. Final remarks
The analysis performed in this work translates the continuing evolution of the global unbundling of production into data and highlights the still modest participation of the Brazilian economy in this whole process. However, despite its low participation, some important lessons extracted from this ongoing process may prove useful to the current debate by policy makers in Brazil.
For the private sector in Brazil, the growing importance of GVC imposes a new strategic repositioning for companies that aim sustained competition in this new paradigm. Among others, the concept of productivity ceases to be local and must now be thought globally, meaning that local competitiveness becomes a function of other countries’ competitiveness, following the logic of specialization in different stages of production according to regional comparative advantages.
For the government and policy makers in Brazil, old dogmas such as the need to consolidate fully domestic production chains or even the essentiality of exporting high value added goods might now be questioned by the huge gains in competitiveness achieved by companies operating in a fragmented way along GVC. This strategy usually results in the creation of low value added per unit exported, due to the significant foreign content embedded in the exports of countries connected to international supply chains. However, competitive gains resulting from fragmentation are generally enormous, meaning much higher volumes of exports for connected countries. In the end, the fall in value added created per unit exported is offset by a higher volume of exports, resulting in an increase in the total factor income earned from exports. China and some eastern European countries such as Czech Republic, Hungary and Slovakia are perhaps paradigmatic examples of this strategy.
In the case of Brazil, the analysis is suggestive of an economy with shallow signs of integration to GVC as well as a manufacturing industry still very self-sufficient, given the intensive use of domestic intermediates and the relatively high value-added generated per unit exported. In this sense, the current productive structure in Brazil resembles the ones found in some developed countries such as the USA and Japan, but with productivity parameters by far below.
of foreign content embedded in their exports. Therefore, it seems crucial that policy makers in Brazil understand thoroughly, and realistically, the operating logic of these chains before suggesting any sector-specific policies that may eventually stop this process in favor of the local production of intermediates.
Finally, given the evident exhaustion of total factor productivity in Brazil, the insistence on sectorial industrial policies does not seem to be the most promising way to increase economic integration into GVC. In this regard, the focus on horizontal policies may prove a much more efficient path towards a more competitive and dynamic economy, helping to build a level playing field where resources may be better allocated. For instance, this study emphasized the importance of increasing the efficiency of ports and a move towards a more open economy through the formalization of PTA with "natural partners", taking the extended definition proposed in this work.
8. References
Antràs, P., Garicano, L., Rossi-Hansberg, E. 2006. Offshoring in a Knowledge Economy.
Quarterly Journal of Economics 121, no. 1: 31-77
Backer, K. De, Miroudot, S. 2013. Mapping Global Value Chains. OECD Trade Policy Papers, No. 159. Disponível em: http://www.oecd-ilibrary.org/trade/oecd-trade-policy-working-papers_18166873.
Baldwin, R.E., Lopez Gonzalez, J. 2013. Supply-Chain Trade: A Portrait of Global Patterns
and Several Testable Hypotheses. NBER Working Paper 18957.
Banco Mundial. 2014. Conecting to Compete: Trade Logistics in the Global Economy.
Disponível em:
http://www.worldbank.org/content/dam/Worldbank/document/Trade/LPI2014.pdf
Blyde, J, A Graziano, C Volpe Martincus. 2013. Economic Integration Agreements and
Production Fragmentation: Evidence on the Extensive Margin. Inter-American Development
Bank, unpublished document. Washington, DC.
Daudin, G., Rifflart, C., Schweisguth, D.. 2011. Who Produces for Whom in the World
Economy? Canadian Journal of Economics. 44 (4): 1403–37.
Djankov, S., Qian, Y., Roland, G., Zhuravskaya, E. 2006. Entrepreneurship in China and
Russia Compared. Journal of the European Economic Association, MIT Press, vol. 4(2-3),
Ferraz, L. P. C. 2012. Os Brics sob a Ótica da Teoria dos Acordos Regionais de Comércio. Texto para discussão IPEA.
Ferraz, L.P.C.; Gutierre, L.; Cabral, R. 2014a. Connecting to Global Value Chains. Work in
progress, CCGI-FGV.
Ferraz, L.P.C. 2014b. The Benefits of Trade Facilitation in Brazil and the Single Window
Program. Work in progress, CCGI-FGV.
Grossman, G., Rossi-Hansberg, E. 2006. The rise of offshoring: it is not wine for cloth
anymore. In The New Economic Geography: Effects and Policy Implications. Jackson Hole
Conference Volume, Federal Reserve of Kansas City, August, pp. 59-102.
Hayakawa, K., Yamashita, N. 2011. The Role of Preferential Trade Agreements (PTAs) in
Facilitating Global Production Networks. IDE Discussion paper No. 280.
Hummels, D. L., Schaur, G. 2013. Time as a Trade Barrier. American Economic Review, 103(7): 2935-59.
Hummels, D., Ishii, J., Yi, K.. 2001. The nature and growth of vertical specialization in world
trade. Journal of International Economics. 54, 75–96
Johnson, R. C., Noguera, G. 2012. Fragmentation and Trade in Value Added Over Four
Decades. NBER Working Paper No. 18186.
Johnson, R. C., Noguera, G. 2012a. Accounting for Intermediates: Production Sharing and
Trade in Value Added. Journal of International Economics, 86, 224–236.
Kohler, W. 2004. International outsourcing and factor prices with multistage production.
Economic Journal, Royal Economic Society, vol. 114(494), pages C166-C185, 03.
Koopman, R., Powers, W., Wang, Z., Wei, S. 2010. Give Credit Where Credit Is Due: Tracing
Value Added in Global Production Chains. NBER Working Paper No. 16426.
Koopman, R., Wang, Z., Wei, S.J. 2014. Tracing Value-Added and Double Counting in Gross
Exports. American Economic Review, 104(2): 459-94.
Krugman, P. R. 1991. Target zones and exchange rate dynamics. Quarterly Jounal of
Economics, 106, 669-682.
Los, B., Timmer, M.P., Vries, G.J. de. 2014. How Global are Global Value Chains? A New
Approach to Measure International Fragmentation. Journal of Regional Science,
Nordas, H.K., and R. Piermartini. 2004. Infrastructure and Trade. World Trade Organization. Staff Working Paper ERSD-2004-04.
OECD-WTO. 2012. Trade in Value-Added: Concepts, Methodologies and Challenges. Joint OECD-WTO Note. Disponível em: http://www.oecd.org/sti/ind/49894138.pdf .
Orefice, G., Rocha, N. 2011. Deep Integration and Production Networks: an Empirical
Analysis. WTO, Staff Working Paper ERSD-2011-11.
Stehrer, R. 2012. Trade in Value Added and the Value Added in Trade. WIOD Working Paper Nr. 8.
Timmer, M.P., Los, B., Stehrer, R. and Vries, G.J. de. 2013. Fragmentation, Incomes and Jobs. An analysis of European competitiveness. Economic Policy, 28, 613-661.
Venables, A. J. 2003. Winners and losers from regional integration agreements. Economic
Journal, Royal Economic Society, vol. 113(490), pages 747-761, October.