The Patient- And Nutrition-Derived Outcome
Risk Assessment Score (PANDORA):
Development of a Simple Predictive Risk
Score for 30-Day In-Hospital Mortality Based
on Demographics, Clinical Observation, and
Nutrition
Michael Hiesmayr1☯
*, Sophie Frantal2, Karin Schindler3, Michael Themessl-Huber2,
Mohamed Mouhieddine1, Christian Schuh2, Elisabeth Pernicka2, Stéphane Schneider4, Pierre Singer5, Olle Ljunqvist6, Claude Pichard7, Alessandro Laviano8, Sigrid Kosak1,
Peter Bauer2☯
1Department of Anaesthesiology, General Intensive Care and Pain Control, Division Cardiac-, Thoracic-, Vascular Anaesthesia and Intensive Care, Medical University Vienna, Vienna, Austria,2Center for Medical Statistics, Informatics and Intelligent Systems, Section for Medical Statistics, Vienna, Austria,3Medical Clinic III, Division Endocrinology, Medical University Vienna, Vienna, Austria,4Nutritional Support Unit, Pôle Digestif, Hôpital de l’Archet, Nice, France,5General Intensive Care Department, Rabin Medical Center University Hospital, Beilinson Campus, Petah Tiqwa, Israel,6Department of Surgery, Faculty of Medicine and Health, Örebro University, Örebro, Sweden,7Clinical Nutrition, Geneva University Hospital, Geneva, Switzerland,8Department of Clinical Medicine, University La Sapienza, Rome, Italy
☯These authors contributed equally to this work.
Abstract
Objective
To develop a simple scoring system to predict 30 day in-hospital mortality of in-patients ex-cluding those from intensive care units based on easily obtainable demographic, disease and nutrition related patient data.
Methods
Score development with general estimation equation methodology and model selection by P-value thresholding based on a cross-sectional sample of 52 risk indicators with 123 item classes collected with questionnaires and stored in an multilingual online database.
Setting
Worldwide prospective cross-sectional cohort with 30 day in-hospital mortality from the nutritionDay 2006-2009 and an external validation sample from 2012.
OPEN ACCESS
Citation:Hiesmayr M, Frantal S, Schindler K, Themessl-Huber M, Mouhieddine M, Schuh C, et al. (2015) The Patient- And Nutrition-Derived Outcome Risk Assessment Score (PANDORA): Development of a Simple Predictive Risk Score for 30-Day In-Hospital Mortality Based on Demographics, Clinical Observation, and Nutrition. PLoS ONE 10(5): e0127316. doi:10.1371/journal.pone.0127316
Received:January 8, 2015
Accepted:April 13, 2015
Published:May 22, 2015
Copyright:© 2015 Hiesmayr et al. This is an open access article distributed under the terms of the
Creative Commons Attribution License, which permits unrestricted use, distribution, and reproduction in any medium, provided the original author and source are credited.
Data Availability Statement:For interested parties data are available from the nutritionDay data center
[email protected] the Medical University Vienna upon request. The rules for data sharing and data transfer are published since 2010 athttp://www. nutritionday.org/en/researchers-scientists/
Results
We included 43894 patients from 2480 units in 32 countries. 1631(3.72%) patients died within 30 days in hospital. ThePatient-AndNutrition-DerivedOutcomeRiskAssessment (PANDORA) score predicts 30-day hospital mortality based on 7 indicators with 31 item classes on a scale from 0 to 75 points. The indicators are age (0 to 17 points), nutrient intake on nutritionDay (0 to 12 points), mobility (0 to 11 points), fluid status (0 to 10 points), BMI (0 to 9 points), cancer (9 points) and main patient group (0 to 7 points). An appropriate model fit has been achieved. The area under the receiver operating characteristic curve for mortali-ty prediction was 0.82 in the development sample and 0.79 in the external
validation sample.
Conclusions
The PANDORA score is a simple, robust scoring system for a general population of hospi-talised patients to be used for risk stratification and benchmarking.
Introduction
Hospitals are major providers of health care services and may consume up to 50% of the na-tional health care budget. Variability in services provided, differences in outcome, and resource utilization are major concerns [1]. Prognostic information about patients is important to evalu-ate the effectiveness of services provided in the health care system [2] and to compare treat-ment approaches as well as hospitals [3,4]. Publicly disclosed mortality figures for individual hospitals may not offer a fair comparison between institutions because of the difficulties in ad-justing for the case-mix [5–8]. Thus the estimates of severity of illness may not be comparable between hospitals and more so between countries. The usefulness of such public disclosure has been challenged because of poor association with quality [6], selection bias [5], sensitivity to coding practice [7,9], type of standardisation[10], and missing transparency of models [11].
The data source used in such benchmarking efforts may affect the result. Administrative data, e.g. accounting data [12] are easily available but accuracy depends on local coding prac-tice[13] whereas case note extraction [14] and specific data collection is time and resource con-suming. In addition administrative data are only available after discharge when International Classification of Diseases codes (ICD-10) [15] have been assigned to patients. Case-mix adjust-ment is either done by regression analysis within diagnostic groups [3], by using the Charlson Comorbidity Index [12] or adding Current Procedural Terminology codes in the surgical field [16]. When applying such scores to external samples, estimation of mortality may be poor and often necessitates recalibration, e.g. to regions or countries [17]. Some of the models for case-mix adjustment for general populations of hospitalised patients are not disclosed by the com-mercial providers working with administrative[18] or case note[14] data., making it a“black box”[11]. This“black box”and inclusion of 28 to 95% of patients admitted during the observa-tion period [19] obscures understanding of institutional strength and weakness.
Predictive models have been extensively used in acute care such as medical emergency ad-missions[20], intensive care admissions [21,22] or specific acute conditions such as stroke, acute coronary syndrome [23], heart failure [24] or pneumonia. In addition to predict death, risk models are widely used to predict complications such as bleeding or nosocomial infections in specific situations. Prognostic models for acute care situations always include either several
Funding:The nutritionDay project was funded by the Medical University Vienna, The Austrian Society for Clinical Nutrition (AKE) and the European Society of Clinical Nutrition and Metabolism (ESPEN). The authors received no specific funding for this work.
vital signs typically obtained from monitors, electrocardiograms or imaging information, bio-marker or procedural characteristics. This information is missing in a large proportion of pa-tients even in medical emergency departments [25]. There is no prognostic model quantifying the risk in the population of hospitalised patients as a whole—excluding ICU-patients—by a single scoring system.
The aim of this study was to develop a prognostic model and to derive a single prognostic score for 30-day in—hospital mortality of in-patients excluding ICU-patients that are already covered by specific systems [21,22,26–29]. The elements of such a predictive score should be easily obtainable from the patient’s history, interview, and direct observation at any time dur-ing hospitalisation, even before a definitive diagnosis is known. To that end we used the data from the nutritionDay survey which uses cross-sectional samples from different years and countries with a focus on robustly available information on patient characteristics and nutrition.
Methods
Study design
The PANDORA scoring system to predict 30-day in-hospital mortality of adult hospitalised patients was developed in a three-step process based on variable selection, parameter estima-tion, and score validation that followed the PROGRESS suggestions [2].
Population
For development of the score, we used the data from four cross-sectional data collections, the
“nutritionDay”2006–2009 [30] (www.nutritionday.org) surveys held on 19.01.2006,
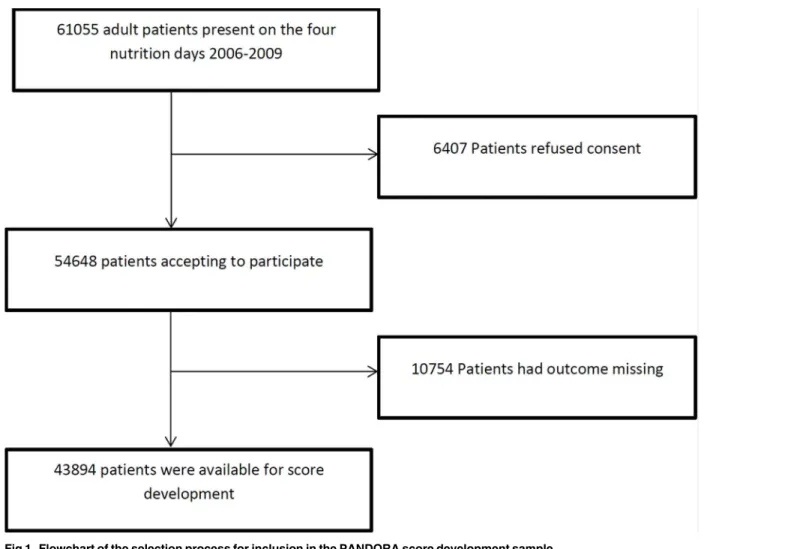
25.01.2007, 31.01.2008, and 29.01.2009. The nutritionDay study is a survey for hospital wards (ICU patients were not included) with voluntary participation and registration via an open web based application. In total, 61055 patients were present in the participating wards during the four surveys (Fig 1). The nutritionDay survey collected simple demographic data, including patients’preadmission nutrition history, organs affected, comorbidities, mobility, simple indi-cators of intensity of care and actual nutrition intake. The main outcome parameter prospec-tively collected was patient’s status (death, transferred to another hospital, transferred to long-term care, discharged home) at discharge until 30 days after nutritionDay. The relationship be-tween nutrition related risk factors and death was one of the main goals of the study[30].
No specific measurement or specialised knowledge was necessary for data acquisition. One to two workdays were necessary to obtain and disseminate information about the survey, download and distribute questionnaires to patients, collect medical information, and enter data in the multilingual online database for 20–30 patients per ward. The only incentive to par-ticipate was to receive a summary report for the individual unit in comparison with similar wards. The nutritionDay project was approved by the Ethical Committee of the Medical Uni-versity Vienna (EC number, 407/2005) and by local ethical committees (S1 Table) if required by national rules. The database is open upon request along the“Guidelines for Project
submis-sion”at
http://www.nutritionday.org/en/researchers-scientists/researchers-scientists/publish-nday-results/index.htmlfor interested parties that submit a research protocol to
process. Overall, 3.3% of extractable data were missing and were therefore imputed. Multivari-ate imputation of missing data was done by using predictive mean matching using the aregIm-pute and transcan algorithm in R [31].
To avoid patient selection, we based the score on the imputed data set, because hospital mortality in patients with missing values was noticeably higher than that in complete cases (5.2% vs. 2.6%). Nevertheless, a sensitivity analysis for score development based on the non-missing fraction of the non-imputed data was done.
Variable selection
First, to achieve a simple coding system in the final score, we divided most metric variables such as age, length of hospital stay, and BMI into categories. The cut-points were chosen ac-cording to existing proposals (World Health Organization for BMI, 10-years age groups) or simplicity (e.g. duration of stay in hospital more or less than 2 weeks). The categorical variable
“food intake”was highly correlated between breakfast, lunch, and dinner. To keep the score simple, we included only the main meal for score development. Hence, 52 variables with 123 item classes were used for score development (S2 Table).
In a second step, to achieve a reasonable number of items assuring convergence in the follow-ing multivariate models, a pre-screenfollow-ing by univariate generalized estimatfollow-ing equations for
Fig 1. Flowchart of the selection process for inclusion in the PANDORA score development sample.
“death in hospital within 30 days”were performed. Clinical wards were considered as repeated factor to account for the clustering of patients. Only variables which show an association with mortality with a p-value<0.2 were included in multivariate modelling. Based on this crude
pre-selection a multivariate generalized estimating equations approach (clinical wards as repeated factor) was applied for model building (SAS Procedure genmod). A smaller than usual local sig-nificance level of 0.01 was applied to select the variables for the final model because it is known that model selection by multiple p-value thresholding may serve as a consistent model selection procedure if the threshold for the individual p-values is decreased for increasing sample sizes [32]. Since consistency over time is an important issue we added an additional criterion for vari-able selection to derive a stvari-able small prognostic model. The previously described selection pro-cess was applied to the subsamples of the four years 2006–2009. To account for the smaller sample sizes in the annual subsamples the threshold for including a variable into the model has been increased to 0.05. Variables were only included in the small prognostic model if selected in all four annual subsamples. To investigate the impact of such a very conservative selection criteri-on, we repeated model selection without the stability criterion over calendar time and compared the performance between the resulting extended model and the basic model.
Parameter estimation / Construction of the Score
The parameters for the final score were then estimated by another multivariate generalized esti-mating equation model including only the independent variables selected in the step before. The final coefficients for the score were determined by multiplying by 10, rounding to the next integer toward the origin, and thus providing easily usable numbers and potentially improving prediction [33].
Validation of the score
We assessed the performance of the score by using standard measures as the maximum R2 (Max R2), aROC, Brier score, and Hosmer-Lemeshow goodness-of-fit C-statistic[34].
Corresponding score estimates from 500 bootstrap samples randomly drawn (with replace-ment) from the development sample were used to calculate Harrell’s optimism. The whole model building process was repeated for each bootstrap sample. Every constructed model was validated in the bootstrap sample and the original sample. The mean difference serves as an es-timator of the optimism [35].
The performance of the score was also investigated in an external validation sample from nutritionDay 2012 (N = 12928), which was available after score development from the data of 2006–2009.
Sensitivity analyses
As a sensitivity analysis we repeated variable selection and score estimation based on a data set including only patients with complete data. In a second sensitivity analysis all units with less than 95 percent of outcome data were excluded and a separate imputation of missing data was performed in this subsample. Furthermore we looked how the score derived from the imputed data set performs in the patients without missing values, either in the development or in the validation sample.
Programs
Results
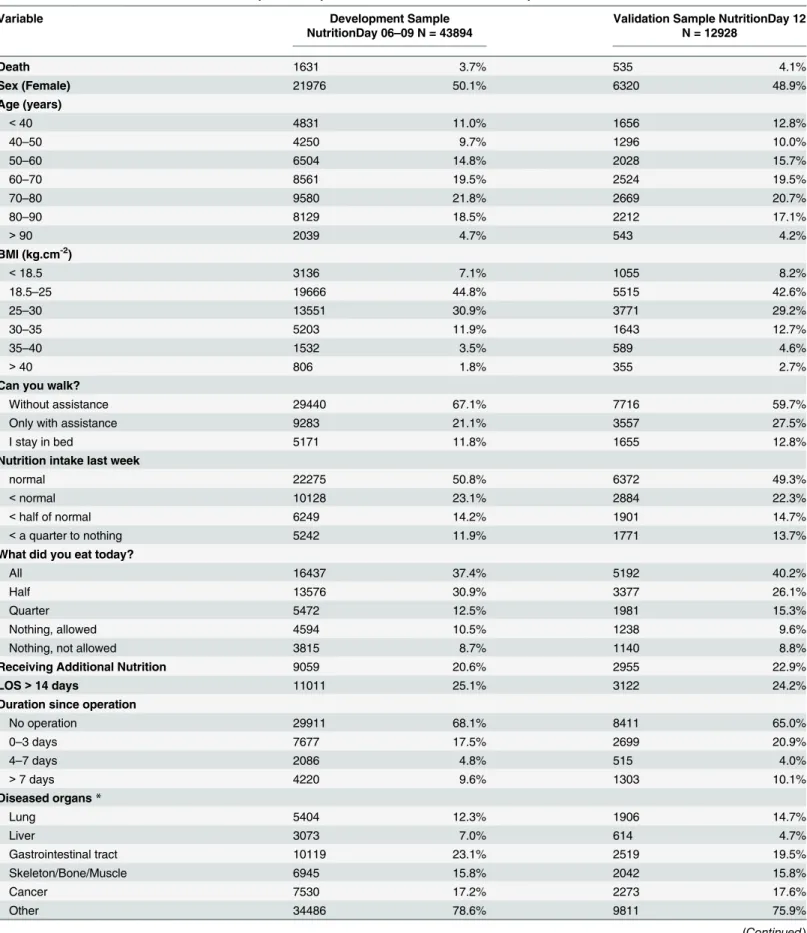
The development sample (2006–2009) included 43894 patients from 2480 wards participating in an individual year; 1631 patients (3.72%) died in the hospital within 30 days after nutrition-Day. The median (lower quartile; upper quartile) of the observed time between hospital admis-sion and death was 24 (14; 36). The validation sample from the year 2012 included 12928 patients. InTable 1the distributions of the variables selected in the PANDORA or in the ex-tended score out of the 52 candidates are described for both samples together with the geo-graphical region and comorbidities.
The PANDORA score
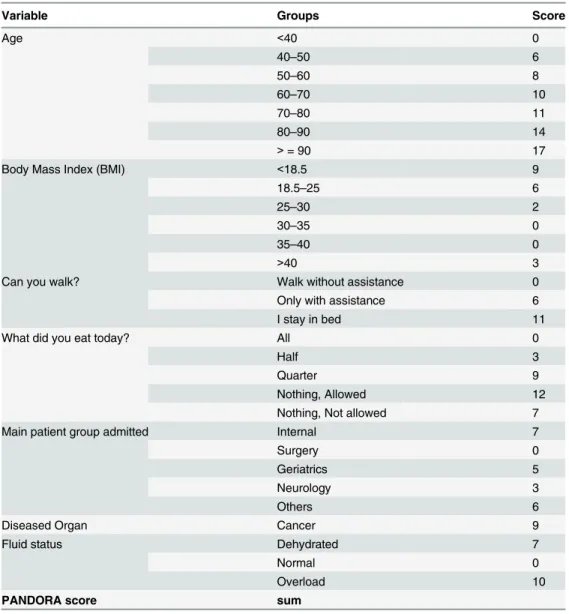
The resulting PANDORA score (Table 2) was based on 7 indicators with 31 item classes. The score is built by summing the individual item values (Table 2) and has a theoretical minimum of 0 and a maximum of 75. The minimum observed value was 0, and the maximum observed value was 71 with a mean of 26.4 ± 11.2 (SD). Three indicators were provided by physicians and nurses, and four were provided by the patients. All selected variables contributed substan-tially to the PANDORA score.
The relationship between the PANDORA score and hospital mortality within 30 days is given by the equation: logit of death = -6.72 + 0.1058 x PANDORA score, and the probability of death is given by the equation: Probability of death = elogit/ (1+elogit).
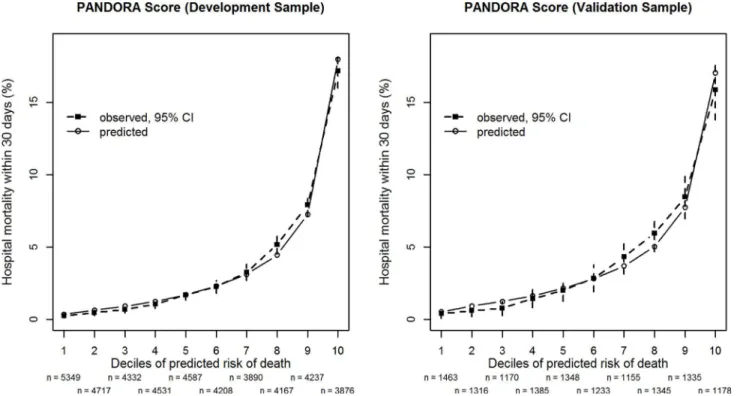
The average discriminatory capability of the model, as measured by aROC, was 0.817 in the development sample. Max-rescaled R2was 0.187 and the Brier score was 0.033. For all score deciles there was good agreement between observed and predicted mortality in the develop-ment sample and the external validation sample (Fig 2). The Hosmer-Lemeshow test for pre-dicted mortality in deciles of expected risk indicated a lack of fit (C-statistic,
chi-square = 18.38, df = 8, p = 0.02). However, due to the large sample size, even relatively small de-viations between actual and estimated mortality (Fig 2) would result in small p-values. The op-timism-corrected results were similar, the aROC was then 0.815, the max-rescaled R² was 0.183 and the Brier score was almost the same as before.
Multi-collinearity was no problem at all. The correlations between predictors were surpris-ingly low to moderate and we had no problems with collinearity in the multivariate analysis with any of the 500 bootstrap samples. When adding the two-fold interactions among the seven variables none of them succeeded to contribute to the model in a consistent way over the years. None of the interactions resulted in a p-value lower than 0.1 in all four
years simultaneously.
In the external validation sample 12928 patients were available. Surprisingly, the Hosmer-Lemeshow test (C-statistic, chi-square = 12.84, df = 8, p = 0.12) in the smaller external valida-tion sample did not indicate any noticeable lack of fit (see alsoFig 2). The area under the ROC was 0.787, Max-rescaled R² was 0.149 and the Brier score was 0.037.
Table 1. Distribution of variables for the development sample 2006–2009 and the validation sample 2012.
Variable Development Sample
NutritionDay 06–09 N = 43894
Validation Sample NutritionDay 12 N = 12928
Death 1631 3.7% 535 4.1%
Sex (Female) 21976 50.1% 6320 48.9%
Age (years)
<40 4831 11.0% 1656 12.8%
40–50 4250 9.7% 1296 10.0%
50–60 6504 14.8% 2028 15.7%
60–70 8561 19.5% 2524 19.5%
70–80 9580 21.8% 2669 20.7%
80–90 8129 18.5% 2212 17.1%
>90 2039 4.7% 543 4.2%
BMI (kg.cm-2)
<18.5 3136 7.1% 1055 8.2%
18.5–25 19666 44.8% 5515 42.6%
25–30 13551 30.9% 3771 29.2%
30–35 5203 11.9% 1643 12.7%
35–40 1532 3.5% 589 4.6%
>40 806 1.8% 355 2.7%
Can you walk?
Without assistance 29440 67.1% 7716 59.7%
Only with assistance 9283 21.1% 3557 27.5%
I stay in bed 5171 11.8% 1655 12.8%
Nutrition intake last week
normal 22275 50.8% 6372 49.3%
<normal 10128 23.1% 2884 22.3%
<half of normal 6249 14.2% 1901 14.7%
<a quarter to nothing 5242 11.9% 1771 13.7%
What did you eat today?
All 16437 37.4% 5192 40.2%
Half 13576 30.9% 3377 26.1%
Quarter 5472 12.5% 1981 15.3%
Nothing, allowed 4594 10.5% 1238 9.6%
Nothing, not allowed 3815 8.7% 1140 8.8%
Receiving Additional Nutrition 9059 20.6% 2955 22.9%
LOS>14 days 11011 25.1% 3122 24.2%
Duration since operation
No operation 29911 68.1% 8411 65.0%
0–3 days 7677 17.5% 2699 20.9%
4–7 days 2086 4.8% 515 4.0%
>7 days 4220 9.6% 1303 10.1%
Diseased organs*
Lung 5404 12.3% 1906 14.7%
Liver 3073 7.0% 614 4.7%
Gastrointestinal tract 10119 23.1% 2519 19.5%
Skeleton/Bone/Muscle 6945 15.8% 2042 15.8%
Cancer 7530 17.2% 2273 17.6%
Other 34486 78.6% 9811 75.9%
the contribution of the correlated variable age decreased to a maximum of 13 points. It should be noted that applying the PANDORA score (Table 2) to the non-missing data sample show a good discriminatory performance in the development (n = 25307, aROC = 0.821) as well as in the validation sample (n = 5187, aROC = 0.824).
In the second sensitivity analysis excluding units with less than 95 percent outcome data (n = 35046) resulted in an aROC of 0.819 in the development sample. In the external validation sample (n = 11422) the value of the aROC was 0.776. Minor changes in the score were observed and again the BMI was not selected.
The extended score
The extended score (S3 Table) constructed by leaving out the rigid criterion of including vari-ables only if selected in all 4 calendar years of the development sample was based on 11 indica-tors with 51 item classes. The score now had a theoretical minimum of -5 and a maximum of 85. The minimum observed value was -3, and the maximum observed value was 72 with a mean of 25.7 ± 11.3(SD). Six indicators were provided by physicians and nurses, and five were provided by the patients, for the distribution of the variables in the development and validation
Table 1. (Continued)
Variable Development Sample
NutritionDay 06–09 N = 43894
Validation Sample NutritionDay 12 N = 12928
Comorbidity*
Cardiac Insufficiency 4679 10.7% 1419 11.0%
Diabetes I/II 7155 16.3% 2484 19.2%
Stroke 2070 4.7% 665 5.1%
COPD 2388 5.4% 830 6.4%
Myocardial infarction 1744 4.0% 414 3.2%
Other 15150 34.5% 5791 44.8%
Fluid Status
Dehydrated 3942 9.0% 1116 8.6%
Overhydrated 4790 10.9% 1577 12.2%
Normal 35162 80.1% 10235 79.2%
Speciality of Ward
Internal 13919 31.7% 4504 34.8%
Surgery 21653 49.3% 6285 48.6%
Geriatrics 2781 6.3% 1030 8.0%
Neurology 1514 3.5% 156 1.2%
Others 4027 9.2% 953 7.4%
Regions
Central Europe 19867 45.3% 1237 9.6%
Northern Europe 3283 7.5% 620 4.8%
Southern Europe 7998 18.2% 2422 18.7%
Western Europe 6601 15.0% 2441 18.9%
Eastern Europe 2567 5.8% 106 0.8%
America 582 1.3% 3318 25.7%
Eastern Mediterranean 680 1.6% 895 6.9%
Western Pacific/SE Asia 2316 5.3% 1889 14.6%
sample (seeTable 1). Note that the shared variables in the PANDORA and extended score showed very similar contribution in both scores (Table 2andS3 Table).
The extension of the score slightly improved the performance as compared to the PANDO-RA score: the area under the ROC was 0.832, Max-rescaled R² was 0.206 and the Brier score was 0.033. Again, the Hosmer-Lemeshow test (C-statistic, chi-square = 25.80, df = 8, p = 0.001) indicated some lack of fit in the large development sample. In the external validation sample the value for the aROC was 0.796, Max-rescaled R² was 0.165 and the Brier score 0.037. It is worth to note that the Hosmer-Lemeshow test (C-statistic, chi-square = 12.08, df = 8, p = 0.15) again did not indicate any noticeable lack of fit in the smaller external validation sample (S1 Fig).
Table 2. PANDORA additive score values to predict 30 day hospital mortality*.
Variable Groups Score
Age <40 0
40–50 6
50–60 8
60–70 10
70–80 11
80–90 14
>= 90 17
Body Mass Index (BMI) <18.5 9
18.5–25 6
25–30 2
30–35 0
35–40 0
>40 3
Can you walk? Walk without assistance 0
Only with assistance 6
I stay in bed 11
What did you eat today? All 0
Half 3
Quarter 9
Nothing, Allowed 12
Nothing, Not allowed 7
Main patient group admitted Internal 7
Surgery 0
Geriatrics 5
Neurology 3
Others 6
Diseased Organ Cancer 9
Fluid status Dehydrated 7
Normal 0
Overload 10
PANDORA score sum
*The relationship between the PANDORA score and hospital mortality within 30 days is given by the equation: logit = -6.72 + 0.1058 x PANDORA score. The probability of death is given by the equation: Probability of death = elogit/ (1+elogit).
Discussion
We developed a basic scoring system for hospitalised patients to predict in-hospital death with-in 30 days from data of the nutritionDay survey (Table 2). The strength of the resulting PAN-DORA score, besides the model fit, is its simplicity. The seven variables entering the score do not require specialist knowledge. The score allows quantifying what is usually considered as the clinical impression of a patient staying in hospital: age, mobility, food intake, hydration sta-tus or oedema. In addition the specialty of the ward where the patient is staying and the pres-ence of cancer add to the risk of death. Furthermore, the score does not require any procedural or health care system associated variables.
The large international sample of hospitalised patients from the nutrition Day survey has sev-eral advantages for the development of a prognostic score. Harmonised data have been collected prospectively in many countries, thus preventing a strong effect of particular national healthcare policies. Compared with administrative data no bias associated with local coding practice was foreseen. The spectrum of patients available for analysis is large because 18 different medical spe-cialties participated. The barriers for participation in the study were lowered by providing ques-tionnaires in 25 national languages, requesting no fee, and protecting the ward’s anonymity.
We chose a rigid model selection procedure based on a very large sample with an additional criterion of stability of selection over individual calendar years: Predictors were included into the model only when they contributed in a consistent and statistically convincing way.
Fig 2. Observed and predicted hospital mortality by the PANDORA score.Patients are grouped by decile-classes of predicted in-hospital mortality within 30 days after the cross-sectional survey derived from the PANDORA score for the development sample (left panel) from the years 2006–2009 (n = 43894) and the external validation sample (right panel) from the year 2012 (n = 12928). The numbers of patients in each decile (n) are given below the x-axis. Closed symbols (&) show observed mortality with 95% confidence intervals (CI) whereas open symbols (⦿) show predicted mortality. The PANDORA score has 7 indicator variables (Table 2).
The performance of the score with an aROC of 0.82 in the development sample and 0.79 in the external validation is not noticeably inferior to that in the specific scoring systems commonly used in intensive care[21,22,26–29]. We are convinced that this performance is satisfactory when considering the simplicity of our predictor variables as compared to the large set of physiological variables routinely available for prediction in ICU-patients. Overall there was an appropriate agreement between predicted an observed mortality in the development and particularly in the external validation sample. Note, that the external validation sample, although collected“ inter-nally”in the long term nutritionDay survey, had a quite different geographical distribution than the development sample (Table 1).
Not surprisingly the fit tends to be poorer for very large predicted mortalities, which is only covered by a limited number of patients. Consequently, the score is somehow dominated by patients with moderate to low risk. It is worth noting that for high predicted mortalities an in-crease of one point in the PANDORA score is associated with a much larger inin-crease in pre-dicted mortality than a one point increase for low prepre-dicted mortality. This also aggravates the problems of achieving a perfect fit in high risk patients. One of the problems of such scores is stability over time. By our way of constructing the PANDORA score we only included variables that significantly contributed to the models developed separately in each of the four calendar years 2006 to 2009. A further indication for stability over time is the good fit in the delayed ex-ternal validation sample from the year 2012.
We also calculated an extended score by dropping the rigid condition of consistency in vari-able selection over the individual calendar years. This score is based on 11 varivari-ables. The new variables entered in the extended score are duration since hospital admission, having well eaten during last week, receiving additional nutrition, sex and affected organs. Only a small improve-ment of the performance with an aROC of 0.83 in the developimprove-ment sample and 0.80 in the ex-ternal validation sample has been observed. This indicates that the PANDORA score is performing sufficiently as compared to the“extended”score which requires the collection of five additional variables covering also some procedural and health care related aspects without achieving any noticeable improvement in prediction and fit.
One of the further strengths of the scores developed in the context of the nutritionDay sur-vey is the possibility of regular updates resulting from recent data. It is to be expected that the simple variables entering the scores will not be changed in future surveys.
Another problem to be considered is whether the score would perform adequately when it is applied routinely outside the nutritionDay survey. We cannot supply any data on that issue but conjecture that due to the simplicity of the variables particularly in the PANDORA score no noticeable bias from external use should arise.
There are some weaknesses connected with the score. In the nutritionDay project the focus was on simple items typically included in patient’s medical history, items associated with out-come and items included in existing screening scores for malnutrition[37,38]. An additional criterion was that items could be obtained from patients and caregivers without extensive train-ing or expert knowledge. Therefore, no physiological or laboratory variables of the patients were available to be used for risk analysis. We believe that this weakness turns out as strength of the score, which solely is based on simple and easily accessible variables, and can also be used in countries with insufficient health-system capacity. However, this specific data structure inevitably does not allow the calculation of other scores such as the Charlson Comorbidity Index [12] from our data to allow comparison with the PANDORA score.
We cannot exclude the possibility that some units deliberately included patients with nutri-tion problems because of the weight given to nutrinutri-tion in the survey.
A further weakness of the study is the large number of patients with missing outcome data. However, a sensitivity analysis including only wards with documented outcome in more than 95 percent of their patients did not noticeably change the prediction.
We cannot estimate the effect of imputing missing values on score development, but we per-formed a sensitivity analysis with only patients who had complete values, and that analysis yielded a similar selection, weight of items and performance. Moreover the PANDORA score shows good performance when applied only to the subsample of complete cases in the develop-ment as well as in the validation sample.
A further concern is that only short term outcome was recorded in this study. To this end it is important to note, that due to the cross-sectional sampling and outcome recording 30 days after the sampling day the time from hospital admission until death of in-patients varied between 1 and 202 days. A proportion of 35% of death has been observed after a hospital stay of more than 30 days. Thus, the score also includes deaths after 30 days in hospital. Since also widely used ICU-scores[21,22,26–29] are restricted to 30 day hospital mortality, we be-lieve that the simple, easily applicable PANDORA score for non-ICU patients in hospitals may be considered as a valuable instrument for risk stratification and benchmarking. We commit, that studying the performance of the score in a variety of treatment venues will be necessary to evaluate its utility and may lead to a customization of the score to different environments.
In the nutritionDay project transfer to long-term care was another possible outcome. This type of outcome was predicted by a different pattern of variables not including any nutrition related factors. Age was the dominant factor and“dependency on help”and“brain and nerves being affected”turned out as additional predictors. Therefore we did not consider to analyse a composite outcome criterion.
To our surprise, we found that functional status [39], such as mobility and nutrition[40] were of major importance. Reduced mobility has recently also been included in the Simple Clinical Score for medical emergency patients in addition to vital signs [25]. Both poor nutri-tion and reduced mobility could be consequences of the disease process, but they may have health-related effects of their own. It is probable that nutrition-related factors are surrogates for unobserved patient characteristics that directly cause death.
The seven items selected for the PANDORA score cannot be compared in any meaningful way to the 500 key clinical findings extracted from medical records by the Medical Illness Se-verity Grouping System [41], in which 85 primary diagnoses accounted for 80% of deaths [18]. These findings have been supplanted by 56 primary diagnoses in the Dr Foster Intelligence da-tabase [3,7], or the 17 Charlson comorbidities derived from ICD-10 codes [42]. There is no need to recalculate the score in each diagnostic category, as is done in the Dr Foster Intelligence System [7], because major indicators related to medical specialty or organs affected are
already included.
In summary, we propose a very simple, robust scoring system (PANDORA) with a surpris-ingly high performance in predicting in-hospital mortality with three strengths. First, our ap-proach is based on the data available at any time during hospitalisation; second, little
Supporting Information
S1 Fig. Comparison of the performance of the PANDORA score and the extended score.
Observed mortality versus predicted mortality. The data points represent observed mortalities (%) with 95% confidence intervals in the ten deciles of predicted mortality (%). The upper pan-els represents the development sample from the years 2006–2009 and the lower panels the ex-ternal validation sample from 2012. The left panels’show the result for the PANDORA score with 7 indicator variables (Table 2), the right panels those for the extended score with 11 indi-cator variables (S3 Table).
(TIF)
S1 Table. List of countries with approving ethical committees.
(DOCX)
S2 Table. Indicator variables and item classes used for score development.Reference catego-ries are marked in bold characters.
(DOCX)
S3 Table. Extended additive score values to predict 30 day in-hospital mortality.The rela-tionship between the extended score and in-hospital mortality within 30 days after the day of the cross-sectional survey is given by the equation: logit = -6.79 + 0.1091 x extended score. The probability of death is given by the equation: Probability of death = elogit/ (1+elogit).
(DOCX)
Acknowledgments
The study was funded by Medical University of Vienna (www.meduniwien.ac.at), the Austrian Society for Clinical Nutrition (www.ake-nutrition.at) and European Society of Clinical Nutri-tion and Metabolism (ESPEN,www.espen.org). We thank Mary McKinney for editing the manuscript. Funding for editing was provided by the Medical University of Vienna.
Author Contributions
Conceived and designed the experiments: MH KS PB AL SS CP OL PS CS MM. Performed the experiments: MH KS AL SS CP OL PS SK. Analyzed the data: PB MTH SF EP. Contributed re-agents/materials/analysis tools: MM CS SF MTH PB. Wrote the paper: MH PB PS OL CP SS AL KS.
References
1. NHS. Right Care NHS Atlas of Variation in Healthcare 2013http://www.rightcare.nhs.uk/index.php/ atlas/atlas-of-variation-2011/. Accessed 2014 Dec 22.
2. Steyerberg EW, Moons KG, van der Windt DA, Hayden JA, Perel P, Schroter S, et al. Prognosis Re-search Strategy (PROGRESS) 3: prognostic model reRe-search. PLoS medicine. 2013; 10:e1001381. doi: 10.1371/journal.pmed.1001381PMID:23393430
3. Intelligence DF. Dr. Foster Hospital Guide 2013. Dr. Foster Intelligence, 2013.
4. NHS. Consultant outcome data: NHS; 2014https://www.nhs.uk/service-search/performance/ Consultants#view-the-data. Accessed 2014 Dec 22.
5. Lilford R, Mohammed MA, Spiegelhalter D, Thomson R. Use and misuse of process and outcome data in managing performance of acute medical care: avoiding institutional stigma. Lancet. 2004; 363:1147– 54. PMID:15064036
7. Mohammed MA, Deeks JJ, Girling A, Rudge G, Carmalt M, Stevens AJ, et al. Evidence of methodologi-cal bias in hospital standardised mortality ratios: retrospective database study of English hospitals. BMJ. 2009; 338.
8. Leonardi MJ, McGory ML, Ko CY. Publicly available hospital comparison web sites: determination of useful, valid, and appropriate information for comparing surgical quality. Archives of surgery. 2007; 142:863–8; discussion 8–9. PMID:17875841
9. Bottle A, Jarman B, Aylin P. Hospital Standardized Mortality Ratios: Sensitivity Analyses on the Impact of Coding. Health Services Rresearch. 2011; 46(6 Pt 1:):1741–61. doi:10.1111/j.1475-6773.2011. 01295.xPMID:21790587
10. Pouw ME, Peelen LM, Lingsma HF, Pieter D, Steyerberg E, Kalkman CJ, et al. Hospital standardized mortality ratio: consequences of adjusting hospital mortality with indirect standardization. PloS one. 2013; 8:e59160. doi:10.1371/journal.pone.0059160PMID:23593133
11. Iezzoni LI. 'Black box' medical information systems. A technology needing assessment. JAMA. 1991; 265:3006–7. PMID:2033775
12. Sundararajan V, Quan H, Halfon P, Fushimi K, Luthi JC, Burnand B, et al. Cross-national comparative performance of three versions of the ICD-10 Charlson index. Med Care. 2007; 45:1210–5. PMID: 18007172
13. Mohammed MA, Stevens AJ. A simple insightful approach to investigating a hospital standardised mor-tality ratio: an illustrative case-study. PloS one. 2013; 8:e57845. doi:10.1371/journal.pone.0057845 PMID:23472111
14. Iezzoni LI, Ash AS, Shwartz M, Daley J, Hughes JS, Mackiernan YD. Predicting who dies depends on how severity is measured: implications for evaluating patient outcomes. Ann Intern Med. 1995; 123:763–70. PMID:7574194
15. WHO. International Classification of Diseases. 1990. Available:http://www.who.int/classifications/icd/ en/. Accessed 2014 Dec 22.
16. Raval MV, Cohen ME, Ingraham AM, Dimick JB, Osborne NH, Hamilton BH, et al. Improving American College of Surgeons National Surgical Quality Improvement Program risk adjustment: incorporation of a novel procedure risk score. Journal of the American College of Surgeons. 2010; 211:715–23. doi:10. 1016/j.jamcollsurg.2010.07.021PMID:20846884
17. Metnitz B, Schaden E, Moreno R, Le Gall JR, Bauer P, Metnitz PG, et al. Austrian validation and cus-tomization of the SAPS 3 Admission Score. Intensive Care Med. 2009; 35:616–22. doi:10.1007/ s00134-008-1286-2PMID:18846365
18. Jarman B, Gault S, Alves B, Hider A, Dolan S, Cook A, et al. Explaining differences in English hospital death rates using routinely collected data. BMJ. 1999; 318:1515–20. PMID:10356004
19. Shahian DM, Wolf RE, Iezzoni LI, Kirle L, Normand SL. Variability in the measurement of hospital-wide mortality rates. N Engl J Med. 2010; 363:2530–9. doi:10.1056/NEJMsa1006396PMID:21175315 20. Brabrand M, Folkestad L, Clausen NG, Knudsen T, Hallas J. Risk scoring systems for adults admitted
to the emergency department: a systematic review. Scandinavian journal of trauma, resuscitation and emergency medicine. 2010; 18:8. doi:10.1186/1757-7241-18-8PMID:20146829
21. Knaus WA, Wagner DP, Draper EA, Zimmerman JE, Bergner M, Bastos PG, et al. The APACHE III prognostic system. Risk prediction of hospital mortality for critically ill hospitalized adults. Chest. 1991; 100:1619–36. PMID:1959406
22. Moreno RP, Metnitz PG, Almeida E, Jordan B, Bauer P, Campos RA, et al. SAPS 3-From evaluation of the patient to evaluation of the intensive care unit. Part 2: Development of a prognostic model for hospi-tal morhospi-tality at ICU admission. Intensive Care Med. 2005; 31:1345–55. PMID:16132892
23. Elbarouni B, Goodman SG, Yan RT, Welsh RC, Kornder JM, Deyoung JP, et al. Validation of the Global Registry of Acute Coronary Event (GRACE) risk score for in-hospital mortality in patients with acute cor-onary syndrome in Canada. American heart journal. 2009; 158:392–9. doi:10.1016/j.ahj.2009.06.010 PMID:19699862
24. Vazquez R, Bayes-Genis A, Cygankiewicz I, Pascual-Figal D, Grigorian-Shamagian L, Pavon R, et al. The MUSIC Risk score: a simple method for predicting mortality in ambulatory patients with chronic heart failure. European heart journal. 2009; 30:1088–96. doi:10.1093/eurheartj/ehp032PMID: 19240065
25. Straede M, Brabrand M. External validation of the simple clinical score and the HOTEL score, two scores for predicting short-term mortality after admission to an acute medical unit. PloS one. 2014; 9: e105695. doi:10.1371/journal.pone.0105695PMID:25144186
27. Breslow MJ, Badawi O. Severity scoring in the critically ill: part 1-interpretation and accuracy of out-come prediction scoring systems. Chest. 2012; 141:245–52. doi:10.1378/chest.11-0330PMID: 22215834
28. Knaus WA, Wagner DP. Acute physiology and chronic health evaluation and Glasgow coma scores. Critical care medicine. 1992; 20:1736–8. PMID:1458955
29. Le Gall JR, Lemeshow S, Saulnier F. A new Simplified Acute Physiology Score (SAPS II) based on a European/North American multicenter study. JAMA. 1993; 270:2957–63. PMID:8254858
30. Hiesmayr M, Schindler K, Pernicka E, Schuh C, Schoeniger-Hekele A, Bauer P, et al. Decreased food intake is a risk factor for mortality in hospitalised patients: The NutritionDay survey 2006. Clinical nutri-tion (Edinburgh, Scotland). 2009; 28:484–91. doi:10.1016/j.clnu.2009.05.013PMID:19573957 31. Frank E, Harrell J, users cfmo. Hmisc: Harrell Miscellaneous. R package version 3.5–2. 2008. 32. Bauer P, Pötscher BM, Hackl P. Model selection by multiple test procedures. Statistics. 1988; 19:39–
44. PMID:3376188
33. Hastie T, Tibshirani R, Friedman J, editors. The elements of statistical learning: data mining, inference, and prediction.: Springer, Berlin Heidelberg New York; 2001. doi:10.1016/j.neunet.2009.04.005 PMID:19443179
34. Lemeshow S, Hosmer DW Jr. A review of goodness of fit statistics for use in the development of logistic regression models. Am J Epidemiol. 1982; 115:92–106. PMID:7055134
35. Harrell FE Jr, Lee KL, Mark DB. Multivariable prognostic models: issues in developing models, evaluat-ing assumptions and adequacy, and measurevaluat-ing and reducevaluat-ing errors. Statistics in medicine. 1996; 15:361–87. PMID:8668867
36. R_Development_Core_Team. R: A language and environment for statistical computing. Vienna, Aus-tria: R Foundation for Statistical Computing; 2008. Available from:http://www.R-project.org.
37. BAPEN. Malnutrition Advisory Group. The "MUST" report: nutritional screening for adults. A multidisci-plinary responsibility. Available:http://www.bapen.org.uk/screening-for-malnutrition/must/must-report/ the-must-report-executive-summary. Accessed 2015 Mar 3. Redditch, Worcestershire, MAG2003. 38. Kondrup J, Rasmussen HH, Hamberg O, Stanga Z. Nutritional risk screening (NRS 2002): a new
meth-od based on an analysis of controlled clinical trials. Clinical nutrition (Edinburgh, Scotland). 2003; 22:321–36. PMID:12765673
39. Davis RB, Iezzoni LI, Phillips RS, Reiley P, Coffman GA, Safran C. Predicting in-hospital mortality. The importance of functional status information. Med Care. 1995; 33:906–21. PMID:7666705
40. Iezzoni LI, Heeren T, Foley SM, Daley J, Hughes J, Coffman GA. Chronic conditions and risk of in-hos-pital death. Health Serv Res. 1994; 29:435–60. PMID:7928371
41. Iezzoni LI, Ash AS, Coffman GA, Moskowitz MA. Predicting in-hospital mortality. A comparison of se-verity measurement approaches. Med Care. 1992; 30:347–59. PMID:1556882