Jeovany MartínezI Cora AraújoII
Bernardo Lessa HortaI Denise Petrucci GiganteII
I Programa de Pós-Graduação em
Epidemiologia. Faculdade de Medicina. Universidade Federal de Pelotas (UFPel). Pelotas, RS, Brasil
II Programa de Pós-Graduação em
Epidemiologia. Faculdade de Nutrição. UFPel. Pelotas, RS, Brasil
Correspondence:
Jeovany Martínez
Universidade Federal de Pelotas R. Mal. Deodoro, 1160 3º andar – Centro
96020-220 Pelotas, RS, Brasil E-mail: [email protected] Received: 9/26/2008 Revised: 7/31/2009 Approved: 8/20/2009
Article available from www.scielo.br/rsp
Growth patterns in early
childhood and the onset of
menarche before age twelve
Padrões de crescimento na infância
precoce e ocorrência de menarca
antes de doze anos de idade
ABSTRACT
OBJECTIVE: To examine the relationship between growth patterns in early childhood and the onset of menarche before age 12.
METHODS: The study included 2,083 women from a birth cohort study conducted in the city of Pelotas, Southern Brazil, starting in 1982. Anthropometric, behavioral, and pregnancy-related variables were collected through home interviews. Statistical analyses were performed using Pearson’s chi-square and chi-square test for linear trends. A multivariable analysis was carried out using Poisson regression based on a hierarchical model.
RESULTS: Mean age of menarche was 12.4 years old and the prevalence of menarche before age 12 was 24.3%. Higher weight-for-age, height-for-age, and weight-for-height z-scores at 19.4 and 43.1 months of age were associated with linear tendencies of increased prevalence and relative risks of the onset of menarche before age 12. Girls who experienced rapid growth in weight-for-age z-score from birth to 19.4 months of age and in weight-weight-for-age or height-for-age z-scores from 19.4 to 43.1 months of age also showed higher risk of menarche before age 12. Higher risk was seen when rapid growth in weight-for-age z-score was seen during these age intervals and the highest
risk was found among those in the irst tertile of Williams’ curve at birth.
Rapid growth in weight-for-height z-score was not associated with menarche before age 12.
CONCLUSIONS: Menarche is affected by nutritional status and growth patterns during early childhood. Preventing overweight and obesity during early childhood and keeping a “normal” growth pattern seem crucial for the prevention of health conditions during adulthood.
Menarche (irst menstrual bleeding) is a milestone in
female reproductive life and has been reported as an important predictor of health status during adolescence, adulthood, and post-menopause. Early menarche has been described as a risk factor for chronic diseases, especially breast cancer.5
The 1982 Pelotas Birth Cohort Study found high body
mass index (BMI) and lower increment in weight gain
after adolescent pregnancy among girls who experi-enced menarche before age 12,13 and lower stature at
19 when menarche was before 13.14
Studies suggest chronic diseases are programmed by restrictive environments during intrauterine life resulting in abnormally programmed metabolic path-ways that act regulating metabolic, hormonal adaptive capacities in future life.2,12 Therefore, identifying early
health determinants and adopting the so-called life course approach6,18 are new goals of epidemiology
RESUMO
OBJETIVO: Avaliar a relação entre padrões de crescimento na infância precoce e ocorrência de menarca antes de 12 anos de idade.
MÉTODOS:O estudo incluiu 2.083 mulheres do estudo de coorte de nascidos em Pelotas, RS, de 1982. Variáveis antropométricas, comportamentais e relacionadas à gestação foram coletadas por meio de entrevistas domiciliares. As análises estatísticas empregadas foram o quadrado de Pearson e qui-quadrado para tendência linear. Além disso, análise multivariável foi realizada usando a regressão de Poisson, seguindo um modelo hierárquico.
RESULTADOS: A média de idade da menarca foi de 12,4 anos e a prevalência de menarca antes dos 12 anos foi de 24,3%. Maiores valores de escores Z nos índices peso/idade, altura/idade e peso/altura aos 19,4 e 43,1 meses corresponderam a maiores riscos de apresentar menarca antes dos 12 anos. Esse risco foi sistematicamente maior na idade de 43,1 meses. Meninas que experimentaram rápido crescimento em escore Z de peso/idade entre o nascimento e 19,4 meses ou em escore Z de peso/idade ou altura/idade entre 19,4 e 43,1 meses, mostraram os maiores riscos. O risco de menarca antes dos 12 anos foi mais elevado quando o crescimento rápido em escore Z de peso/idade ocorreu em ambos os períodos; e ainda maior entre as meninas do
primeiro tercil da curva de Williams. Crescimento rápido em escore Z de peso/
altura não esteve associado com menarca antes dos 12 anos.
CONCLUSÕES: A idade da menarca mostrou-se inluenciada pelo estado
nutricional e padrões de crescimento durante a infância precoce. Assim, evitar sobrepeso e obesidade na infância precoce mantendo um padrão “normal” de crescimento parece ser importante para prevenir problemas de saúde em futuras etapas da vida.
DESCRITORES: Menarca. Puberdade. Desenvolvimento Infantil. Desenvolvimento do Adolescente. Maturidade Sexual. Pesos e Medidas Corporais. Fatores de Risco. Estudos de Coortes. Peso para Idade. Peso para Altura. Altura para Idade.
INTRODUCTION
and public health.20 Early childhood has been also
described as a “window” for programming of chronic disease and there is evidence that rapid growth can produce negative health effects in later life.7-9,11,17,19,21,22
If rapid growth occurs after a “restriction” period, known as catch-up growth, it could have short-term
beneits with lower rates of infections during child -hood.23 However, weight gain in the irst two years of
life has been associated with lean mass in 18-year-old males in Brazil, whereas later weight gain was more strongly associated with fat mass.26
There are scarce studies investigating the association between early events and early menarche. Some authors have identified an association between the timing of puberty and early weight gain,1,7 but no
associa-tion was found with low birthweight.1 Other studies
The objective of the present study was to examine the relationship between growth patterns during early child-hood and the onset of menarche before age 12.
METHODS
The 1982 Pelotas Birth Cohort Study included 5,914 live born births. The cohort subjects have been followed up in several studies and detailed information are avai-lable elsewhere.24,25 The present study included 2,084
women with information on menarche. One subject was
excluded due to a uterine tumor; thus the inal sample
comprised 2,083 women.
The study was based on information from the perinatal
study (1982) and follow-up studies in 1984, 1986 and
2004–2005. In summary, in 1982, all subjects were weighed and their mothers answered a questionnaire on socioeconomic, demographic and health-related conditions. Data on their length at birth was not collected. During the 1984 and 1986 follow-up studies, the mothers or caretakers answered a questionnaire and their children had weight and height measure-ments taken. Subjects were on average 19.4 and 43.1 months old and 12.8% and 15.9% from the original cohort were lost to follow-up, respectively. Likewise, in 2004–2005, subjects were 23–24 years old and 22.6% from the original cohort were lost to follow-up.
Interviewers were thoroughly trained before ieldwork
and quality control included repeating 5% of the inter-views and double data entry.
Confounders in the perinatal study included skin color, family income (in quintiles of minimum monthly
wages), smoking during pregnancy and pre-gesta
-tional maternal BMI. Weight-for-age z-scores using Williams’ curve27 were used to generate other
varia-bles. In addition, from the 1984 and 1986 follow-up studies, breastfeeding duration was used for control of confounding. Height, weight and age were used to generate for-age, height-for-age and
weight-for-height z-scores based on the 2006 World Health Organization (WHO) curves,4 and were categorized
as ≤0, 0.01 to 1, 1.01 to 2, and >2.
Growth patterns were analyzed at two age intervals
(interval 1 and 2): from birth to 19.4 months of age;
and from 19.4 to 43.1 months of age. For interval 1, the change in weight-for-age z-score was a result of “z-score at 19.4 months of age minus z-score using Williams’
curve”. For interval 2, it was a result of “z-score at 43.1 months of age minus z-score at 19.4 months of age”.
The change in height-for-age and weight-for-height z-scores was analyzed separately in interval 2 as “z-score at 43.1 months of age minus z-score at 19.4
months of age,” respectively. Rapid growth has been described as gain of more than 0.67 z-score,21 used as
a cut-off in other studies.19,23 In addition, z-scores were
deined as “catch-down growth” if they were ≤–0.67;
“normal” if between –0.669 and 0.669; and “rapid
growth” if ≥0.67. Otherwise, a variable analyzing
change in both intervals in weight-for-age z-score was generated as “never rapid growth” (if catch-down or
normal growth in intervals 1 and 2); “rapid growth/
no rapid growth”; “no rapid growth/rapid growth” (if normal or catch-down growth in interval 1 and rapid
growth in interval 2); and “always rapid growth” (rapid growth in both intervals 1 and 2). These analyses were performed in the entire sample and stratiied by tertiles
of z-scores at the beginning of each age interval (at birth
and 19.4 months of age).
The age of menarche was obtained from the 2004–2005
follow-up and was analyzed as a dichotomous outcome: <12 and ≥12 years old.
Pearson’s chi-square and chi-square test for linear trends were used. A multivariable analysis was performed using Poisson regression with a robust variance esti-mative to obtain prevalence ratios.3 The regression was
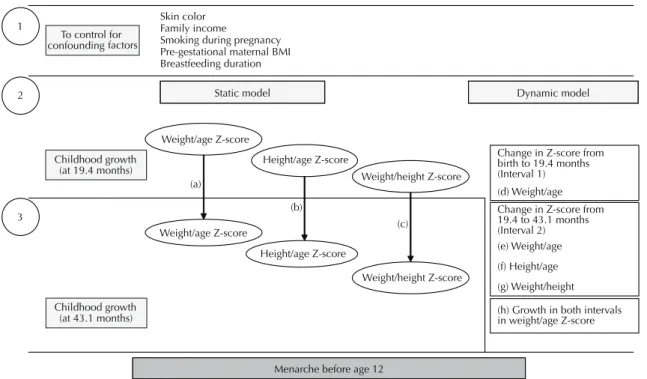
based on a hierarchical model (Figure).
All potential confounders (Figure) were cross-tabu -lated against the outcome and explanatory variables
and only those showing an association (p<0.20) were
included in the multivariable analysis. Confounding was defined as the difference between crude and adjusted estimates higher than 10%.
In levels 2 and 3 (Figure), two independent models –
one “static” and the other “dynamic” – were analyzed
and designated by letters (a through g). The variables in
the level 3 were adjusted for the related “static” model
in the level 2 (letters a–c) and for variables in the level
1, but not between them. The variables in the level 2
included in the “dynamic” model (letters d–g) were
adjusted only for the level 1, but not between them.
Using the actual sample size, prevalence ratio was
estimated with a power of 80% and at 5% signiicance
level. Some independent variables showed missing
data: change in weight-for-age z-score in interval 1 (26.1%) and change in weight-for-age z-score in both intervals (30.7%). Moreover, the characteristics of
subjects with missing data had a similar distribution for family income quintiles, indicating that they were not different from the study subjects. The number of observations for each regression model is included in the respective tables.
The analyses were performed using Stata 9.
All followed-up subjects signed an informed consent. The study was approved by the Research Ethics
RESULTS
Mean age of menarche was 12.44 years old (95% CI: 12.38; 12.51); median age was 12 years old and the
standard error was 1.51. The prevalence of menarche
before 12 was 24.3% (95% CI: 22.5; 26.2) and 66.8%
and 8.9% between age 12 and 14 and older than 14,
respectively. In addition, the asymmetry coeficient
was equal to 0.15 with Kurtosis of 3.53, indicating near-normal frequency distribution.
Table 1 shows a summary description of the sample including skin color, family income, smoking during pregnancy, anthropometric and growth pattern varia-bles, among others. There were a higher proportion of girls who experienced rapid growth with change in weight-for-age z-score from birth to 19.4 months
of age (41.0%) than from 19.4 to 43.2 months of age (8.0%).
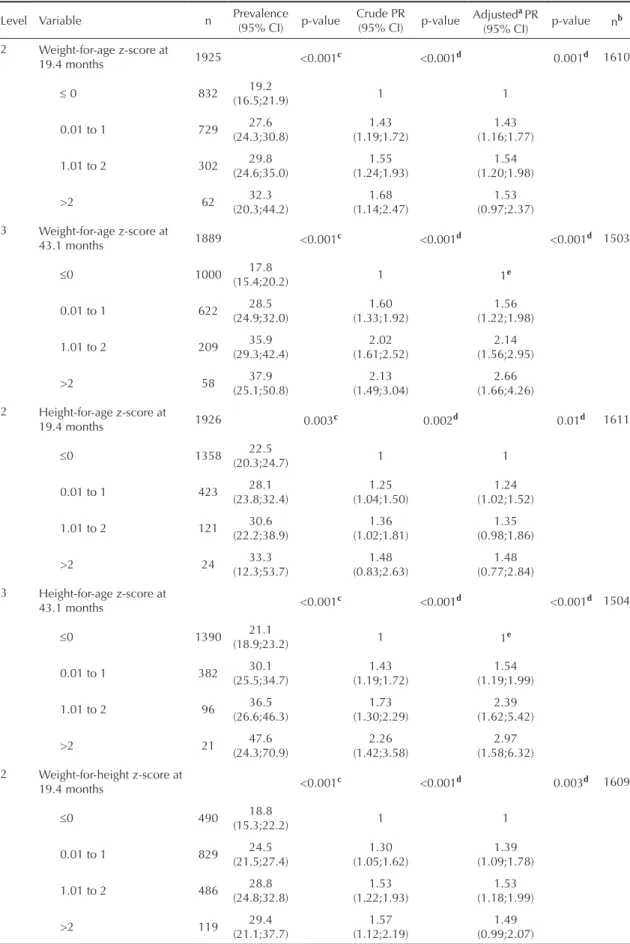
The differences in proportions of menarche before age 12 and Poisson regression results by z-score groups are showed in Table 2. Increasing weight-for-age, height-for-age and weight-for-height z-scores at 19.4 and 43.1 months of age were associated to linear tendencies of increasing prevalence of the outcome. The prevalence and relative risks of menarche before age 12 were
systematically higher in those with z-scores >2 or
more at 43.1 months than at 19.4 months of age. On
the other hand, weight-for-age z-score >2 at 19.4 and
43.1 months of age showed higher risk of the outcome
compared to ≤0 z-score group. Negative confounding
was detected at 43.1 months of age (crude PR=2.13;
p<0.001; adjusted PR=2.66; p<0.001).
Height-for-age z-score (Table 2) at 19.4 months and
43.1 months old showed that taller girls were more likely to have menarche before 12 than shorter ones
(p<0.001). The association at 43.1 months of age had a
negative confounding effect (crude PR=2.26; p<0.001;
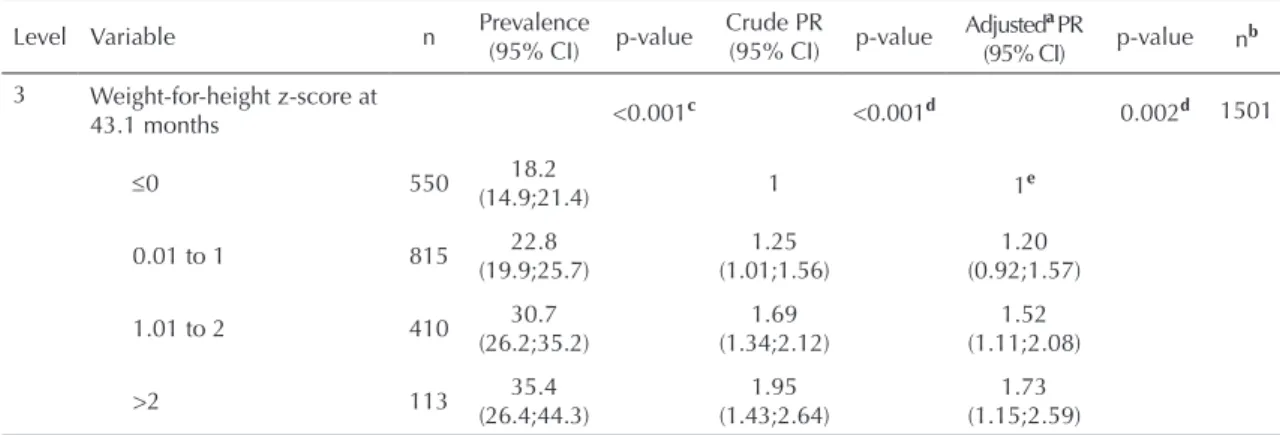
adjusted PR=2.97; p<0.001). The analysis of weight-for-height z-score revealed that the >2 group at 43.1
months of age had the highest risk of the outcome and had a positive confounding effect (crude PR=1.95;
p<0.001; adjusted PR=1.73; p=0.002).
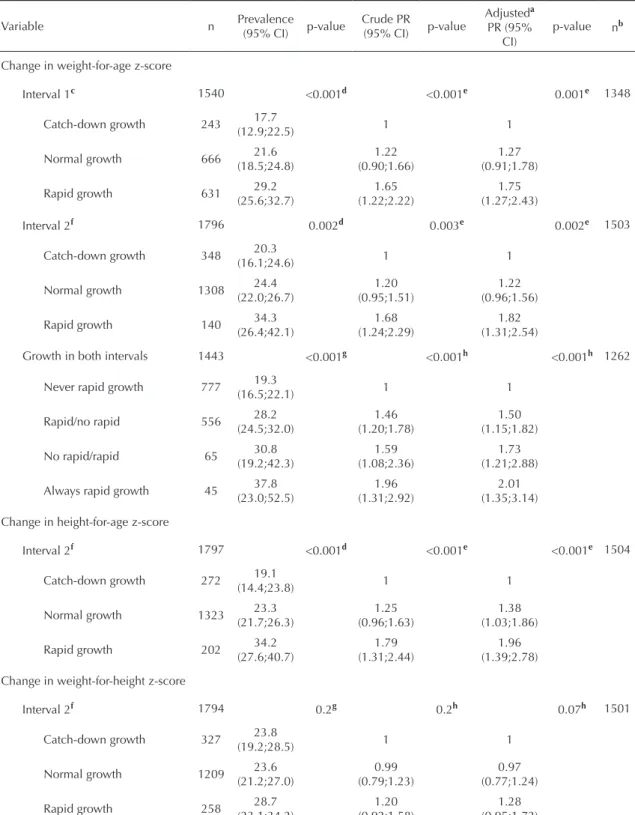
Table 3 shows the results for growth variables. In interval 1, girls who experienced rapid growth in weight-for-age z-score showed the highest prevalence
of the outcome (29.2%; p<0.001). The same was seen
in interval 2, but with greater prevalence of menarche
before age 12 (34.3%; p<0.001) than in interval 1. In
fact, those who experienced rapid growth in both inter-vals had the highest prevalence of the outcome (37.8%;
p<0.001) while those who experienced rapid growth
in height-for-age z-score during interval 2 had the
To control for confounding factors
Skin color Family income
Smoking during pregnancy Pre-gestational maternal BMI Breastfeeding duration
Childhood growth (at 19.4 months)
Weight/age Z-score
Height/age Z-score
Weight/height Z-score
3
Menarche before age 12
Change in Z-score from birth to 19.4 months (Interval 1) (d) Weight/age
Childhood growth (at 43.1 months)
Static model Dynamic model
Change in Z-score from 19.4 to 43.1 months (Interval 2) (e) Weight/age
(f) Height/age
(g) Weight/height
(h) Growth in both intervals in weight/age Z-score (a)
(b)
(c) 2
1
Weight/age Z-score
Height/age Z-score
Weight/height Z-score
Figure. Hierarquical model approach for the onset of menarche before age 12.
Table 1. Characteristics of the sample (N=2,083). City of Pelotas, Southern Brazil, 2004-2005.
Variable n %
Skin colora 2080
White 1713 82.4
Non-white 367 17.6
Family income (quintiles of minimum monthly wages) 2083
1st 384 18.4
2nd 437 21.0
3rd 436 20.9
4th 412 19.8
5th 414 19.9
Smoking during pregnancya 2078
No 1341 64.5
Yes 737 35.5
Pre-gestational maternal BMI (kg/m2)a 1748
<18 64 3.6
18 to 25 1272 72.8
>25 to 30 328 18.8
>30 84 4.8
Breastfeeding duration (months)a 2027
<1 417 20.6
1.1 to 3 528 26.1
3.1 to 6 469 23.1
>6 613 30.2
Weight-for-height z-score at 19.4 monthsa 1924
≤ 0 490 25.5
0.01 to 1 829 43.1
1.01 to 2 486 25.3
> 2 119 6.2
Weight-for-height z-score at 43.1 monthsa 1888
≤0 550 29.1
0.01 to 1 815 43.2
1.01 to 2 410 21.7
> 2 113 6.0
Weight-for-age z-score at 19.4 monthsa 1925
≤ 0 832 43.2
0.01 to 1 729 37.9
1.01 to 2 302 15.7
> 2 62 3.2
Weight-for-age z-score at 43.1 monthsa 1889
≤0 1000 52.9
0.01 to 1 622 32.9
1.01 to 2 209 11.1
>2 58 3.1
Height-for-age z-score at 19.4 monthsa 1926
≤0 1358 70.5
0.01 to 1 423 22.0
1.01 to 2 121 6.2
>2 24 1.3
highest prevalence of the outcome (34.2%; p<0.001).
Moreover, a change in weight-for-height z-score was
not associated with the outcome (p=0.22).
In contrast, in interval 1 (Table 3), those girls who
experienced rapid growth in weight-for-age z-score had higher risk than those who experienced catch-down
growth in both crude (PR=1.65; p<0.001) and adjusted analyses (PR=1.75; p<0.001). The same was found in
interval 2 with a relative risk very similar to that seen in interval 1 (crude PR=1.68; p=0.003; adjusted PR=1.82;
p=0.002). Girls who experienced rapid growth in both
intervals had the highest risk for the outcome (crude
PR=1.79; p<0.001; adjusted PR=2.01; p<0.001) and
those who experienced rapid growth in height-for-age z-score during interval 2 showed the highest relative risk for the outcome (crude PR1.79; p<0.001; adjust PR
1.96; p<0.001). Change in weight-for-height z-score
was not associated with the outcome in crude analyses
(p=0.2) but was marginally associated after controlling for confounders (PR=1.28; p=0.07).
Table 4 shows the relative risks of menarche before age 12 by growth patterns, taking into account the subjects’ initial z-score tertiles adjusted by family income. This analysis was not adjusted for all confounders due to missing data that resulted in a lower number of subjects
in each stratum: the program analyzes only those
observations that include information for all variables of the model, which reduces the number of observa-tions studied. To avoid the loss of many observaobserva-tions, the model was only adjusted for family income. In addition, family income was the only variable with no
missing data. Girls in the irst tertile of Williams’ curve
who experienced rapid growth in interval 1 showed the highest risk of the outcome (crude PR=2.10; p=0.01;
adjusted PR=2.09; p=0.01). Those in the second or third tertiles had lower risk. When rapid growth occurred in
Table 1 continuation
Variable N %
Height-for-age z-score at 43.1 monthsa 1889
≤0 1390 73.6
0.01 to 1 382 20.2
1.01 to 2 96 5.1
>2 21 1.1
Change in weight-for-age z-score from birth to 19.4 monthsb (Interval 1) 1540
Catch-down growth 243 15.8
Normal growth 666 43.2
Rapid growth 631 41.0
Change in weight-for-age z-score from 19.4 to 43.1 monthsa(Interval 2) 1796
Catch-down growth 349 19.4
Normal growth 1304 72.6
Rapid growth 143 8.0
Change in weight-for-age z-score in both intervalsb 1443
Never rapid growth 777 53.9
Rapid growth/no rapid growth 556 38.5
No rapid growth/rapid growth 65 4.5
Always rapid growth 45 3.1
Change in weight-for-height z-score from 19.4 to 43.1 monthsa(Interval 2) 1794
Catch-down growth 327 18.2
Normal growth 1209 67.4
Rapid growth 258 14.4
Change in height-for-age z-score from 19.4 to 43.1 months olda(Interval 2) 1797
Catch-down growth 15.14 15.1
Normal growth 73.62 73.6
Rapid growth 11.24 11.3
a Missing data lower than 16% b Missing data between 20% and 30.7%
Table 2. Frequency distributions of menarche before age 12 by z-score groups. Crude and adjusted Poisson regression analyses by hierarchical approach. City of Pelotas, Southern Brazil, 2004-2005.
Level Variable n Prevalence
(95% CI) p-value
Crude PR (95% CI) p-value
AdjustedaPR
(95% CI) p-value n
b
2 Weight-for-age z-score at
19.4 months 1925 <0.001c <0.001d 0.001d 1610
≤ 0 832 19.2
(16.5;21.9) 1 1
0.01 to 1 729 27.6
(24.3;30.8)
1.43 (1.19;1.72)
1.43 (1.16;1.77)
1.01 to 2 302 29.8
(24.6;35.0)
1.55 (1.24;1.93)
1.54 (1.20;1.98)
>2 62 32.3
(20.3;44.2)
1.68 (1.14;2.47)
1.53 (0.97;2.37)
3 Weight-for-age z-score at
43.1 months 1889 <0.001c <0.001d <0.001d 1503
≤0 1000 17.8
(15.4;20.2) 1 1e
0.01 to 1 622 28.5
(24.9;32.0)
1.60 (1.33;1.92)
1.56 (1.22;1.98)
1.01 to 2 209 35.9
(29.3;42.4)
2.02 (1.61;2.52)
2.14 (1.56;2.95)
>2 58 37.9
(25.1;50.8)
2.13 (1.49;3.04)
2.66 (1.66;4.26)
2 Height-for-age z-score at
19.4 months 1926 0.003c 0.002d 0.01d 1611
≤0 1358 22.5
(20.3;24.7) 1 1
0.01 to 1 423 28.1
(23.8;32.4)
1.25 (1.04;1.50)
1.24 (1.02;1.52)
1.01 to 2 121 30.6
(22.2;38.9)
1.36 (1.02;1.81)
1.35 (0.98;1.86)
>2 24 33.3
(12.3;53.7)
1.48 (0.83;2.63)
1.48 (0.77;2.84)
3 Height-for-age z-score at
43.1 months <0.001c <0.001d <0.001d 1504
≤0 1390 21.1
(18.9;23.2) 1 1e
0.01 to 1 382 30.1
(25.5;34.7)
1.43 (1.19;1.72)
1.54 (1.19;1.99)
1.01 to 2 96 36.5
(26.6;46.3)
1.73 (1.30;2.29)
2.39 (1.62;5.42)
>2 21 47.6
(24.3;70.9)
2.26 (1.42;3.58)
2.97 (1.58;6.32)
2 Weight-for-height z-score at
19.4 months <0.001c <0.001d 0.003d 1609
≤0 490 18.8
(15.3;22.2) 1 1
0.01 to 1 829 24.5
(21.5;27.4)
1.30 (1.05;1.62)
1.39 (1.09;1.78)
1.01 to 2 486 28.8
(24.8;32.8)
1.53 (1.22;1.93)
1.53 (1.18;1.99)
>2 119 29.4
(21.1;37.7)
1.57 (1.12;2.19)
1.49 (0.99;2.07)
interval 2, the girls in the irst and second tertiles had no risk (p=0.2). Those girls in the third tertile showed
higher relative risks than those who experienced catch-down growth (crude PR=1.92; p=0.02; adjusted
PR=1.98; p=0.02). Otherwise, when there was rapid growth in both intervals, girls in the irst tertile showed
the highest risk (crude PR=2.87; p=0.01; adjusted
PR=2.85; p=0.01).
Changes in weight-for-age z-score in interval 2 (Table
4) were analyzed taking account weight-for-age z-score
tertiles at 19.4 months of age. The risk increased among girls in the highest tertiles (crude PR=2.14; p=0.001;
adjusted PR=2.14; p<0.001). Changes in height-for-age
z-score in interval 2 showed that the relative risk for the outcome was similar in height-for-age z-score tertiles at 19.4 months of age and higher among those who experienced rapid growth. Finally, changes in weight-for-height z-score in interval 2 showed increased risk
only in the third tertile (PR=1.83, p=0.001).
DISCUSSION
The study indings are consistent with Dunger et al8
reports that place great importance on rapid growth during childhood associated with the onset of puberty.
In our study (dynamic model), girls who experienced
rapid growth and weight gain during an early age interval showed less apparent risk for menarche before age 12 than those who experienced rapid growth in a
later period. After stratifying by tertiles of Williams’
curve, the risk of the outcome was clearly higher among “small” girls at birth who experienced rapid growth in both age intervals. Moreover, the first interval studied seems to have a more remarkable nega-tive effect on these girls. This early accelerated weight gain was associated with younger age of menarche, corroborating other studies.1,8
There is biological plausibility in our indings regarding
the association of early rapid growth and menarche before age 12. A study analyzing a sub-sample of subjects from the 1982 Pelotas Birth Cohort from same age inter-vals showed an association between rapid growth and overweight/obesity in adolescence.19 This inding could
in part explain the mechanism that associates catch-up or rapid growth with age of menarche. These girls tend to have more body fat and it is well-recognized that greater body fat increases the risk for early menarche,8
possibly due to high levels of leptin.1,8
There could be other explanations for the effect of rapid growth on the onset of menarche before age 12 rather than obesity. High leptin levels following rapid weight gain during childhood may trigger early pubertal
development.8
The present study found that higher weight-for-age and/or height-for-age z-scores during early
chil-dhood (static model) was associated with menarche
before age 12, which is consistent to that described in other studies.1,7, 8,16
The analysis of nutritional status (static model) sepa
-rately from growth patterns (dynamic model) could
be a useful yet challenging approach in life course epidemiology.6,18 We believe that both models analyze
the same issue but from different perspectives. The dynamic model had the advantage of describing the relative risk, especially in girls who were “small” at
birth (irst tertile of Williams’ curve). For example, a risk was seen among girls who grew ≥0.67 z-score but did not reach the classic >2 z-score (static model) at
19.4 or at 43.1 months of age. However, further studies
are required to estimate speciicity and sensibility of
each approach. Both models allow the assessment of relative risks of developing health conditions in future life at the individual level.
Table 2 continuation
Level Variable n Prevalence
(95% CI) p-value
Crude PR (95% CI) p-value
AdjustedaPR
(95% CI) p-value n
b
3 Weight-for-height z-score at
43.1 months <0.001c <0.001d 0.002d 1501
≤0 550 18.2
(14.9;21.4) 1 1e
0.01 to 1 815 22.8
(19.9;25.7)
1.25 (1.01;1.56)
1.20 (0.92;1.57)
1.01 to 2 410 30.7
(26.2;35.2)
1.69 (1.34;2.12)
1.52 (1.11;2.08)
>2 113 35.4
(26.4;44.3)
1.95 (1.43;2.64)
1.73 (1.15;2.59)
a Adjusted for skin color, family income, smoking during pregnancy, pre-gestational maternal BMI, breastfeeding duration b Observations in the regression model
cχ2 test for linear trend
d Wald test for linear trend
Table 3. Frequency distribution of menarche before age 12 by growth patterns considering z-score change during childhood. Crude and adjusted Poisson regression analyses by hierarchical approach. City of Pelotas, Southern Brazil, 2004-2005.
Variable n Prevalence
(95% CI) p-value
Crude PR
(95% CI) p-value
Adjusteda PR (95%
CI)
p-value nb
Change in weight-for-age z-score
Interval 1c 1540 <0.001d <0.001e 0.001e 1348
Catch-down growth 243 17.7
(12.9;22.5) 1 1
Normal growth 666 21.6
(18.5;24.8)
1.22 (0.90;1.66)
1.27 (0.91;1.78)
Rapid growth 631 29.2
(25.6;32.7)
1.65 (1.22;2.22)
1.75 (1.27;2.43)
Interval 2f 1796 0.002d 0.003e 0.002e 1503
Catch-down growth 348 20.3
(16.1;24.6) 1 1
Normal growth 1308 24.4
(22.0;26.7)
1.20 (0.95;1.51)
1.22 (0.96;1.56)
Rapid growth 140 34.3
(26.4;42.1)
1.68 (1.24;2.29)
1.82 (1.31;2.54)
Growth in both intervals 1443 <0.001g <0.001h <0.001h 1262
Never rapid growth 777 19.3
(16.5;22.1) 1 1
Rapid/no rapid 556 28.2
(24.5;32.0)
1.46 (1.20;1.78)
1.50 (1.15;1.82)
No rapid/rapid 65 30.8
(19.2;42.3)
1.59 (1.08;2.36)
1.73 (1.21;2.88)
Always rapid growth 45 37.8
(23.0;52.5)
1.96 (1.31;2.92)
2.01 (1.35;3.14)
Change in height-for-age z-score
Interval 2f 1797 <0.001d <0.001e <0.001e 1504
Catch-down growth 272 19.1
(14.4;23.8) 1 1
Normal growth 1323 23.3
(21.7;26.3)
1.25 (0.96;1.63)
1.38 (1.03;1.86)
Rapid growth 202 34.2
(27.6;40.7)
1.79 (1.31;2.44)
1.96 (1.39;2.78)
Change in weight-for-height z-score
Interval 2f 1794 0.2g 0.2h 0.07h 1501
Catch-down growth 327 23.8
(19.2;28.5) 1 1
Normal growth 1209 23.6
(21.2;27.0)
0.99 (0.79;1.23)
0.97 (0.77;1.24)
Rapid growth 258 28.7
(23.1;34.2)
1.20 (0.92;1.58)
1.28 (0.95;1.72)
a Adjusted for family income, skin color, smoking during pregnancy, pre-gestational maternal BMI and breastfeeding
duration
b Observations into regression model c From birth to 19.4 months dχ² test for linear trend e Wald test for trend f From 19.4 to 43.1 months gχ² test
Table 4. Prevalence ratio for menarche before age 12 according to growth patterns. Crude and adjusted analyses stratified by z-score tertile at the beginning of each age interval studied. City of Pelotas, Southern Brazil, 2004-2005.
Variable
First tertile Second tertile Third tertile
Crude PR (95% CI )
Adjusteda PR ( 95% CI)
Crude PR (95% CI)
Adjusteda PR (95% CI)
Crude PR (95% CI)
Adjusteda PR (95% CI)
Weight-for-age z-score using Williams’ curves
Change in weight-for-age z-score in Interval 1
n=491 p=0.01b n=491 p=0.01b n=549 p=0.02b n=549 p=0.02b n=500 p=0.02b n=500 p=0.01b
Catch-down growth 1 1 1 1 1 1
Normal growth 1.33
(0.54;3.23) 1.34 (0.54;3.27) 1.32 (0.69;2.49) 1.34 (0.70;2.56) 1.22 (0.82;1.82) 1.24 (0.83;1.86)
Rapid growth 2.10
(0.91;4.85) 2.09 (0.90;4.88) 1.75 (0.93;3.28) 1.79 (0.94;3.40) 1.71 (1.10;2.64) 1.74 (1.11;2.73)
Change in weight-for-age z-score in Interval 2
n=606 p=0.2c n=606 p=0.2c n=626 p=0.3c n=626 p=0.2c n=563 p=0.02b n=563 p=0.02b
Catch-down growth 1 1 1 1 1 1
Normal growth 1.08
(0.72;1.62) 1.09 (0.73;1.63) 1.42 (0.94;2.15) 1.44 (0.96;2.16) 1.11 (0.76;1.61) 1.10 (0.76;1.60)
Rapid growth 1.53
(0.89;2.61) 1.51 (0.89;2.56) 1.34 (0.67;2.67) 1.35 (0.67;2.70) 1.92 (1.22;3.03) 1.98 (1.26;3.10)
Growth in weight-for-age z-score in both intervals
n=466 p=0.01c n=466 p=0.01c n=508 p=0.3c n=508 p=0.3c n=469 p=0.01c n=469 p=0.01c
Never rapid growth 1 1 1 1 1 1
Rapid/no rapid 1.82
(1.19;2.78) 1.81 (1.17;2.80) 1.37 (1.00;1.88) 1.38 (1.00;1.90) 1.55 (1.05;2.29) 1.54 (1.05;2.28)
No rapid/rapid 1.76
(0.76;4.09) 1.73 (0.75;3.97) 1.14 (0.47;2.76) 1.20 (0.49;2.89) 1.89 (1.13;3.14) 1.92 (1.14;3.23)
Always rapid growth 2.87 (1.54;5.34) 2.85 (1.52;5.35) 1.21 (0.44;3.30) 1.21 (0.43;3.45) 2.07 (1.03;4.18) 2.16 (1.04;4.46)
Weight-for-age z-score at 19.4 months
Change in weight-for-age z-score in interval 2
n=584 p=0.01c n=584 p=0.01c n=602 p=0.05b n=602 p=0.05b n=610 p=0.001b n=610 p<0.001b
Catch-down growth 1 1 1 1 1 1
Normal growth 0.73
(0.43;1.24) 0.73 (0.43;1.24) 1.57 (1.04;2.36) 1.57 (1.05;2.36) 1.37 (0.99;1.91) 1.42 (1.02;1.97)
Rapid growth 1.35
(0.73;2.48) 1.37 (0.75;2.48) 1.39 (0.66;2.92) 1.40 (0.66;2.97) 2.14 (1.40;3.26) 2.37 (1.55;3.60)
Change in height-for-age z-score in Interval 2
n=582 p=0.01b n=582 p=0.01b n=605 p=0.003b n=605 p=0.003b n=610 p=0.003b n=610 p=0.002b
Catch-down growth 1 1 1 1 1 1
Normal growth 1.52
(0.65;3.56) 1.49 (0.62;3.56) 1.22 (0.76;1.98) 1.24 (0.76;2.02) 1.42 (1.01;2.00) 1.43 (1.02;2.01)
Rapid growth 2.25
Our indings provide input supporting the importance
of preventing overweight or obesity during early chil-dhood and maintaining a “normal” growth pattern. Rapid growth during childhood is associated with
short-term beneits such as lower risk of hospital admission
and lower mortality,23 but it appear to be a risk for health
outcome in the long run.11,17,19,21 Moreover, accelerated
growth should be taken into account when following up “healthy” children in preventive medicine.
The present indings suggest that early experiences
may partially determine later health outcomes and are consistent with a life course approach.2,18
The mean age of menarche found in the study (12.4
years old) was slightly lower than that reported in other
studies in the same city (mean age of 12.7 years in
1991).15 Unpublished data from a representative study
of women in Pelotas in the early 1990s showed that the average age of menarche was 12.8 years among 1,770 women in 2002.
In the early 1990s, the mean age of menarche in Brazil was 13.2 years. It could be argued that these studies did not take into account the year of birth, also known as the cohort effect.18
The 1982 Pelotas Birth Cohort Study24,25 provided good
quality of data to the present study. However, there are
some limitations: no data on length measurement at
birth and no follow-up near menarche age for all girls. Age at menarche was collected retrospectively and in complete years at age 24. Two active birth cohort studies in the city of Pelotas including those born in 1993 and 2004 will allow a more detailed investigation. Table 4 continuation
Variable
First tertile Second tertile Third tertile
Crude PR (95% CI )
Adjusteda PR ( 95% CI)
Crude PR (95% CI)
Adjusteda PR (95% CI)
Crude PR (95% CI)
Adjusteda PR (95% CI)
Weight-for-height z-score at 19.4 months
Change in weight-for-height z-score in interval 2
n=593 p=0.5c
n=593 p=0.5c
n=601 p=0.8c
n=601 p=0.8c
n=600 p=0.01b
n=600 p=0.02b
Catch-down growth 1 1 1 1 1 1
Normal growth 0.97
(0.46;2.05)
1.00 (0.47;2.11)
1.15 (0.77;1.72)
1.12 (0.74;1.68)
1.11 (0.83;1.48)
1.08 (0.61;1.48)
Rapid growth 1.22
(0.55;2.68)
1.25 (0.56;2.75)
1.16 (0.68;1.98)
1.17 (0.68;1.99)
1.82 (1.26;2.63)
1.83 (1.26;2.66)
1. Adair LS. Size at birth predicts age at menarche.
Pediatrics. 2001;107(4):E59. DOI:10.1542/ peds.107.4.e59
2. Barker DJ. The developmental origins of well-being. Philos Trans R Soc Lond B Biol Sci. 2004;359(1449):1359-66. DOI:10.1098/ rstb.2004.15183.
3. Barros AJ, Hirakata VN. Alternatives for logistic regression in cross-sectional studies: an empirical comparison of models that directly estimate the prevalence ratio. BMC Med Res Methodol. 2003;20(3):21.
4. Borghi E, Onis M, Garza C, Van den Broeck J, Frongillo EA, Grummer-Strawn L, et al. Construction of the World Health Organization child growth standards: selection of methods for attained growth curves. Stat Med. 2006;25(2):247-65.
5. De Stavola BL, Silva IS, McCormack V, Hardy RJ, Kuh DJ, Wadsworth ME. Childhood growth and breast cancer. Am J Epidemiol. 2004;159(7):671-82. DOI:10.1093/aje/kwh097
6. De Stavola BL, Nitsch D, Silva IS, McCormack V, Hardy R, Mann V, et al. Statistical issues in life course epidemiology. Am J Epidemiol. 2006;163(1):84-96. DOI:10.1093/aje/kwj003
7. dos Santos Silva I, De Stavola BL, Mann V, Kuh D, Hardy R, Wadsworth ME. Prenatal factors, childhood growth trajectories and age at menarche.
Int J Epidemiol. 2002;31(2):405-12. DOI:10.1093/ ije/31.2.405
8. Dunger DB, Ahmed ML, Ong KK. Early and late weight gain and the timing of puberty. Mol Cell Endocrinol. 2006;254-255:140-5. DOI:10.1016/j. mce.2006.04.003
9. Eriksson JG, Forsen T, Tuomilehto J, Winter PD, Osmond C, Barker DJ. Catch-up growth in childhood and death from coronary heart disease: longitudinal study. BMJ. 1999;318(7181):427-31.
10. Eriksson J, Forsen T, Tuomilehto J, Osmond C, Barker D. Fetal and childhood growth and hypertension in adult life. Hypertension. 2000;36(5):790-4.
11. Eriksson JG, Forsen T, Tuomilehto J, Osmond C, Barker DJ. Early growth and coronary heart disease in later life: longitudinal study. BMJ. 2001;322(7292):949-53. DOI:10.1136/bmj.322.7292.949
12. Fowden AL, Forhead AJ. Endocrine mechanisms of intrauterine programming. Reproduction. 2004;127(5):515-26. DOI:10.1530/rep.1.00033
13. Gigante DP, Rasmussen KM, Victora CG. Pregnancy increases BMI in adolescents of a population-based birth cohort. J Nutr. 2005;135(1):74-80.
14. Gigante DP, Horta BL, Lima RC, Barros FC, Victora CG. Early life factors are determinants of female height
at age 19 years in a population-based birth cohort (Pelotas, Brazil). J Nutr. 2006;136(2):473-8.
15. Horta RL, Santos I. Idade da menarca em Pelotas: estudo piloto. Rev AMRIGS. 1991;35(2):83-7.
16. Ibañez L, Zegher F. Puberty and prenatal growth. Mol Cell Endocrinol. 2006;254-255:22-5. DOI:10.1016/j. mce.2006.04.010
17. Ibañez L, Ong K, Dunger DB, Zegher F. Early development of adiposity and insulin resistance after catch-up weight gain in small-for-gestational-age children. J Clin Endocrinol Metab. 2006;91(6):2153-8. DOI:10.1210/jc.2005-2778
18. Kuh D, Ben-Shlomo Y, Lynch J, Hallqvist J, Power C. Life course epidemiology. J Epidemiol Community Health. 2003;57(10):778-83. DOI:10.1136/ jech.57.10.778
19. Monteiro PO, Victora CG, Barros FC, Monteiro LM. Birth size, early childhood growth, and adolescent obesity in a Brazilian birth cohort. Int J Obes Relat Metab Disord. 2003;27(10):1274-82. DOI:10.1038/ sj.ijo.0802409
20. Oken E, Gillman MW. Fetal origins of obesity. Obes Res. 2003;11(4):496-506. DOI:10.1038/oby.2003.69
21. Ong KK, Ahmed ML, Emmett PM, Preece MA, Dunger DB. Association between postnatal catch-up growth and obesity in childhood: prospective cohort study. BMJ. 2000;320(7240):967-71. DOI:10.1136/ bmj.320.7240.967
22. Ong KK, Dunger DB. Birth weight, infant growth and insulin resistance. Eur J Endocrinol. 2004;151(Suppl 3):U131-9.
23. Victora CG, Barros FC, Horta BL, Martorell R. Short-term benefits of catch-up growth for small-for-gestational-age infants. Int J Epidemiol. 2001;30(6):1325-30. DOI:10.1093/ije/30.6.1325
24. Victora CG, Barros FC, Lima RC, Behague DP, Gon alves H, Horta BL, et al. The Pelotas birth cohort study, Rio Grande do Sul, Brazil, 1982-2001. Cad Saude Publica. 2003;19(5):1241-56. DOI:10.1590/S0102-311X2003000500003
25. Victora CG, Barros FC. Cohort profile: the 1982 Pelotas (Brazil) birth cohort study. Int J Epidemiol. 2006;35(2):237-42. DOI:10.1093/ije/dyi290
26. Victora CG, Adair L, Fall C, Hallal PC, Martorell R, Richter L, et al. Maternal and child undernutrition: consequences for adult health and human capital.
Lancet. 2008;371(9609):340-57. DOI:10.1016/S0140-6736(07)61692-4
27. Williams RL, Creasy RK, Cunningham GC, Hawes WE, Norris FD, Tashiro M. Fetal growth and perinatal viability in California. Obstet Gynecol. 1982;59(5):624-32.
REFERENCES