Clinical Value of Prognosis Gene Expression Signatures in
Colorectal Cancer: A Systematic Review
Rebeca Sanz-Pamplona1., Antoni Berenguer1., David Cordero1
, Samantha Riccadonna2, Xavier Sole´1, Marta Crous-Bou1, Elisabet Guino´1, Xavier Sanjuan3, Sebastiano Biondo4,5, Antonio Soriano6,
Giuseppe Jurman2, Gabriel Capella7, Cesare Furlanello2, Victor Moreno1,5*
1Unit of Biomarkers and Susceptibility (UBS), Catalan Institute of Oncology (ICO), Bellvitge Biomedical Research Institute (IDIBELL), and CIBERESP, L’Hospitalet de Llobregat, Barcelona, Spain,2Predictive Models for Biomedicine & Environment (PMBE), Fondazione Bruno Kessler (FBK), Trento, Italy,3Pathology Service, University Hospital Bellvitge (HUB – IDIBELL), L’Hospitalet de Llobregat, Barcelona, Spain,4General and Digestive Surgery Service, University Hospital Bellvitge (HUB – IDIBELL), L’Hospitalet de Llobregat, Barcelona, Spain,5Department of Clinical Sciences, Faculty of Medicine, University of Barcelona (UB), Barcelona, Spain,6Gastroenterology Service, University Hospital Bellvitge (HUB – IDIBELL), L’Hospitalet de Llobregat, Barcelona, Spain,7Hereditary Cancer Program, Catalan Institute of Oncology (ICO -IDIBELL), L’Hospitalet de Llobregat, Barcelona, Spain
Abstract
Introduction:The traditional staging system is inadequate to identify those patients with stage II colorectal cancer (CRC) at high risk of recurrence or with stage III CRC at low risk. A number of gene expression signatures to predict CRC prognosis have been proposed, but none is routinely used in the clinic. The aim of this work was to assess the prediction ability and potential clinical usefulness of these signatures in a series of independent datasets.
Methods:A literature review identified 31 gene expression signatures that used gene expression data to predict prognosis in CRC tissue. The search was based on the PubMed database and was restricted to papers published from January 2004 to December 2011. Eleven CRC gene expression datasets with outcome information were identified and downloaded from public repositories. Random Forest classifier was used to build predictors from the gene lists. Matthews correlation coefficient was chosen as a measure of classification accuracy and its associated p-value was used to assess association with prognosis. For clinical usefulness evaluation, positive and negative post-tests probabilities were computed in stage II and III samples.
Results:Five gene signatures showed significant association with prognosis and provided reasonable prediction accuracy in their own training datasets. Nevertheless, all signatures showed low reproducibility in independent data. Stratified analyses by stage or microsatellite instability status showed significant association but limited discrimination ability, especially in stage II tumors. From a clinical perspective, the most predictive signatures showed a minor but significant improvement over the classical staging system.
Conclusions: The published signatures show low prediction accuracy but moderate clinical usefulness. Although gene expression data may inform prognosis, better strategies for signature validation are needed to encourage their widespread use in the clinic.
Citation:Sanz-Pamplona R, Berenguer A, Cordero D, Riccadonna S, Sole´ X, et al. (2012) Clinical Value of Prognosis Gene Expression Signatures in Colorectal Cancer: A Systematic Review. PLoS ONE 7(11): e48877. doi:10.1371/journal.pone.0048877
Editor:Wayne A. Phillips, Peter MacCallum Cancer Centre, Australia
ReceivedMay 30, 2012;AcceptedOctober 2, 2012;PublishedNovember 7, 2012
Copyright:ß2012 Sanz-Pamplona et al. This is an open-access article distributed under the terms of the Creative Commons Attribution License, which permits unrestricted use, distribution, and reproduction in any medium, provided the original author and source are credited.
Funding:This study was supported by the European Commission grant FP7-COOP-Health-2007-B HiPerDART. Also the Instituto de Salud Carlos III grants (FIS PI08/1635, FIS PI08/1359 and FIS PI09-01037), CIBERESP CB07/02/2005, the Spanish Association Against Cancer (AECC) Scientific Foundation, and the Catalan Government DURSI grant 2009SGR1489. The funders had no role in study design, data collection and analysis, decision to publish, or preparation of the manuscript.
Competing Interests:The authors have declared that no competing interests exist. * E-mail: v.moreno@iconcologia.net
.These authors contributed equally to this work.
Introduction
Colorectal cancer (CRC) is the third most common cancer worldwide and the second leading cause of cancer death. During the last decades, incidence has been increasing, while mortality has slowly been decreasing [1]. A remarkable feature of CRC is the difference in prognosis of the early and late stages of the disease: stage I and II have moderate risk of relapse after surgical resection, whereas patients with stage III have a higher chance of recurrence
[2]. Recognized clinical risk factors for recurrence are emergency presentation, poorly differentiated tumor, depth of tumor invasion, and adjacent organ involvement (T4) [3–5]. However, these factors are insufficient to identify those patients with stage II CRC at high risk of recurrence and posterior metastasis or those patients with stage III CRC at low risk [6], leading to potential under-treatment or over-under-treatment [3].
Colon cancer metastasis is a tightly regulated process that requires aberrations in gene expression allowing cancer cells to
progress through various steps until they colonize a distant organ [7]. Probably the alterations necessary for recurrence are already present in the primary colon carcinoma, which should allow identifying prognostic signatures [8–10]. Gene-expression profil-ing-based assays have been successful as prognostic tool in breast cancer [11,12]. However, no signature has been adopted in routine clinical practice in CRC despite a large number of gene expression profiling studies on prognosis have been performed.
The aim of this work was to test the predictive ability of these published signatures as prognostic markers in a significant number of independent datasets, in order to understand their strengths and weakness and identify if any of them can be used clinically to guide decisions about adjuvant therapy for patients with stage II or III CRC.
Materials and Methods
Published Gene Expression Signatures and Validation Datasets
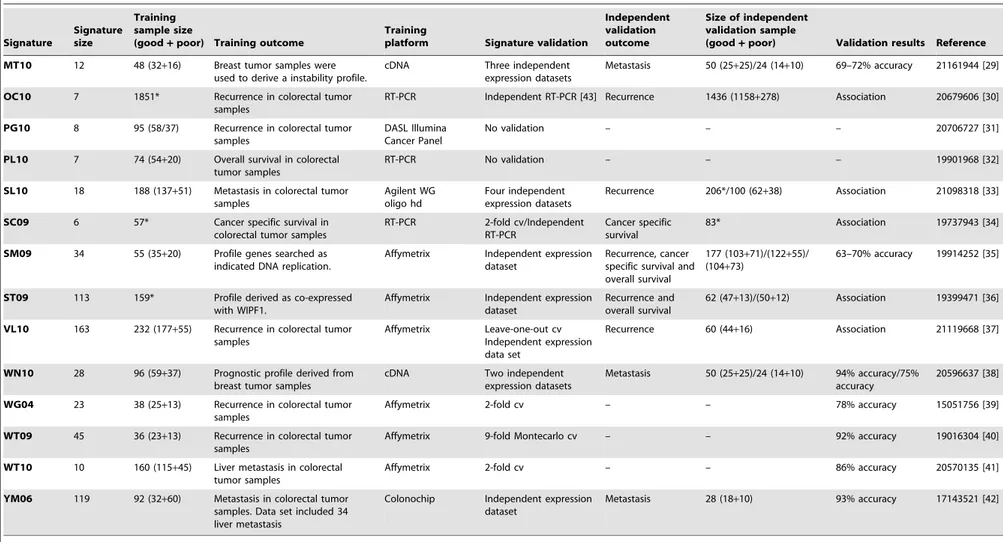
A systematic literature review was performed to identify studies that used gene expression data to predict prognosis in CRC [13]. The search was based on the PubMed database and was restricted to recent papers to increase validity (from January 2004 to December 2011). Files S1–S2, Table S1 and Figure 1 detail the selection protocol and PRISM checklist. Articles that provided a list of differentially expressed genes in primary tumor samples associated with CRC prognosis were included in our study. We indistinctly refer to these lists of genes as ‘signatures’ or ‘profiles’. Studies based on tissue microarray and those that exclusively were focused on differences between stages or between primary tumor and metastases were excluded. The studies finally included for analysis are described in Table 1 [14–43]. Publicly available datasets with whole-genome gene expression measures in CRC primary tumor samples were identified and downloaded from GEO [44] and ArrayExpress [45] microarray data repositories (Tables 2 and 3). Pre-processed series matrixes originally provided by the authors were used in our analysis.
Because different platforms and feature identifiers were used in signatures and gene expression datasets, a translation into the official Gene Symbol was done in order to have a common annotation. This translation was performed using the Universal Protein Resource annotation database [46], the online repository of HUGO Gene Nomenclature Committee [47] and the chip annotation files from the Affymetrix web site [48]. Unavoidably, no match was found for some features in some datasets and they were lost for subsequent analysis (File S3).
Statistical Analysis
Since follow-up time was not available for most of the datasets, a binary outcome was defined as a prognosis status (Table 2). Whenever possible, a minimum of three years of follow up was required for patients without tumor recurrence. Nevertheless, two datasets with no follow up information were included (GSE5206 and GSE10402) to increase the sample size. Stage IV individuals were included in the analysis as recurrence events as it was expected that the specific expression changes in poor prognostic samples remain unaltered in the primary tumor once the metastases has occurred. When data was available, subgroup analysis were performed according to stage and microsatellite instability status (MSS/MSI).
Each signature’s ability to predict prognosis was independently tested in each dataset with a binary classification approach using the Random Forest ensemble classifier (RF) [49,50]. Forests were grown with a high number of trees (5.000) in order to assure
out-of-bag error convergence. The minimum size of terminal nodes was set to one. For signatures evaluation, accuracy measures were computed from a 10-fold cross-validation (10CV) process in which partitions were stratified based on outcome. Nested in this process, the number of candidate variables at each split was selected to minimize the out-of-bag error. As suggested in [51], sub-sampling was carried out without replacement and using the same number of observations in each prognosis group (0.632 times frequency of the smallest group). Due to lack of balance in outcome groups in some datasets, RF showed a trend to preferably classify into the most frequent group. To correct this artifact, the classification vote cutoff was modified according to the corresponding prognosis group frequencies. All these analyses were performed using the R package randomForest [52].
To confirm our results, a radial kernel Support Vector Machine (SVM) based classifier was also used [53,54]. Due to unbalance, the same artifact described above was observed when applying the standard SVM classifier. So, we tried to correct it using an under-sampling strategy as follows [55]: i) select all samples from the less frequent group; ii) randomly select the same number of samples from the more frequent group; iii) repeat the process 25 times; iv) define the predicted labels using the outcome group frequencies as vote proportion cutoff for the classification rule. A 10CV process was carried out to compute accuracy measures with a nested 10CV for parameter tuning, both of them stratified by outcome groups. A wide range of values for cost and radial kernel parameters were evaluated during the tuning process (20 equidistant values from 0.001 to 1.000 in logarithm scale; 11 equidistant values ranging 0.056pto 206p, beingpthe number of features in each case). All these analysis were conducted with the R packagesvmpath[56].
The Matthews Correlation Coefficient (MCC) [57] was chosen as measure of classification accuracy [58]. This index combines test sensitivity and specificity. It ranges from 21 to 1 and its interpretation is similar to the Pearson’s correlation coefficient. In the context of a classification problem it is expected that MCC ranges from 0 (no prediction ability at all) to+1 (perfect prediction) with negative values near zero possibly occurring in random classifiers due to sample variability. MCC values lower than 0.3 can be considered as indicative of low predictive value as they correspond to less than 65% accuracy in balanced data. Sensitivity, specificity and overall accuracy rates were also computed for interpretation purposes.
The potential usefulness of the signatures on clinical practice was evaluated by means of the positive and negative likelihood ratios (LR+, LR-) and the predicted positive and negative post-test recurrence probabilities (PPTpr, NPTpr) in stage II and III samples separately [59].
To summarize signature’s global performance, each of the measures above was pooled across datasets to a unique index using weights proportional to each dataset sample size. In order to attenuate instability and bias in the cross-validation estimations, datasets with less than 10 samples per group and those used in the derivation of the profile in the original study were excluded from these computations [60].
Significance of MCC, accuracy, sensitivity, specificity, LR+, LR-, and differences of PPTpr and NPTpr were assessed using null distributions based on 100.000 permutations. Computations were done in the context of the theoretical framework for permutation tests [61] as implemented in the R package coin [62]. Intervals at 95% were built using the Bias Corrected and Accelerated bootstrap (BCa) method with 5.000 resamples stratified by prognosis group [63]. Empirical influence values were estimated by the usual jackknife method. These calculations Clinical Value of Signatures in Colorectal Cancer
Clinical Value of Signatures in Colorectal Cancer
were done using the R packageboot[64]. In all cases, permutations and resampling were performed directly on the predicted values provided by the original models and no remodeling was done. Since this strategy doesn’t take into account the dependence in predictions implicitly imposed by the 10CV, it could potentially retain some bias towards refusing null hypothesis in the statistical tests when effects are small [65].
Results
Global Prognosis Performance of the Published Signatures
The literature search identified 29 papers reporting 31 signatures proposed as valid multi-gene tumor-outcome classifica-tion tool (Table 1 and File S4). Almost all signatures were based on microarray experiments with the exception of three signatures obtained from PCR experiments (OC10, PL10, SC09). The number of genes (signature size) ranged from 3 to 537.
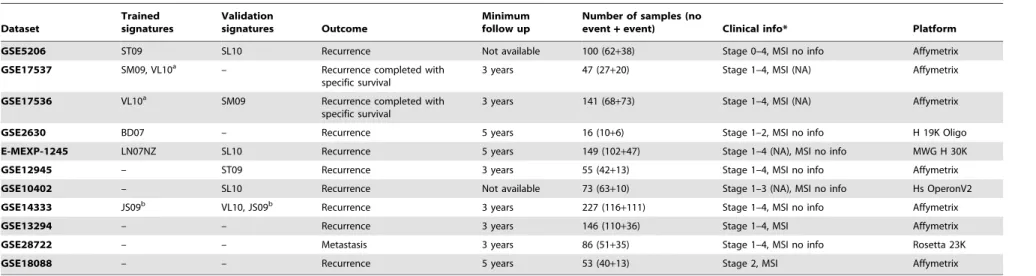
Despite recommendations to provide raw data for microarray experiments, training datasets were publicly available only for five signatures: ST09, SM09, BD07, LN07,and VL10. Six additional gene expression datasets with information about recurrence were identified in GEO and ArrayExpress, for a total of 11 datasets available for analysis (Table 2).
For all combinations of signatures and datasets, the MCC and the corresponding p-value was computed. Figure 2 shows a color map of the MCC values (details provided in File S5 and Figure S1). As expected, the five signatures for which the training was available showed significant association and a reasonable predic-tive accuracy in their training datasets (black-highlighted cells at the top left quadrant in the plot in Figure 2). For all these signatures, MCC values were greater than 0.35 except forVL10 and dataset GSE17536 (MCC = 0.32). Nevertheless, in the independent datasets the performance was heterogeneous and none of these five signatures could reproduce the degree of predictive ability shown in the training datasets. When the remaining 26 signatures (those without training set available) were evaluated in the 11 datasets, similar results were obtained: some signatures showed a significant association with patient outcome but discrimination accuracy was low or moderate.
A global MCC was computed for each signature to summarize their predictive ability across datasets (see Figure 2). Signatures BT04andKN11emerged as the most predictive, both with a MCC value of 0.25 (95% CI 0.19 to 0.31 and 0.19 to 0.30 respectively, p-values,105). Although nearly all the signatures reached the 5% significance level in this pool estimate that combines 396 events in 1077 patients, only three signatures exceed a 0.20 global MCC. The maximum value obtained for the proportion of correctly classified cases was only 63% (BT04, sensitivity = 65% and specificity = 61%) and it ranged from 52 to 61% for the remaining profiles (Table 4, File S6).
To assess influence of the statistical methodology in the results, a re-analyses was performed using an alternative method (SVM). Although some variations in the signatures ranking of performance were observed, similar results were obtained in terms of pooled MCCs (Figure S2 and File S7).
Subgroup Analysis: Prognosis Performance of Published Signatures Stratified by Stage or MSI Status
In order to assess the signatures’ performance in specific subgroups of tumors, a stratified analysis was done according to
stage (stage II/stage III) and microsatellite instability status (MSS/ MSI), when this information was available (see Table 3). Datasets contributing with less than 10 events were excluded.
Similar to the analysis including all samples, the performance of the signatures was heterogeneous when stage II and III tumor samples were analyzed separately (Figures S3 and S4). In the pooled MCC, 17 signatures in stage II and 22 signatures in stage III showed a significant association with prognosis (p-value,0.05). Six signatures ranked in the top ten in both sub-analyses. The MCC values obtained in stage II were much lower than those in stage III. In stage II, the best global MCC were achieved byYM06 (MCC = 0.21; 95%CI 0.11 to 0.31) and BT04 (MCC = 0.20; 95%CI 0.10 to 0.31). In stage III, the two best signatures were AJ08(MCC = 0.42; 95%CI 0.28 to 0.55) andVL10(MCC = 0.40; 95%CI 0.23 to 0.55). Table 4, Files S5, S6 and S7; and Figures S3, S4, S5, S6, S7 and S8 contain more details.
MSI status information was only available for two datasets (GSE13294 and GSE18088). In the analysis of MSS samples, those MCC values that reached significance were moderate (0.19 to 0.38) and only three signatures showed association in both datasets (p-value,0.1). Regarding the MSI subset, only signature HO09provided a reasonably classification accuracy (MCC = 0.30) (File S5).
Potential Clinical Value of Signatures in Stage II and III Tumors
Despite the low discrimination ability (shown by their pooled MCC), the signatures could still have usefulness in clinical practice. Briefly, a useful clinical test typically shows large LR+
and low LR- which translate into more discriminant post-test event probabilities: high PPTpr and low NPTpr compared to thea priori expected event proportion. So, even tests with low discrimination ability according to pure statistic criteria could still be useful in clinical practice if PPTpr and NPTpr are significantly far enough from the probability expected in population when no test is performed. To explore this issue, positive and negative post-test probabilities of recurrence were calculated for stages II and III. The prior recurrence risk in patients with CRC was assumed to be 20% in stage II and 34% in stage III [4,66].
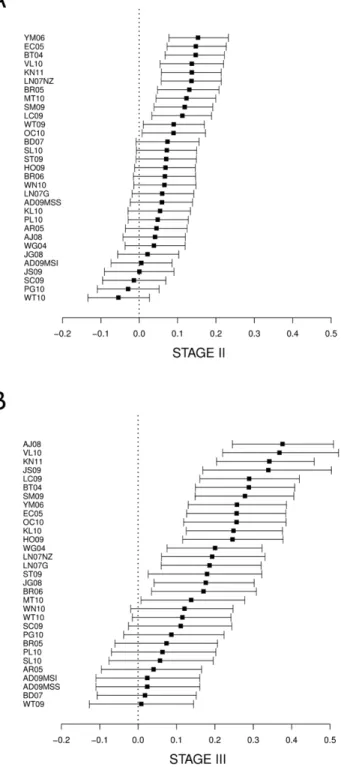
For the best signature in stage II (YM06), the post-test recurrence probability for the high-risk group increased to 28%, and for the low-risk group the prediction was 12% probability of recurrence (16% absolute difference, Figure 3A). The best profile in stage III (AJ08) increased to 56% the post-test probability of recurrence for the high-risk group, while the post-test probability was 18% for the low-risk group (38% absolute difference, Figure 3B). Detailed results for all signatures are shown in Files S6 and S7.
Discussion
The identification of molecular prognostic tools to facilitate treatment decisions is an important step for individualized patient therapy [10]. Here we report an exhaustive analysis of published multi-gene prognostic classifiers in colorectal cancer, analyzing their external validity in a large number of independent datasets that total more than 1.000 patients. The present work is focused in two objectives which are addressed by the two main parts of the analysis: to evaluate the global performance of the signatures from a statistical point of view, in which all stages were included, and to
Figure 1. PRISMA Diagram which depicts the flow of information through the different phases of the prognosis signatures studies systematic review.
doi:10.1371/journal.pone.0048877.g001
Clinical Value of Signatures in Colorectal Cancer
Table 1.Description of signatures used in this work.
Signature
Signature size
Training sample size
(good+poor) Training outcome
Training
platform Signature validation
Independent validation outcome
Size of independent validation sample
(good+poor) Validation results Reference
AD09MSI 13 65 (56+9) Recurrence in colorectal tumor
samples
Affymetrix No validation – – – 19156145 [14]
AD09MSS 3 195 (173+22) Recurrence in colorectal tumor samples
Affymetrix Independent expression dataset
Recurrence 50 (25+25) Asociation 19156145 [14]
AJ08 36 20 (10+10) A proliferation signature was derived from cell lines and a data set containing physiological expression of human colon crypts
MWG 30 K Oligo Set
Two independent expression datasets
Recurrence 108 (84+24) Association 19238634 [15]
AR05 72 25 (15+10) Recurrence in colorectal tumor samples
Affymetrix Leave-one-out cv/ Independent TMA (1 protein)
Recurrence 137* 88% accuracy/ Association
16143127 [16]
BD07 8 16 (10+6) Recurrence in colorectal tumor samples
Human 19 K Oligo Array
No validation – – – 17390049 [17]
BR05 30 18 (9+9) Recurrence in colorectal tumor
samples
Affymetrix 3-fold cv – – 78% accuracy 16091735 [18]
BR06 30 50 (25+25) Recurrence in colorectal tumor samples
Affymetrix 2-fold cv/k-fold Montecarlo cv
– – 80% accuracy/76% accuracy
16966692 [19]
BT04 244 24 (13+9) Metastasis in colorectal tumor samples
cDNA Leave-one-out cv – – 82% accuracy 14973550 [20]
EC05 43 78 (32+46) Overall survival in colorectal tumor samples
cDNA Leave-one-out cv/ Independent expression dataset
Prognosis not specified
95* 90% accuracy/ Association
15908663 [21]
HO09 32 6 (3+3) Cell lines were used to build a metastatic potential profile.
Affymetrix Independent expression dataset (5 genes)
Overall survival 181* Association 20077526 [22]
JG08 7 73 (42+31) Recurrence in colorectal tumor samples
Affymetrix Independent expression dataset/Independent RT-PCR
Recurrence 123 (105+18)/110 (86+24) 68% accuracy/82% accuracy
18556775 [23]
JS09 163 209 (86+123) Duke’s A vs D colorectal tumor samples. Data set included 30 distant metastasis.
Affymetrix 2-fold cv Recurrence and overall survival
99* Association 19996206 [24]
KL10 36 100 (69+31) Recurrence in rectum samples Illumina Sentix Human-6 Expression Beadchip
5-fold cv/6-fold Montecarlo cv
– – 71% accuracy/80% accuracy
20670856 [25]
KN11 634 215 (142+73) Metastasis in colon tumor samples
cDNA 5-fold cv/Independent expression dataset
Metastasis 144 (85+59) 0.68 AUC/0.68 AUC 22067406 [26]
LC09 54 23 (9+14) Only rectum samples used to build a chemoradiotherapy repondent signature
cDNA No validation – – – 19380020 [27]
LN07G 19 55 (29+26) Recurrrence in colorectal tumor samples
Affymetrix Independent expression dataset
Recurrrence 149 (102+47) 67% accuracy 17255271 [28]
LN07NZ 22 149 (102+47) Recurrence in colorectal tumor samples
MWG 30 K Oligo Set
Independent expression dataset
Recurrrence 55 (29+26) 71% accuracy 17255271 [28]
Clinical
Value
of
Signatures
in
Colorec
tal
Cancer
PLOS
ONE
|
www.ploson
e.org
5
November
2012
|
Volume
7
|
Issue
11
|
Table 1.Cont.
Signature
Signature size
Training sample size
(good+poor) Training outcome
Training
platform Signature validation
Independent validation outcome
Size of independent validation sample
(good+poor) Validation results Reference
MT10 12 48 (32+16) Breast tumor samples were used to derive a instability profile.
cDNA Three independent expression datasets
Metastasis 50 (25+25)/24 (14+10) 69–72% accuracy 21161944 [29]
OC10 7 1851* Recurrence in colorectal tumor samples
RT-PCR Independent RT-PCR [43] Recurrence 1436 (1158+278) Association 20679606 [30]
PG10 8 95 (58/37) Recurrence in colorectal tumor samples
DASL Illumina Cancer Panel
No validation – – – 20706727 [31]
PL10 7 74 (54+20) Overall survival in colorectal tumor samples
RT-PCR No validation – – – 19901968 [32]
SL10 18 188 (137+51) Metastasis in colorectal tumor
samples
Agilent WG oligo hd
Four independent expression datasets
Recurrence 206*/100 (62+38) Association 21098318 [33]
SC09 6 57* Cancer specific survival in colorectal tumor samples
RT-PCR 2-fold cv/Independent RT-PCR
Cancer specific survival
83* Association 19737943 [34]
SM09 34 55 (35+20) Profile genes searched as indicated DNA replication.
Affymetrix Independent expression dataset
Recurrence, cancer specific survival and overall survival
177 (103+71)/(122+55)/ (104+73)
63–70% accuracy 19914252 [35]
ST09 113 159* Profile derived as co-expressed with WIPF1.
Affymetrix Independent expression dataset
Recurrence and overall survival
62 (47+13)/(50+12) Association 19399471 [36]
VL10 163 232 (177+55) Recurrence in colorectal tumor samples
Affymetrix Leave-one-out cv Independent expression data set
Recurrence 60 (44+16) Association 21119668 [37]
WN10 28 96 (59+37) Prognostic profile derived from breast tumor samples
cDNA Two independent expression datasets
Metastasis 50 (25+25)/24 (14+10) 94% accuracy/75% accuracy
20596637 [38]
WG04 23 38 (25+13) Recurrence in colorectal tumor samples
Affymetrix 2-fold cv – – 78% accuracy 15051756 [39]
WT09 45 36 (23+13) Recurrence in colorectal tumor
samples
Affymetrix 9-fold Montecarlo cv – – 92% accuracy 19016304 [40]
WT10 10 160 (115+45) Liver metastasis in colorectal tumor samples
Affymetrix 2-fold cv – – 86% accuracy 20570135 [41]
YM06 119 92 (32+60) Metastasis in colorectal tumor samples. Data set included 34 liver metastasis
Colonochip Independent expression dataset
Metastasis 28 (18+10) 93% accuracy 17143521 [42]
Signature: signature name;Training dataset: public training data set if used in this work;Validation dataset: public test data set if used in this work; Signature size: reported signature size in the original paper (genes or features):;Training sample size (good+poor): sample size of training data set, separating good and poor prognosis when reported;Training outcome: outcome used to derive the signature;Training platform: platform
used for the training data set;Signature validation: type of validation for signature if performed;Independent validation outcome: outcome used for independent validation if performed; Validation results:for each validation performed, accuracy classification measures or association assessing if provided;Reference: PMID and reference for publishing paper.*Frequencies of subgroups were not available.Abbreviations:TMA: tissue microarray;cv: cross-validation;ns: not specified.
doi:10.1371/journal.pone.0048877.t001
Clinical
Value
of
Signatures
in
Colorec
tal
Cancer
PLOS
ONE
|
www.ploson
e.org
6
November
2012
|
Volume
7
|
Issue
11
|
Table 2.Datasets description.
Dataset
Trained signatures
Validation
signatures Outcome
Minimum follow up
Number of samples (no
event+event) Clinical info* Platform
GSE5206 ST09 SL10 Recurrence Not available 100 (62+38) Stage 0–4, MSI no info Affymetrix
GSE17537 SM09, VL10a – Recurrence completed with
specific survival
3 years 47 (27+20) Stage 1–4, MSI (NA) Affymetrix
GSE17536 VL10a SM09 Recurrence completed with
specific survival
3 years 141 (68+73) Stage 1–4, MSI (NA) Affymetrix
GSE2630 BD07 – Recurrence 5 years 16 (10+6) Stage 1–2, MSI no info H 19K Oligo
E-MEXP-1245 LN07NZ SL10 Recurrence 5 years 149 (102+47) Stage 1–4 (NA), MSI no info MWG H 30K
GSE12945 – ST09 Recurrence 3 years 55 (42+13) Stage 1–4, MSI no info Affymetrix
GSE10402 – SL10 Recurrence Not available 73 (63+10) Stage 1–3 (NA), MSI no info Hs OperonV2
GSE14333 JS09b VL10, JS09b Recurrence 3 years 227 (116
+111) Stage 1–4, MSI no info Affymetrix
GSE13294 – – Recurrence 3 years 146 (110+36) Stage 1–4, MSI Affymetrix
GSE28722 – – Metastasis 3 years 86 (51+35) Stage 1–4, MSI no info Rosetta 23K
GSE18088 – – Recurrence 5 years 53 (40+13) Stage 2, MSI Affymetrix
Dataset:GEO or Array Express dataset identifier;Trained signatures:signatures which used that dataset as training sample, if any;Validation signatures:signatures which used that dataset as independent validation sample; Outcome:type of relapse used for that dataset;Minimum follow up:minimum follow up required for that dataset, when this info was available;Number of samples:number of samples contained in that dataset, showing good and bad prognosis’ separately between brackets;Clinical info: samples ranges of stage and microsatellite status when this information was available;Platform:datasets’ hybridization platform.*NA: the authors do not provide clinical information about MSI and/or stage. No info: Although authors provide clinical information in the paper, samples are not labelled with this information in GEO or ArrayExpress.a.Stage II and III samples from data sets GSE17536 and GSE17537 were jointly used to derive signature VL10, but the later did not include enough events at these stage subgroups.b.Signature JS09 was built with Duke’s A and D and validated with Duke’s B and C samples.
doi:10.1371/journal.pone.0048877.t002
Clinical
Value
of
Signatures
in
Colorec
tal
Cancer
PLOS
ONE
|
www.ploson
e.org
7
November
2012
|
Volume
7
|
Issue
11
|
assess their potential clinical usefulness, restricted to stage II and III CRC patients, by means of appropriate accuracy measures (post-test probabilities).
A meta-analysis of gene expression profiles in stage II CRC has been previously reported by Luet al.[67]. In that study, promising results were reported regarding predictive accuracy, but the analysis was confined to the same datasets and predictions used in the original studies. To our knowledge, our study is the first meta-analysis in which prediction accuracy of many signatures is measured in a large number of independent CRC samples to assess external validity and their subsequently potential usefulness in clinics.
In terms of global performance, our results indicate that in their training dataset, most signatures showed a significant association with prognosis and could reasonably predict the outcome. However, none of the signatures performed satisfactorily when the prediction ability was assessed in independent datasets. The best pooled MCC was 0.25 (BT04), which should be considered a low classification value. As a reference, stage provides an MCC of 0.23 (data not shown).
Next, we focused in specific performance of signatures in stage II and III patients, who could benefit more of an accurate prognosis prediction since adjuvant chemotherapy could be tailored to their predicted recurrence risk. Although association with outcome was observed for 17 signatures in stage II, their predictive ability can only be considered poor from a statistical point of view. Otherwise, MCC values in stage III were observed to be near double those in stage II. Nevertheless, only eight signatures achieved a 0.30 pooled MCC value, considered as indicative of moderate predictive value.
Although poor results were observed in terms of classification accuracy, almost all profiles (30) showed a significant association with prognosis when tested in independent datasets (p-value ,0.05). Notice however that significant association only means that a signature prediction is not completely random (MCC = 0). Association is not sufficient to be useful since, with enough sample size, small effects can be significant. Better indicators of potential usefulness than significance are magnitude of the sensitivity and specificity or derived measures like the MCC or likelihood ratios,
Figure 2. Heatmap showing Matthews Correlation Coefficient (MCC) values for each signature in each dataset as result of analyses with Random Forest.Rows correspond to signatures and columns to datasets. Last column shows a pooled MCC across datasets using sample size as weights. Black lines delimit the first five signatures for which training datasets were available (cells highlighted in black). Cells representing signatures and datasets used to validate them are highlighted in blue. Color scale represents the MCC values: the darker the color, the higher MCC (see the legend). Negative values were collapsed to zero.
doi:10.1371/journal.pone.0048877.g002
Clinical Value of Signatures in Colorectal Cancer
Table 3.Clinical characteristics of datasets.
GSE5206 GSE17537 GSE17536 GSE2630 E-MEXP-1245 GSE12945 GSE10402 GSE14333 GSE13294 GSE28722 GSE18088 Total
Good 62 (62.0%) 27 (57.4%) 68 (48.2%) 10 (62.5%) 102 (68.5%) 42 (76.4%) 63 (86.3%) 116 (51.1%) 110 (75.3%) 51 (59.3%) 40 (75.5%) 691 (63.2%)
Prognosis Bad 38 (38.0%) 20 (42.6%) 73 (51.8%) 6 (37.5%) 47 (31.5%) 13 (23.6%) 10 (13.7%) 111 (48.9%) 36 (24.7%) 35 (40.7%) 13 (24.5%) 402 (36.8%)
Total 100 (100.0%) 47 (100.0%) 141 (100.0%) 16 (100.0%) 149 (100.0%) 55 (100.0%) 73 (100.0%) 227 (100.0%) 146 (100.0%) 86 (100.0%) 53 (100.0%) 1093 (100.0%)
Male 46 (46.0%) 21 (44.7%) 79 (56.0%) 11 (68.8%) 70 (47.0%) 30 (54.5%) 133 (58.6%) 71 (50.4%) 26 (49.1%) 487 (52.4%)
Gender Female 54 (54.0%) 26 (55.3%) 62 (44.0%) 5 (31.2%) 79 (53.0%) 25 (45.5%) 94 (41.4%) 70 (49.6%) 27 (50.9%) 442 (47.6%)
Total 100 (100.0%) 47 (100.0%) 141 (100.0%) 16 (100.0%) 149 (100.0%) 55 (100.0%) 227 (100.0%) 141 (100.0%) 53 (100.0%) 929 (100.0%)
Miss 0 (0.0%) 0 (0.0%) 0 (0.0%) 0 (0.0%) 0 (0.0%) 0 (0.0%) 0 (0.0%) 5 (3.4%) 0 (0.0%) 164 (15.0%)
Age Mean (Sd) 64 (14.2) 61 (13.5) 65 (13.0) 64 (11.2) 64 (11.6) 67 (12.8) 65 (12.5) 63 (12.5) 65 (12.2) 65 (12.7)
I 15 (15.5%) 4 (8.5%) 18 (12.8%) 6 (37.5%) 11 (20.0%) 31 (13.7%) 5 (3.4%) 13 (15.3%) 0 (0.0%) 103 (11.9%)
II 29 (29.9%) 9 (19.1%) 38 (27.0%) 10 (62.5%) 23 (41.8%) 64 (28.2%) 123 (84.2%) 44 (51.8%) 53 (100.0%) 393 (45.3%)
Stage III 33 (34.0%) 17 (36.2%) 46 (32.6%) 0 (0.0%) 16 (29.1%) 71 (31.3%) 10 (6.8%) 23 (27.1%) 0 (0.0%) 216 (24.9%)
IV 20 (20.6%) 17 (36.2%) 39 (27.7%) 0 (0.0%) 5 (9.1%) 61 (26.9%) 8 (5.5%) 5 (5.9%) 0 (0.0%) 155 (17.9%)
Total 97 (100.0%) 47 (100.0%) 141 (100.0%) 16 (100.0%) 55 (100.0%) 227 (100.0%) 146 (100.0%) 85 (100.0%) 53 (100.0%) 867 (100.0%)
Miss 3 (3.0%) 0 (0.0%) 0 (0.0%) 0 (0.0%) 0 (0.0%) 0 (0.0%) 0 (0.0%) 1 (1.2%) 0 (0.0%) 226 (20.7%)
Colon 75 (75.0%) 16 (100.0%) 149 (100.0%) 26 (47.3%) 73 (100.0%) 193 (85.4%) 121 (82.9%) 72 (83.7%) 53 (100.0%) 778 (86.1%)
Site Rectum 25 (25.0%) 0 (0.0%) 0 (0.0%) 29 (52.7%) 0 (0.0%) 33 (14.6%) 25 (17.1%) 14 (16.3%) 0 (0.0%) 126 (13.9%)
Total 100 (100.0%) 16 (100.0%) 149 (100.0%) 55 (100.0%) 73 (100.0%) 226 (100.0%) 146 (100.0%) 86 (100.0%) 53 (100.0%) 904 (100.0%)
Miss 0 (0.0%) 0 (0.0%) 0 (0.0%) 0 (0.0%) 0 (0.0%) 1 (0.4%) 0 (0.0%) 0 (0.0%) 0 (0.0%) 189 (17.3%)
MSS 73 (50.0%) 34 (64.2%) 107 (53.8%)
Microsatellite MSI 73 (50.0%) 19 (35.8%) 92 (46.2%)
stability Total 146 (100.0%) 53 (100.0%) 199 (100.0%)
Miss 0 (0.0%) 0 (0.0%) 894 (81.8%)
Well 8 (8.3%) 1 (3.1%) 12 (8.5%) 0 (0.0%) 2 (3.8%) 23 (7.1%)
Moderately 78 (81.2%) 24 (75.0%) 105 (74.5%) 28 (50.9%) 35 (66.0%) 242 (75.2%)
Grade Poorly 10 (10.4%) 7 (21.9%) 24 (17.0%) 27 (49.1%) 16 (30.2%) 57 (17.7%)
Total 96 (100.0%) 32 (100.0%) 141 (100.0%) 55 (100.0%) 53 (100.0%) 322 (100.0%)
Miss 4 (4.0%) 15 (31.9%) 0 (0.0%) 0 (0.0%) 0 (0.0%) 771 (70.5%)
doi:10.1371/journal.pone.0048877.t003
Clinical
Value
of
Signatures
in
Colorec
tal
Cancer
PLOS
ONE
|
www.ploson
e.org
9
November
2012
|
Volume
7
|
Issue
11
|
which measure the ability to correctly classify patients by their outcome.
Despite these disappointing results according to pure statistic criteria of discrimination ability, signatures might still be useful in clinical practice if they provide additional risk stratification within known sub-populations defined by relevant clinical variables. The positive and negative post-test probabilities of recurrence were calculated stratified by stage to identify the degree of prognosis discrimination beyond stage. The results for the best signature in stage II samples (YM06) moderately modified the 20% a priory recurrence probability to a 28% and 12% for the positive and negative post-test result, respectively. This discriminating ability is not completely satisfactory given the large false negative and positive rates that it would induce, but might contribute to the identification of stage II patients at high risk for recurrence leading to a better indication of adjuvant chemotherapy [6]. The best signature for stage III patients (AJ08) resulted in a larger discrimination of risk groups, with a difference between positive and negative post-test probabilities of 38%. However, the low risk group still showed a relatively large recurrence probability of 18%, too high to recommend avoiding adjuvant chemotherapy as it is indicated nowadays.
Potential explanations for these modest results must be considered. From a statistical point of view, technical problems such as low sample size, the number of genes included in the classifier, translation between platforms or cohort heterogeneity, among others, have been reported as potential explanations for the lack of clinical translation of genomic classifiers (see references [68,69,70]). In our case and for some signatures, only association with prognosis was reported in the original work, thus the authors implicitly recognized poor classification ability. In those profiles that were reported to be highly discriminative, the reason could be a poor control of over-fitting in the training methodology, since external validation was performed only in three studies and the test samples sizes were small (JG08,WN10andYM06, see Table 1). The need to map probes to genes for signatures that had used different platforms may also have affected the results, since it is known that even multiple probes of the same gene in the same platform may show important variability. We could not detect, however, that platform had a relevant effect in the MCC estimates.
Low availability of information and heterogeneity in clinical data is inherent to the use of public datasets and this is a major impediment for repeatability and integration of published micro-array studies [71]. Datasets differ in patient characteristics, inclusion criteria and outcome definitions. A precise and homogeneous definition of the outcome across datasets would be desirable in order to obtain an accurate estimation of the signatures’ prognosis ability. Nevertheless, heterogeneity of datasets allows for a more pragmatic analysis and the estimates should reflect the expected results when profiles were used in real practice, since hospital settings are also heterogeneous. Since different outcomes are supposed to be highly correlated [72], we decided to prioritize a minimum sample size availability to get more precise estimates and avoid uncertainty introduced by datasets with less than 10 events [60]. The requirement of a three years minimum follow up also allowed maximizing sample size and was supported by the literature: it has been described that most of these relapses occur within 3 years after surgery and it is recommended to be used as endpoint in adjuvant clinical trials [73]. Therapy regimen followed by treated patients was not considered, as this information was not available for most of the analyzed datasets. Table 4. Global performance of top 10 signatures for all, stage II and stage III samples. ALL SAMPLES STAGE II STAGE III Signature MCC
Accuracy (Sensitivity, Specificity)
Signature
MCC
Accuracy (Senitivity, Specificity) Positive Post-Test Probability Negative Post-Test Probability
Signature
MCC
Accuracy
(Senitivity,
Specificity)
Positive Post-Test Probability Negative Post-Test Probability
BT04 0.254 63% (65%, 61%) YM06 0.209 58% (69%, 55%) 28% 1 2% AJ08 0.415 71% (69%, 72%) 56% 18% KN11 0.247 61% (65%, 60%) BT04 0.202 59% (66%, 57%) 28% 1 3% VL10 0.400 70% (68%, 72%) 55% 19% VL10 0.212 60% (63%, 59%) EC05 0.199 58% (68%, 56%) 28% 1 3% KN11 0.394 69% (70%, 67%) 53% 18% YM06 0.192 59% (61%, 58%) KN11 0.187 57% (68%, 54%) 27% 1 3% JS09 0.385 69% (70%, 67%) 52% 19% AJ08 0.190 59% (63%, 57%) VL10 0.181 58% (66%, 55%) 27% 1 3% LC09 0.324 66% (69%, 63%) 49% 20% ST09 0.178 58% (61%, 56%) LN07NZ 0.179 59% (64%, 58%) 27% 1 4% BT04 0.322 66% (65%, 66%) 50% 21% LN07NZ 0.176 59% (61%, 57%) BR05 0.172 59% (62%, 58%) 27% 1 4% SM09 0.312 65% (68%, 63%) 49% 21% LC09 0.171 58% (60%, 57%) MT10 0.158 57% (65%, 54%) 26% 1 4% YM06 0.307 64% (67%, 62%) 47% 22% EC05 0.167 58% (60%, 56%) SM09 0.153 56% (66%, 52%) 26% 1 4% OC10 0.298 64% (64%, 64%) 48% 22% JS09 0.165 57% (62%, 55%) LC09 0.151 53% (69%, 49%) 25% 1 4% KL10 0.292 64% (68%, 60%) 47% 22% Abbreviations : MCC : M atthews Correlation Coefficient. doi:10.1371/journal.pone. 0048877.t004
Clinical Value of Signatures in Colorectal Cancer
Patients diagnosed at stage IV were included and considered recurrent events to assess global performance. This implicitly assumes that the molecular changes playing a driver role to disease relapse remain unchanged in primary tumor after recurrence has occurred. Though this underlying hypothesis could be question-able, it was shared by many of the original studies analyzed that
included stage IV subjects in their training and test datasets (AJ08, BT04, EC05, HO09,JS09, LN07G, LN07NZ, PL10,SC09, SL10, SM09,ST09,VL10andYM06).
From a biological perspective, this moderate prognosis ability could be explained by heterogeneity in tumor cell populations that might dilute the prognosis molecular signal. It is well known that CRC tumors are composed not only by tumor epithelial cells but also by cancer-associated stromal fibroblasts (CAFs), endothelial cells or inflammatory cells, among others [74]. Moreover, those cancer cells at the invasive front are different from those in the main tumor mass [75]. The problem of the tumor bulk heterogeneity can be overcome by isolating specific cells popula-tions by laser microdissection technology [76]. In this regard, one out of the eleven sample sets used in this study (GSE12945) used this technique to specifically hybridize RNA from tumor cells. Surgical specimens from other sample sets were reviewed by a pathologist to assess a minimum tumor content of 80% (GSE5206, GSE18088, E-MEXP-1245). However, we did not observe significant differences in signatures performance regarding the tumor-cell enrichment method used.
The gene lists included in this study had little overlap: out of 1.530 genes reported in the 31 profiles, only two were shared by four signatures; 10 were shared by three signatures and 102 were present in two profiles. This result was not unexpected, since it has previously been reported [77,78]. The lack of gene overlap is generally interpreted as if each signature is random sampling of a small subset of genes from a larger signature that represent the involved pathways [79,80].
Colon and rectum tumors have been included indiscriminately in this work since in a previous report we showed that no significant differences exist between colon and rectum tumors at transcriptomic level [81]. However, this decision might explain some of the poor performance of the signatures, since it is known that surgery quality is an important prognostic factor in rectal cancer and less important in colon [82]. In the data used in this work, no significant association was found between prognosis and tumor location (data not shown).
The choice of the statistical tools for analyses was an important matter. The intention of this analysis was to test the performance of published prognostic signatures in independent datasets rather than trying to reproduce them using the original methodology. In this context, Random Forest arises as an efficient method that performs very well compared with other competitors [49,83]. As expected, the signatures tested in their training dataset showed the highest accuracy. Moreover, we succeeded in reproducing the validation results of three out of the five signatures for which data was available (SM09,VL10andJS09). However, association with prognosis was not observed for profileST09in dataset GSE12945, and it was only observed in one out of the three independent validation datasets that are included in this work for profileSL10, although good performance was originally reported (see Table 1, Figure 2 and File S5). A reason could be that the methodology we used does not capture well the prognosis value of some signatures, which might have been developed with more elaborated algorithms to define the risk prediction in the original study. Because this was a recognized limitation of this work, analyses were redone using an alternative methodology (SVM), which provided similar results (Figures S2, S5 and S6, File S7). InST09 profile, a semi-supervised approach was used while in SL10 a nearest-centroid approach was applied which was not properly described in the paper.SL10was developed in an Agilent platform and the mapping of the probes to different validation platforms used in the datasets might be an addition source of divergence.
Figure 3. Differences between positive and negative post-test probabilities of recurrence and their 95% confidence interval for stage II (A) and stage III (B).Prevalence probability of recurrence for stage II and III were assumed to be 20 and 34% respectively. Signatures are listed in decreasing order of post-tests probability differences.
doi:10.1371/journal.pone.0048877.g003
Clinical Value of Signatures in Colorectal Cancer
Although some works reported that simpler methods for supervised learning in the context of high-dimensional molecular data could perform equally than those used in this paper which are more elaborated [84], we chose RF and SVM because they are reported to be robust to over-fitting and the presence of noise, and they capable to learn complex classification functions. These properties are especially desirable in our study as we try to capture the hypothetical prediction ability of signatures created with very heterogeneous methodologies [49,50,52,53]. So, our choice of these methodologies reflects our efforts in finding the prognosis information reported in the original works, though we may have failed in some complex signatures.
It is worth noting that two of the analyzed signatures correspond to current available commercial test for CRC prognosis. Oncotype DX was derived from OC10 profile [85] and, interestingly, the reported risk estimations for strata in stage II in their validation study [43] were similar to those obtained in our work (PPTpr = 25% and 22%, NPTpr = 12% and 16% respectively). The algorithm for risk estimation with Oncotype DX implies the use of additional clinical information as tumor extent and mismatch repair status, which substantially improves its risk stratification. To our knowledge, no validation results for stage III patients have been published yet. Coloprint test was derived from SL10, which showed a low performance in our analysis, possibly for the reasons discussed above.
The characteristics of the available test datasets could be other reason of poor performance. Intriguingly, in some datasets (e.g. GSE17537) the performance of signatures was better than for others. This effect was not due to sample size neither tumor cell enrichment: Datasets with the largest number of events (GSE14333 and GSE13294) were not well classified by any of the tested signatures, and datasets with high tumor cell content showed uneven performance (e.g. GSE12945, GSE5206).
Conclusions
Although most of the published signatures of prognosis in CRC tested in this analysis have shown significant statistical association with prognosis, their ability to accurately classify independent samples into high-risk and low-risk groups is limited. Thus, even when prognosis differences exist in expression data, higher accuracy is needed to consider a signature useful for the clinical practice. Well-designed studies, with large sample size, and preferably prospective are needed to accurately identify those patients at risk of recurrence, especially among patients with stage II CRC tumors.
Supporting Information
Figure S1 Boxplots showing signatures’ MCC values in each
dataset and pooled MCC. Dataset GSE2630 was excluded from pooled analysis due to low sample size.
(PDF)
Figure S2 Heatmap showing Matthews Correlation Coefficient values (MCC) for each signature in each dataset as result of analyses with Support Vector Machine. Rows correspond to signatures and columns to datasets. Last column shows a pooled MCC across datasets using sample size as weights. Black lines delimit the first five signatures for which training datasets were available (cells highlighted in black). Cells representing signatures and datasets used to validate them are highlighted in blue. Color scale represents the MCC values: the darker the color, the higher MCC (see the legend). Negative values were collapsed to zero. (PDF)
Figure S3 Heatmap showing Matthews Correlation Coefficient (MCC) in stage II tumors as result of analyses with Random Forest. Empty columns are placed in case of no available data and datasets with less than 10 events, which were excluded from analyses.
(PDF)
Figure S4 Heatmap showing Matthews Correlation Coefficient (MCC) in stage III tumors as result of analyses with Random Forest. Empty columns are placed in case of no available data and datasets with less than 10 events, which were excluded from analyses.
(PDF)
Figure S5 Heatmap showing Matthews Correlation Coefficient (MCC) in stage II tumors as result of analyses with Support Vector Machine. Empty columns are placed in case of no available data and datasets with less than 10 events, which were excluded from analyses.
(PDF)
Figure S6 Heatmap showing Matthews Correlation Coefficient (MCC) in stage III tumors as result of analyses with Support Vector Machine. Empty columns are placed in case of no available data and datasets with less than 10 events, which were excluded from analyses.
(PDF)
Figure S7 Example of outcome association in stage II samples using disease free survival information: Kaplan-Meier estimates for risk groups predicted by signature YM06 in GSE13294 dataset (Random Forest results).
(PDF)
Figure S8 Example of outcome association in stage III samples using disease free survival information: Kaplan-Meier estimates for risk groups predicted by signature AJ08 in GSE14333 dataset (Random Forest results).
(PDF)
Table S1 Excluded papers by eligibility criteria in the literature review.
(PDF)
File S1 Details on the prognosis signatures studies systematic review containing inclusion and exclusion criteria at each step. (PDF)
File S2 The 27 PRISMA checklist items corresponding to the prognosis signatures studies systematic review.
(PDF)
File S3 Signatures translation results. Translation results for each signature to the platforms of public datasets used in this work: Affymetryx, Hs-OperonV2-vB2.2, Human 19 K Oligo array, MWG 30 K Oligo set and Rosetta custom human 23 K array. Translation was performed via Gene Symbol when necessary, using the Universal Protein Resource annotation database, the online repository of HUGO Gene Nomenclature Committee and the chip annotation files from the Affymetrix official web site. Signature:signature name;Platform:platform used to derive the signature;Reported size:size of signature reported in the original paper (genes or features); Extracted size: size of signature after extraction from the original paper (genes or features);Gene Symbols: size of signature in terms of official Gene Symbol when translation was possible;Not found:number of signature features not found in the platform;% not found: percentage of signature features not found in the platform (respect to extracted size); Platform features: signature size in the Clinical Value of Signatures in Colorectal Cancer
platform after translation. Signatures are listed in decreasing order of% not found.
(XLS)
File S4 Signatures official Gene Symbols and overlapping.
Signatures Gene Symbol:signatures in terms of Gene Symbol. For each signature, official Gene Symbols to which some of their original feature was translated are listed. Translation was performed using the Universal Protein Resource annotation database, the online repository of HUGO Gene Nomenclature Committee and the chip annotation files from the Affymetrix official web site. Signatures overlap: official Gene Symbols shared by four, three and two of the signatures used in this work. List of no shared Gene Symbols (Genes in 1 signatures) is also shown. (XLS)
File S5 Random Forest classification results. Random Forest classification results for each signature and dataset are shown for all, stage II, stage III, Microsatellite Stable and Microsatellite instable samples analyses. MCC: Matthews Correlation Coeffi-cient (MCC) and 95% confidence interval;p-value: permutation p-value associated with MCC; Acc: accuracy rate; Sens: sensitivity; Spec: specificity; No events/events: number of samples with good and bad prognosis respectively. Last column shows the same values for the pooled analyses across datasets using sample size as weights.
(XLS)
File S6 Global performance of signatures for all, stage II and stage III samples using Random Forest classifier. For each signature, sample size used in the analysis (separately for good and bad prognosis between brackets), pooled Matthews
Correla-tion Coefficients (MCC) with 95% confidence intervals, accuracy rates, sensitivities and specificities are shown. For stage II and stage III analyses, also positive and negative likelihood ratios, negative and positive post-test probabilities, differences between post-test probabilities and 95% confidence interval are reported. Signatures are listed in decreasing order of MCC. Those with significant MCC at 5% level are highlighted in bold letters.
(XLS)
File S7 Support Vector Machine classification results. Sheets
All samples, Stage 2andStage 3:Support Vector Machine classification results for each signature and dataset are shown for all, stage II and, stage III analyses sheets respectively. MCC: Matthews Correlation Coefficient (MCC) and 95% confidence interval; p-value: permutation p-value associated with MCC; Acc: accuracy rate; Sens: sensitivity; Spec: specificity; No events/events: number of samples with good and bad prognosis respectively in that dataset.SheetsAll samples global,Stage 2 global and Stage 3 global: Global performance results of signatures for all, stage II and stage III samples using Support Vector Machine are extended. Signatures are listed in decreasing order of MCC. Those with significant MCC at 5% level are highlighted in bold letters.
(XLS)
Author Contributions
Conceived and designed the experiments: RSP AB CF VM. Analyzed the data: RSP AB DC SR X. Sole´ MCB EG X. Sanjuan SB GJ AS CF GC VM. Wrote the paper: RSP AB SR CF VM.
References
1. Ferlay J, Parkin DM, Steliarova-Foucher E (2010) Estimates of cancer incidence and mortality in Europe in 2008. Eur J Cancer 46(4): 765–81.
2. Saltz LB, Kelsen DP (1997) Adjuvant treatment of colorectal cancer. Annu Rev Med 48: 191–202.
3. Benson AB 3rd, Schrag D, Somerfield MR, Cohen AM, Figueredo AT, et al. (2004) American Society of Clinical Oncology recommendations on adjuvant chemotherapy for stage II colon cancer. J Clin Oncol 22(16): 3408–19. 4. Gill S, Loprinizi CL, Sargent DJ, Thome SD, Alberts SR, et al. (2004) Pooled
analysis of fluorouracil-based adjuvant therapy for stage II and III colon cancer: who benefits and by how much?. J Clin Oncol 22(10): 1797–806.
5. McMillan DC, McArdle CS, Morrison DS (2010) A clinical risk score to predict 3-, 5- and 10-year survival in patients undergoing surgery for Dukes B colorectal cancer. Br J Cancer. 103(7): 970–4.
6. Dotan E, Cohen SJ (2011) Challenges in the management of stage II colon cancer. Semin Oncol 38(4): 511–20.
7. Portera CA Jr, Berman RS, Ellis LM (1998) Molecular determinants of colon cancer metastasis. Surg Oncol 7(3–4): 183–95.
8. Jones S, Chen WD, Parmigiani G, Diehl F, Beerenwinkel N, et al. (2008) Comparative lesion sequencing provides insights into tumor evolution. Proc Natl Acad Sci U S A 105(11): 4283–8.
9. George B, Kopetz S (2011) Predictive and prognostic markers in colorectal cancer. Curr Oncol Rep 13(3): 206–15.
10. Cowin PA, Anglesio M, Etemadmoghadam D, Bowtell DD (2010) Profiling the cancer genome. Annu Rev Genomics Hum Genet 11: 133–59.
11. Kim C, Paik S (2010) Gene-expression-based prognostic assays for breast cancer. Nat Rev Clin Oncol 7(6): 340–7.
12. Slodkowska EA, Ross JS (2009) MammaPrint 70-gene signature: another milestone in personalized medical care for breast cancer patients. Expert Rev Mol Diagn 9(5): 417–22.
13. Moher D, Liberati A, Tetzlaff J, Altman DG; PRISMA Group (2009) Preferred reporting items for systematic reviews and meta-analyses: the PRISMA statement. PLoS Med 21;6(7): e1000097.
14. Andersen CL, Christensen LL, Thorsen K, Schepeler T, Sorensen FB, et al. (2009) Dysregulation of the transcription factors SOX4, CBFB and SMARCC1 correlates with outcome of colorectal cancer. Br J Cancer 100(3): 511–23. 15. Anjomshoaa A, Lin YH, Black MA, McCall JL, Humar B, et al. (2008) Reduced
expression of a gene proliferation signature is associated with enhanced malignancy in colon cancer. Br J Cancer 99(6): 966–73.
16. Arango D, Laiho P, Kokko A, Alhopuro P, Sammalkorpi H, et al. (2005) Gene-expression profiling predicts recurrence in Dukes’ C colorectal cancer. Gastroenterology 129(3): 874–84.
17. Bandres E, Malumbres R, Cubedo E, Honorato B, Zarate R, et al. (2007) A gene signature of 8 genes could identify the risk of recurrence and progression in Dukes’ B colon cancer patients. Oncol Rep 17(5): 1089–94.
18. Barrier A, Boelle PY, Roser F, Gregg J, Tse C, et al. (2006)Stage II colon cancer prognosis prediction by tumor gene expression profiling.J Clin Oncol 24(29): 4685–91. 19. Barrier A, Lemoine A, Boelle PY, Tse C, Brault D, et al. (2005) Colon cancer
prognosis prediction by gene expression profiling. Oncogene 24(40): 6155–64. 20. Bertucci F, Salas S, Eysteries S, Nasser V, Finetti P, et al. (2004) Gene expression
profiling of colon cancer by DNA microarrays and correlation with histoclinical parameters. Oncogene 23(7): 1377–91.
21. Eschrich S, Yang I, Bloom G, Kwong KY, Boulware D, et al. (2005) Molecular staging for survival prediction of colorectal cancer patients. J Clin Oncol 23(15): 3526–35.
22. Hao JM, Chen JZ, Sui HM, Si-Ma XQ, Li GQ, et al. (2010) Five-gene signature as a potential predictor of metastasis and survival in colorectal cancer. J Pathol 220(4): 475–89.
23. Jiang Y, Casey G, Lavery IC, Zhang Y, Talantov D, et al. (2008) Development of a clinically feasible molecular assay to predict recurrence of stage II colon cancer. J Mol Diagn 10(4): 346–54.
24. Jorissen RN, Gibbs P, Christie M, Prakash S, Lipton L, et al. (2009) Metastasis-Associated Gene Expression Changes Predict Poor Outcomes in Patients with Dukes Stage B and C Colorectal Cancer. Clin Cancer Res 15(24): 7642–7651. 25. Kalady MF, Dejulius K, Church JM, Lavery IC, Fazio VW (2010) Gene signature is associated with early stage rectal cancer recurrence. J Am Coll Surg 211(2): 187–95.
26. Kennedy RD, Bylesjo M, Kerr P, Davison T, Black JM, et al. (2011) Development and Independent Validation of a Prognostic Assay for Stage II Colon Cancer Using Formalin-Fixed Paraffin-Embedded Tissue. J Clin Oncol 29(35): 4620–6.
27. Liersch T, Grade M, Gaedcke J, Varma S, Difilippantonio MJ, et al. (2009) Preoperative chemoradiotherapy in locally advanced rectal cancer: correlation of a gene expression-based response signature with recurrence. Cancer Genet Cytogenet. 190(2): 57–65.
28. Lin YH, Friederichs J, Black MA, Mages J, Rosenberg R, et al. (2007) Multiple gene expression classifiers from different array platforms predict poor prognosis of colorectal cancer. Clin Cancer Res 13(2 Pt 1): 498–507.
29. Mettu RK, Wan YW, Habermann JK, Ried T, Guo NL (2010) A 12-gene genomic instability signature predicts clinical outcomes in multiple cancer types. Int J Biol Markers 25(4): 219–28.
30. O’Connell MJ, Lavery I, Yothers G, Paik S, Clark-Langone KM, et al. (2010) Relationship between tumor gene expression and recurrence in four
indepen-Clinical Value of Signatures in Colorectal Cancer
dent studies of patients with stage II/III colon cancer treated with surgery alone or surgery plus adjuvant fluorouracil plus leucovorin. J Clin Oncol 28(25): 3937– 44.
31. Peng J, Wang Z, Chen W, Ding Y, Wang H, et al. (2010) Integration of genetic signature and TNM staging system for predicting the relapse of locally advanced colorectal cancer. Int J Colorectal Dis 25(11): 1277–85.
32. Pillaire MJ, Selves J, Gordien K, Gourraud PA, Gentil C, et al. (2010) A ‘DNA replication’ signature of progression and negative outcome in colorectal cancer. Oncogene 29(6): 876–87.
33. Salazar R, Roepman P, Capella G, Moreno V, Simon I, et al. (2011) Gene expression signature to improve prognosis prediction of stage II and III colorectal cancer. J Clin Oncol 29(1): 17–24.
34. Schetter AJ, Nguyen GH, Bowman ED, Mathe EA, Yuen ST, et al. (2009) Association of inflammation-related and microRNA gene expression with cancer-specific mortality of colon adenocarcinoma. Clin Cancer Res15(18): 5878–87.
35. Smith JJ, Deane NG, Wu F, Merchant NB, Zhang B, et al. (2010) Experimentally derived metastasis gene expression profile predicts recurrence and death in patients with colon cancer. Gastroenterology 138(3): 958–68. 36. Staub E, Groene J, Heinze M, Mennerich D, Roepcke S, et al. (2009) An
expression module of WIPF1-coexpressed genes identifies patients with favorable prognosis in three tumor types. J Mol Med (Berl) 87(6): 633–44.
37. Van Laar RK (2010) An online gene expression assay for determining adjuvant therapy eligibility in patients with stage 2 or 3 colon cancer. Br J Cancer 103(12): 1852–7.
38. Wan YW, Quian Y, Rathanagiriswaran S, Castranova V, Guo NL (2010) A breast cancer prognostic signature predicts clinical outcomes in multiple tumor types. Oncol Rep 24(2): 489–94.
39. Wang Y, Jatkoe T, Zhang Y, Mutch MG, Talantov D, et al. (2004) Gene expression profiles and molecular markers to predict recurrence of Dukes’ B colon cancer. J Clin Oncol 22(9): 1564–71.
40. Watanabe T, Kobunai T, Sakamoto E, Yamamoto Y, Konishi T, et al. (2009) Gene expression signature for recurrence in stage III colorectal cancers. Cancer 115(2): 283–92.
41. Watanabe T, Kobunai T, Yamamoto Y, Kanazawa T, Konishi T, et al. (2010) Prediction of liver metastasis after colorectal cancer using reverse transcription-polymerase chain reaction analysis of 10 genes. Eur J Cancer. 46(11): 2119–26. 42. Yamasaki M, Takemasa I, Komori T, Watanabe S, Sekimoto M, et al. (2007) The gene expression profile represents the molecular nature of liver metastasis in colorectal cancer. Int J Oncol 30(1): 129–38.
43. Gray RG, Quirke P, Handley K, Lopatin M, Magill L, et al. (2011) Validation study of a quantitative multigene reverse transcriptase-polymerase chain reaction assay for assessment of recurrence risk in patients with stage II colon cancer. J Clin Oncol 10;29(35): 4611–9.
44. Barrett T, Edgar R (2006) Gene expression omnibus: microarray data storage, submission, retrieval, and analysis. Methods Enzymol 411: 352–69. 45. Parkinson H, Sarkans U, Shojatalab M, Abeygunawardena N, Contrino S, et al.
(2005) ArrayExpress–a public repository for microarray gene expression data at the EBI. Nucleic Acids Res 33(Database issue): D553–5.
46. UniProt Consortium (2011) Ongoing and future developments at the Universal Protein Resource. Nucleic Acids Res 39(Database issue): D214–9.
47. Povey S, Lovering R, Bruford E, Wright M, Lush M et al. (2001) The HUGO Gene Nomenclature Committee (HGNC). Hum Genet 109(6): 678–80. 48. Liu G, Loraine AE, Shigeta R, Cline M, Cheng J, et al. (2003) NetAffx:
Affymetrix probesets and annotations. Nucleic Acids Res 31(1): 82–6. 49. Breiman L (2001) Random Forest. Machine Learning 45(1): 5–32.
50. Breiman L (2002) Manual On Setting Up, Using, And Understanding Random Forests V3.1. Available: http://oz.berkeley.edu/users/breiman/Using_ random_forests_V3.1.pdf.
51. Mitchell MW (2011) Bias of the Random Forest Out-of-Bag (OOB) Error for Certain Input Parameters. Open Journal of Statistics doi:10.4236/ ojs.2011.13024.
52. Liaw A, Wiene M (2002) Classification and regression by randomForest. R News 2(3): 18–22.
53. Hastie T, Tibshirani R, Friedman J (2008) The Elements of Statistical Learning (2nd edition). Springer-Verlag.
54. Vapnik V (1998) Statistical Learning Theory. Wiley, New York.
55. Liu XY, Wu J, Zhou ZH (2009) Exploratory undersampling for class-imbalance learning. IEEE Trans Syst Man Cybern B Cybern 39(2): 539–50.
56. Hastie T (2009) svmpath: the SVM Path algorithm. R package version 0.93. Available: http://CRAN.R-project.org/package = svmpath.
57. Baldi P, Brunak S, Chauvin Y, Andersen CA, Nielsen H (2000) Assessing the accuracy of prediction algorithms for classification: an overview. Bioinformatics 16(5): 412–24.
58. Shi L, Campbell G, Jones WD, Campagne F, Wen Z, et al. (2010) The MicroArray Quality Control (MAQC)-II study of common practices for the
development and validation of microarray-based predictive models. Nat Biotechnol 28(8): 827–38.
59. Zhou XH, Obuchowsky NA, McClish D (2002) Statistical Mehods in diagnostic Medicine. Wiley.
60. Braga-Neto UM, Dougherty ER (2004) Is cross-validation valid for small-sample microarray classification? Bioinformatics 12;20(3): 374–80.
61. Strasser H, Weber C (1999) On the asymptotic theory of permutation statistics. Mathematical Methods of Statistics 8, 220–250.
62. Hothorn T, Hornik K, van de Wiel MA, Zeileis A (2008) Implementing a class of permutation test: the coin package. Journal of Statistical Software 28(8),1–23. 63. Efron B, Tibshirani R (1993) An Introduction to the Bootstrap. Chapman &
Hall.
64. Canty A, Ripley B (2011) boot: Bootstrap R (S-Plus) Functions. R package version 1.3–2.
65. Lusa L, McShane LM, Radmacher MD, Shih JH, Wright GW, et al. (2007) Appropriateness of some resampling-based inference procedures for assessing performance of prognostic classifiers derived from microarray data. Stat Med 28;26(5): 1102–13.
66. Gray R, Barnwell J, McConkey C, Hills RK, Williams NS, et al. (2007) Adjuvant chemotherapy versus observation in patients with colorectal cancer: a randomised study. Lancet 370(9604): 2020–9.
67. Lu AT, Salpeter SR, Reeve AE, Escrich S, Johnston PG, et al. (2009) Gene expression profiles as predictors of poor outcomes in stage II colorectal cancer: A systematic review and meta-analysis. Clin Colorectal Cancer 8(4): 207–14. 68. Simon R (2005) Roadmap for developing and validating therapeutically relevant
genomic classifiers. J Clin Oncol 10;23(29): 7332–41.
69. Dupuy A, Simon RM (2007) Critical review of published microarray studies for cancer outcome and guidelines on statistical analysis and reporting. J Natl Cancer Inst 17;99(2): 147–57.
70. Raspe E, Decraene C, Berx G (2012) Gene expression profiling to dissect the complexity of cancer biology: Pitfalls and promise. Semin Cancer Biol. Mar 7. 71. Ioannidis JP, Allison DB, Ball CA, Coulibaly I, Cui X, et al. (2009) Repeatability of published microarray gene expression analyses. Nat Genet. 2009 41(2): 149– 55.
72. Sargent DJ, Wieand HS, Haller DG, Gray R, Benedetti JK, et al. (2005) Disease-free survival versus overall survival as a primary end point for adjuvant colon cancer studies: individual patient data from 20,898 patients on 18 randomized trials. J Clin Oncol 1;23(34): 8664–70.
73. Sargent DJ, Patiyil S, Yothers G, Haller DG, Gray R, et al. (2007) End points for colon cancer adjuvant trials: observations and recommendations based on individual patient data from 20,898 patients enrolled onto 18 randomized trials from the ACCENT Group. J Clin Oncol 10;25(29): 4569–74.
74. Hanahan D, Weinberg RA (2000) The hallmarks of cancer. Cell 7;100(1): 57– 70.
75. Barry WT, Kernagis DN, Dressman HK, Griffis RJ, Hunter JD, et al. (2010) Intratumor heterogeneity and precision of microarray-based predictors of breast cancer biology and clinical outcome. J Clin Oncol 1;28(13): 2198–206. 76. Esposito G (2007) Complementary techniques: laser capture microdissection–
increasing specificity of gene expression profiling of cancer specimens. Adv Exp Med Biol 593: 54–65.
77. Cardoso J, Boer J, Morreau H, Fodde R (2007) Expression and genomic profiling of colorectal cancer. Biochim Biophys Acta 1775(1): 103–37. 78. Abba MC, Lacunza E, Butti M, Aldaz CM (2010) Breast cancer biomarker
discovery in the functional genomic age: a systematic review of 42 gene expression signatures. Biomark Insights 27;5: 103–18.
79. Lascorz J, Chen B, Hemminki K, Forsti A (2011) Consensus pathways implicated in prognosis of colorectal cancer identified through systematic enrichment analysis of gene expression profiling studies. PLoS One 6(4): e18867. 80. Sole X, Bonifaci N, Lopez-Bigas N, Berenguer A, Hernandez P, et al. (2009)
Biological convergence of cancer signatures. PLoS One 4(2): p. e4544. 81. Sanz-Pamplona R, Cordero D, Berenguer A, Lejbkowicz F, Rennert H, et al.
(2011) Gene expression differences between colon and rectum tumors. Clin Cancer Res 1;17(23): 7303–12.
82. Syk E, Glimelius B, Nilsson PJ (2010) Factors influencing local failure in rectal cancer: analysis of 2315 patients from a population-based series. Dis Colon Rectum 53(5): 744–52.
83. Diaz-Uriarte R, Alvarez de Andres S (2006) Gene selection and classification of microarray data using random forest. BMC Bioinformatics 7: 3.
84. Dudoit S, Fridlyand J, Speed TP (2002) Comparison of discrimination methods for classification of tumors using gene expression data. J Am Stat Assoc 97: 77– 87.
85. Webber EM, Lin JS, Evelyn P Whitlock (2010) Oncotype DX tumor gene expression profiling in stage II colon cancer. Application: prognostic, risk prediction. PLoS Curr 2;2.
Clinical Value of Signatures in Colorectal Cancer