Submitted30 December 2015 Accepted 23 February 2016 Published14 March 2016
Corresponding author Mingguang Shi,
mingguang.shi@hfut.edu.cn
Academic editor Yong Wang
Additional Information and Declarations can be found on page 11
DOI10.7717/peerj.1804
Copyright 2016 Shi and He
Distributed under
Creative Commons CC-BY 4.0
OPEN ACCESS
ColoFinder: a prognostic 9-gene signature
improves prognosis for 871 stage II and
III colorectal cancer patients
Mingguang Shi1and Jianmin He2
1School of Electric Engineering and Automation, Hefei University of Technology, Hefei, Anhui, China 2School of Management, Hefei University of Technology, Hefei, Anhui, China
ABSTRACT
Colorectal cancer (CRC) is a heterogeneous disease with a high mortality rate and is still lacking an effective treatment. Our goal is to develop a robust prognosis model for predicting the prognosis in CRC patients. In this study, 871 stage II and III CRC samples were collected from six gene expression profilings. ColoFinder was developed using a 9-gene signature based Random Survival Forest (RSF) prognosis model. The 9-gene signature recurrence score was derived with a 5-fold cross validation to test the association with relapse-free survival, and the value of AUC was gained with 0.87 in GSE39582(95% CI [0.83–0.91]). The low-risk group had a significantly better relapse-free survival (HR, 14.8; 95% CI [8.17–26.8]; P<0.001) than the high-risk group. We also found that the 9-gene signature recurrence score contributed more information about recurrence than standard clinical and pathological variables in
univariate and multivariate Cox analyses when applied to GSE17536(p=0.03 and
p=0.01 respectively). Furthermore, ColoFinder improved the predictive ability and
better stratified the risk subgroups when applied to CRC gene expression datasets
GSE14333,GSE17537,GSE12945andGSE24551. In summary, ColoFinder significantly improves the risk assessment in stage II and III CRC patients. The 9-gene prognostic classifier informs patient prognosis and treatment response.
SubjectsBioinformatics, Computational Biology, Genetics, Genomics, Oncology Keywords Colorectal cancer, The 9-gene signature, Random survival forest
INTRODUCTION
and III CRC patients in order that high-risk patients could be treated with adjuvant CTX, but low-risk patients avoid unnecessary adjuvant CTX.
Several protein and genomic biomarkers have been used as prognostic and predictive markers to refine the prognostic information of CRC. Microarray-based gene expression
profiling has showed great potential in identifying sub-network biomarkers (Shi,
Beauchamp & Zhang, 2012; Shi et al., 2014), molecularly distinct subtypes (Oh et al., 2012), transcriptional subtypes (Zhu et al., 2013), 34-gene expression signature (Smith et al., 2010), 18-gene expression signature (Salazar et al., 2011), 13-gene expression signature (A˚gesen et al., 2012), 7-gene expression signature (Sveen et al., 2012) and 4-gene expression signature (Zou et al., 2015) for survival analysis in CRC patients. In-depth proteomics to stool samples from CRC patients and healthy controls was applied to
identify tumor-specific protein based biomarkers for the early detection of CRC (Bosch et
al., 2012). Plasma MicroRNAs are very potential as novel noninvasive biomarkers for early
detection of CRC (Huang et al., 2010). Of all these markers, KRAS was the first biomarker
integrated into clinical practice for CRC (Van Schaeybroeck et al., 2011). The prognostic/ predictive markers such as BRAF, PIK3CA, PTEN, CEA and CA199 were potential for the implementation of these biomarkers into routine clinical trials.
Many previous analysis for CRC gene expression signatures were often limited to small
sample sizes and the lack of independent sample test (Lu et al., 2009). To overcome the
shortcomings, larger sample studies were applied to verify the predictive value of prognostic gene expression signatures. Nevertheless, the main limitations of the proposed assays were insufficient prognostic messages for signatures, which possibly resulted in large quantities of signatures and the weak robustness. Overall, the clinical application of these tests were restrained from inadequate independent validation (Sveen et al., 2013).
In this study, we selected 9-gene expression signatures as prognostic and predictive DNA markers to develop the prognosis model. Our hypothesis was that the functionally important mutated genes with CRC recurrence improved the cancer prognosis and clinical outcome. We used a 9-gene signature-based Random Survival Forest (RSF) prognosis model to develop ColoFinder. The prognosis model was then externally validated in five independent gene expression datasets to prove its effectiveness. The results demonstrated that ColoFinder improved the predicted performance of prognosis and provided the concise testing result for general application in clinical trials.
MATERIALS AND METHODS
Study patients
We derived the expression profiles from 871 colorectal cancer patients with stage II and stage III samples to test associations between the 9-gene signature and clinical outcomes. Raw microarray data were obtained from six publicly available CRC gene expression datasets with available clinical information including NCBI Gene Expression
Omnibus (GEO)GSE39582(Marisa et al., 2013) (461 samples with relapse-free survival);
GSE17536(Freeman et al., 2012;Smith et al., 2010) (111 samples with relapse-free survival);
Table 1 The microarray gene expression datasets used in the study (N=871).
All trails (N=871)
GSE39582
(N=461)
GSE17536
(N=111)
GSE14333
(N=67)
GSE17537
(N=34)
GSE12945
(N=38)
GSE24551
(N=160) Stage
II 479 260 55 37 15 22 90
III 392 201 56 30 19 16 70
Recurrence
No 620 322 80 54 31 35 98
Yes 251 139 31 13 3 3 62
Age (years)
Range 22–94 22–97 26–92 30–92 47–94 NA NA
Median NA 69 67 70 63 NA NA
Gender
Male 371 258 53 41 19 NA NA
Female 302 203 58 26 15 NA NA
Adjuvant CTX
0 302 258 (203 II+55 III) NA 44(33 II+11 III) NA NA NA
1 225 202(56 II+146 III) NA 23(4 II+19 III) NA NA NA
#genes NA 19825 19468 19468 19468 12694 16733
(Freeman et al., 2012;Smith et al., 2010) (34 samples with relapse-free survival);GSE12945
(Staub et al., 2009) (38 samples with relapse-free survival) andGSE24551(Sveen et al.,
2011) (160 samples with relapse-free survival). We used the largest CRC gene expression
datasetGSE39582(n=461) as training dataset and the other five gene expression datasets as
validation dataset. Specifically, we combinedGSE17537withGSE12945as an independent
validation dataset for study. The sampling distributions with clinical and demographic
information of CRC samples were listed inTable 1.
The Robust MultiChip Analysis (RMA) algorithm (Irizarry et al., 2003) was employed
with quantile normalization and log2-transformation for normalizing and summarizing probe-level intensity. The probe set identifiers (IDs) were mapped to gene symbols based on the mapping file from GEO database and the gene with the largest interquartile range (IQR) was used for study when multiple probe sets were mapped to the same gene. For making
comparable gene expression level, thez-score transformation was used to standardize the
expression values of each gene.
The prognostic gene expression signatures
Specifically, the 9-gene signature was composed of prognostic and predictive DNA markers in CRC (Markowitz & Bertagnolli, 2009). APC degradedβ-catenin and inhibited its nuclear localization which activated the Wnt signaling pathway. The germ-line defects in mismatch-repair genes such as MLH1, MSH2, and MSH6 were responsible for the colorectal cancer. The mutation of TP53 inactivated the p53 pathway which is the key genetic step in colorectal cancer. Somatic mutations inactivated TGFBR2 for colorectal cancer, and the mutational inactivation of TGF-β signaling was the key step for the progression of colorectal cancer. SMAD4, along with proteins SMAD2 and SMAD3, were critical for transforming growth
factorβpathway signaling. KRAS activated the mitogen-activated protein kinase (MAPK)
signaling pathway for colorectal cancers. PTEN acted as a tumor suppressor gene through the action of its phosphatase protein product and promoted the activation of PI3K pathway signaling, which leaded to cell-survival signaling and apoptosis suppression.
Random survival forest (RSF) prognosis model
The R-package randomSurvivalForest was used to develop the random survival forest
(RSF) prognosis model (Ishwaran et al., 2008). The 9-gene signature was applied for
training set to develop the prognosis model. The model had two parametersntreeandmtry,
wherentreewas the number of trees in the forest andmtry was the number of variables
randomly selected for splitting at each node. For the tuned parameters, we letntree vary
among the candidate set{10,20,30,40,50,60,70,80,90,100}andmtry vary among the candidate set{1,3,5,7,9}to form different parameter combinations. Each combination of parameter choices was assessed using 5-fold cross-validation, and the parameters with best cross-validation AUC (the Area under the Receiver Operating Characteristic Curve) were discovered. The final RSF model was then trained on the whole training set using the optimal parameters, and tested on the independent validation dataset for the evaluation of AUC.
The validation of independent gene expression data sets
The ColoFinder was then tested in the independent cohorts GSE17536,GSE14333,
GSE17537,GSE12945andGSE24551. The ensemble mortality for individual samples, which we called 9-gene signature recurrence scores, were calculated with test cohorts. A higher score indicated higher risk with shorter survival time. In the test dataset, the median score was used to stratify patients into high-risk and low-risk score groups in all cohorts.
Statistical analysis
We developed ColoFinder to derive AUC and standard Kaplan–Meier survival curves from training dataset (Fig. 2). The prognostic 9-gene signature was validated in the test dataset for deriving the recurrence scores of each sample, and the performance was then assessed with AUC and hazard ratios (HRs). We compared the 9-gene signature with the published gene expression signatures and the results demonstrated that the 9-gene
signature consistently outperformed the available gene expression signatures (Figs. 3and
4). Cox regression analysis was performed to assess the prognostic value of the 9-gene
Table 2 Univariate and multivariate Cox proportional hazard regression analyses of relapse-free sur-vival inGSE17536.
Univariate Multivariate
pvalue HR(95% CI) pvalue HR(95% CI)
Age 0.25 0.98 (0.96–1.01) 0.14 0.98 (0.95–1.01)
Gender (M or F) 0.72 0.88 (0.43–1.78) 0.88 1.06 (0.49–2.30)
AJCC STAGE (II, III) 0.07 1.96 (0.94–4.09) 0.08 1.97 (0.93–4.16)
ColoFinder 0.03 0.44 (0.21–0.93) 0.01 0.34 (0.15–0.77)
Notes.
AJCC, American Joint Committee on Cancer; F, female; M, male.
built and HR was calculated with R survival package. All statistical tests were two-sided andpvalue less than 0.05 was considered statistically significant.
RESULTS
Overview of the ColoFinder development and evaluation workflow
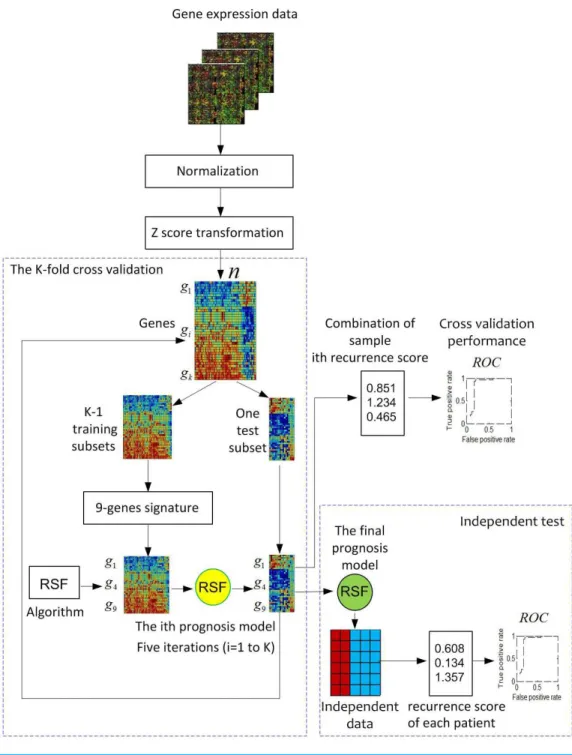
Figure 1illustrates the overview of the ColoFinder development and evaluation workflow.
Microarray gene expression data of CRC are collected, normalized, and z-score
transformed. A K-fold cross-validation is used for RSF model development with the samples randomly partitioned into K subsets. A single subset is retained as a temporary test subset and the remaining K-1 subsets are used as a temporary training set. Data on the 9-gene signature for samples in the training set is used to parameterize the RSF model algorithm. The parameterized model is then used to predict samples in the test subset. The cross-validation process is then repeated K times, with each of the K subsets used exactly once as the test subset. The K results from the subsets then can be combined to produce a single estimation. Fully developed RSF model based on the optimal parameters identified by in the cross-validation process is then validated by an independent dataset. The performance was evaluated based on AUC.
Performance of ColoFinder for training dataset
The AUC and Kaplan–Meier survival curves were derived from ColoFinder. In this study,
the best performed parameters were used to develop the RSF prognosis model wherentree
=50 andmtry =3 respectively 9-gene signature recurrence score based prognosis model
was calculated for individual samples of the training data setGSE39582.Figure 2Adepicted the average AUC of RSF model from the 5-fold cross-validation studies. The receiver operating characteristic analysis showed good sensitivity and specificity with average AUC of 0.87 (95% CI [0.83–0.91]). Based on the recurrence score, the patients were divided into two groups, including a low-risk group with below-median scores and a high-risk
group with above-median scores. As shown inFig. 2B, the low-risk group had significantly
Figure 2 Performance of ColoFinder with 5-fold cross-validation for training data set.(A) Receiver operating characteristic analysis showed significant ability to discriminate between high-risk and low-risk groups in the CRCGSE39582cohort. The average AUC is 0.87 (95% CI [0.83–0.91]) with 5-fold cross val-idation. (B) Kaplan–Meier survival curves for patient subgroups identified inGSE39582. It showed a sig-nificant difference in distant relapse-free survival for high-risk and low-risk groups of CRC patients.
Figure 3 Comparison of ColoFinder and N-genes based RSF model applied on the CRC patients.Receiver operating characteristic analysis of the predictions for three independent test cohorts. (A)GSE14333. (B) B,GSE17537+GSE12945. (C)GSE24551. (A) 9-genes signature, (B) 18-genes, (C) 34-genes, (D) 13-genes, (E) 6-genes.
ColoFinder significantly improved association with relapse-free survival
The univariate and multivariate Cox proportional hazards regression analyses were applied
to independent test cohort GSE17536for evaluating the prognostic value of 9-gene
Figure 4 Comparison of ColoFinder and N-genes based RSF model applied on the CRC patients.Hazard ratios of the predictions for three inde-pendent test cohorts with 95% confidence intervals. (A)GSE14333. (B) B:GSE17537+GSE12945. (C)GSE24551. A: 9-genes signature, B: 18-genes, C: 34-genes, D: 13-genes, E: 6-genes.
that in theGSE17536test cohort the 9-gene signature recurrence score was significantly
associated with relapse-free survival (p=0.01) (Table 2). In univariate Cox analyses, the 9-gene signature recurrence score still maintained the significance associated with relapse-free survival (p=0.03) (Table 2). Thus, the 9-gene signature recurrence score was more statistically significantly associated with relapse-free survival than standard clinical and pathologic covariates.
ColoFinder better stratified three independent series of CRC patients ColoFinder was tested on the independent validation dataset, and then evaluated with the AUC and hazard ratios. The 9-gene signature recurrence score was derived for each
patient in the three independent validation cohorts respectively.Figure 3 illustrated the
performance of AUC on independent validation dataset. As shown inFig. 4, the estimated
hazard ratio (HR) with 95% confidence intervals was calculated for the validation data sets. The value of HR was used to evaluate the clinically significant difference between high-risk and low-risk groups. The bigger the value of HR is, the better the statistical significance is.
The 9-gene signature was validated on the test cohortGSE14333, resulting in an ROC
curve with AUC of 0.58 (Fig. 3A). A total of 25 of 33 patients did not develop distant relapse in the predicted high-risk group, while 5 of 34 patients developed distant relapse in the predicted low-risk group. The 9-gene signature recurrence score ranged from 38.8 to 413
among all patients in the test cohortGSE14333, and the 9-gene signature was associated
with distant relapse-free survival (HR, 1.24 95% CI [0.42–3.69]) (Fig. 4A). Patients in the low-risk group had a median relapse-free survival time of 41 months compared with 35 months in the high-risk group.
Investigation of the 9-gene signature recurrence score in patients from two additional cohorts confirmed its association with distant relapse-free survival. Firstly, for the
was also associated with relapse-free survival in patients (HR, 2.75 95% CI [0.287–26.5]) (Fig. 4B). A total of 33 of 36 patients did not develop distant relapse in the predicted high-risk group, while one of 36 patients developed distant relapse in the predicted low-high-risk group. The median relapse-free survival time was 46 months in the cases with low-risk group compared with only 44 months in the cases with high-risk group. Furthermore, the 9-gene signature was validated on the test cohorts, resulted in an ROC curve with AUC of 0.64 (Fig. 3B). Secondly, starting from independent test cohort data setGSE24551, the 9-gene signature recurrence score was consistently associated with relapse-free survival in patients (HR, 1.25 95% CI [0.758–2.06]) (Fig. 4C). Specifically, the 9-gene signature was
validated on the test cohortGSE24551, which led to the ROC curve with AUC of 0.56 (Fig.
3C). In summary, ColoFinder improved the predictive ability for independent test cohorts
and better stratified the risk subgroups of CRC.
The 9-gene signature compared with the published gene expression signatures
To further evaluate the significance of the 9-gene signature, the prognostic potential from the 9 gene signatures was compared with that from existing prognostic gene signatures (Ågesen et al., 2012;Salazar et al., 2011;Smith et al., 2010;Zou et al., 2015). The N-genes (18-genesSalazar et al., 2011, 34-genesSmith et al., 2010, 13-genesÅgesen et al., 2012and
6-genes (CRP, IL10, IL2, IL8, LPA, TNF) Zou et al., 2015) signature based RSF model
were trained respectively on the gene expression datasetGSE39582and then tested on the
independent test datasets.Figure 3depicted the AUC when the N-genes signature score
was derived for each patient in the three independent test cohorts. ForGSE14333, the
9-gene signature achieved 1.8%, 20.8%, 17.9% and 5.5% increase respectively in AUC as
compared to 18-genes, 34-genes, 13-genes and 6-genes signatures respectively (Fig. 3A).
ForGSE17537andGSE12945, 25.5%, 3.2% and 30.6% increase in AUC were achieved
with the 9-gene signature in comparison with 18-genes, 34-genes and 13-genes (Fig. 3B).
ForGSE24551, the 9-gene signature achieved 3.7%, 19.1% and 12% increase respectively
in AUC as compared to 18-genes, 34-genes and 6-genes signatures respectively (Fig. 3C).
Specifically, the 13-genes signature achieved 8.9% increase in comparison with the 9-gene signature (Fig. 3C).
The 9-gene signature achieved an HR of 2.75 95% CI [0.287–26.5] in theGSE17537and
GSE12945datasets, which was 841%, 1.4%, 162% and 3% higher than that from 18-genes, 34-genes, 13-genes and 6-genes signatures respectively (Fig. 4B). A increase of 0.8%, 20.2%
and 23.7% in theGSE24551dataset was achieved with the 9-gene signature in comparison
with 18-genes, 34-genes and 6-genes (Fig. 4C). Specifically, the 13-genes signature achieved
25.6% increase in comparison with 9-gene signature (Fig. 4C). Interestingly, The 13-genes
signature achieved an HR of 1.94 95% CI [0.628–6] in theGSE14333dataset, which was
56.5%, 27.6%, 134.5% and 7.7% higher than that from 9-gene, 18-genes, 34-genes and 6-genes signatures, respectively (Fig. 4A).
The Cox proportional hazards regression analyses were applied to GSE17536for
found the predicted outcome with N-genes signature score in the test cohort (18-genes,
p=0.34; 34-genes, p=0.06; and 13-genes,p=0.07). In univariate Cox analyses, the N-genes signature score was used to predict the association with relapse-free survival respectively (18-genes,p=0.46; 34-genes,p=0.09; and 13-genes,p=0.04). Thus, the 9-gene signature consistently outperformed the available gene expression signatures.
DISCUSSION
A major conclusion from this study was that ColoFinder was able to predict the prognosis for stage II and III CRC patients. ColoFinder provided the accurate prognostic model for predicting the performance of external validation cohorts from different countries, races and microarray platforms. The results demonstrated that our model provided useful predictive information regarding the prognosis for CRC patient subgroups. Our analysis used the large gene expression datasets with 871 CRC samples. The validated 9-gene signature provided extra value compared with standard clinical and pathologic covariates. To test the generality of the 9-gene signature, we applied the Recursive Partitioning and Regression Trees (RPART) model to test the association with CRC prognosis. Performance results are available in theSupplemental Information 1.
A data-driven strategy has been popularly made for gene signature search strategy in analyzing gene expression dataset. To prioritize the gene signature of gene expression data, several search strategies have been provided with unsupervised hierarchical clustering analysis (Oh et al., 2012), the nearest mean classifier (Salazar et al., 2011) and Cox
proportional hazards survival modeling based on lasso estimation (Ågesen et al., 2012).
In this study, we selected the gene signature which was critical for promoting CRC recurrence to construct the prognosis model. We aimed to analyze the genomic alterations with impact on prognosis and survival in CRC. The implementation process of genes relevant for CRC was knowledge driven, consisting of mismatch repair proteins, proteins of the EGFR-KRAS-PTEN cascade, APC and b-catenin of the WNT pathway. The results demonstrated that ColoFinder had the potential to predict the prognosis of CRC patients.
Random Forest (RF) was a non-parametric ensemble tree learning method which had been generally used for gene expression data analysis (Breiman, 2001;Díaz-Uriarte & De Andres, 2006;Statnikov, Wang & Aliferis, 2008). Random Survival Forest (RSF), the extension of RF method, was ensemble tree method for analyzing the right-censored
survival data (Ishwaran et al., 2008). The advantage of this method was to model
non-linear effects and multiple interactions among complex features. Although RSF
had been successfully utilized for cancer pathway hunting and genomic analysis (Chen
& Ishwaran, 2013;Ishwaran et al., 2011;Ishwaran et al., 2014), the overfitting of this high-dimensional survival analysis model reduced the significance of the genomic predictor when applied to an independent dataset (Ågesen et al., 2012). In this study, we developed the RSF prognosis model with small set of gene signatures to effectively restrain this overfitting of survival model.
Several tests have now been clinically provided for CRC survival analysis, such as
(Ågesen et al., 2012) and ColoGuidePro (Sveen et al., 2012). The proposed prognostic gene signatures with small set predicted CRC recurrence and provided useful insights into patient response from adjuvant CTX. All these tests have demonstrated that the gene signatures have prognostic value in independent patient series across different microarray platforms. Furthermore, the test Oncotype DX has been clinically validated as a prognostic signature for stage II CRC patients in a subsequent large clinical study (NSABP C-07) (Yothers et al., 2013). In addition, the microsatellite instability (MSI) status of the tumor has been used for stage II CRC treatment. The patients with high level of MSI have a favorable prognosis and improved treatment effect (Boland et al., 1998;Gryfe et al., 2000). The mutations activating the RAS/RAF signaling pathway were also predictive and prognostic indicators in CRC patients (Benvenuti et al., 2007).
The univariate analysis was performed using the Cox proportional hazards regression
model in independent test cohortGSE17536to evaluate the single effects of each marker.
The single variable associated with relapse-free survival was APC (p=0.27), MLH1
(p=0.07), MSH2 (p=0.91), MSH6 (p=0.62), TP53 (p=0.46), TGFBR2 (p=0.44),
SMAD4 (p=0.27), KRAS (p=0.07) and PTEN (p=0.35) respectively. As shown in
Table 2, the 9-gene signature recurrence score maintained the significance associated with relapse-free survival in univariate Cox analyses (p=0.03).
This study has several limitations. The RSF prognosis model has some drawbacks when determining the variable importance. For data including categorical variables with different number of levels, RSF is biased in favor of those attributes with more levels. Although ColoFinder achieved better performance than N-genes based RSF model when applied to independent datasets, the AUC is slightly poor and smaller than 0.65. We also noticed that the AUC of the 9-gene signature in the training set was 0.87, but the values of AUC dropped to smaller than 0.65 in the validation sets. Similarly, the hazard ration (HR) dropped from 14.8 in the training set to smaller than 3.0 in the validation sets. A possible explanation is the different class proportions between the training and the validation datasets, given the small sample size in both datasets. For example, the proportion between
recurrence and non-recurrence is 1:2.3 inGSE39582, 1:4.2 inGSE14333, 1:11 inGSE17537
andGSE12945and 1:1.6 inGSE24551, respectively. Although the class proportion can be well maintained in a cross-validation, it is not controlled for independent validation sets.
In conclusion, we developed ColoFinder to predict the prognosis of cancer patients and the prognosis model improved the prognosis for stage II and III CRC patients. Strong risk stratification was realized in five independent series of cancer patients from different microarray platforms. The results demonstrated that the 9-gene signature could improve the risk assessment and aid in clinical practice for CRC patients.
ADDITIONAL INFORMATION AND DECLARATIONS
Funding
The funders had no role in study design, data collection and analysis, decision to publish, or preparation of the manuscript.
Grant Disclosures
The following grant information was disclosed by the authors: National Natural Science Foundation of China: 61371153, 61572166. Anhui Provincial Natural Science Foundation: 1408085MF115.
Competing Interests
The authors declare there are no competing interests.
Author Contributions
• Mingguang Shi conceived and designed the experiments, performed the experiments,
analyzed the data, contributed reagents/materials/analysis tools, wrote the paper, prepared figures and/or tables, reviewed drafts of the paper.
• Jianmin He analyzed the data.
Data Availability
The following information was supplied regarding data availability:
Raw data are publicly available in the Gene Expression Omnibus(GEO) datasets
(accession number GSE39582, GSE17536, GSE14333, GSE17537, GSE12945 and
GSE24551).
Supplemental Information
Supplemental information for this article can be found online athttp://dx.doi.org/10.7717/
peerj.1804#supplemental-information.
REFERENCES
Ågesen TH, Sveen A, Merok MA, Lind GE, Nesbakken A, Skotheim RI, Lothe RA. 2012. ColoGuideEx: a robust gene classifier specific for stage II colorectal cancer prognosis.
Gut61(11):1560–1567DOI 10.1136/gutjnl-2011-301179.
Benvenuti S, Sartore-Bianchi A, Di Nicolantonio F, Zanon C, Moroni M, Veronese S, Siena S, Bardelli A. 2007.Oncogenic activation of the RAS/RAF signaling pathway impairs the response of metastatic colorectal cancers to anti–epidermal
growth factor receptor antibody therapies.Cancer Research67(6):2643–2648
DOI 10.1158/0008-5472.CAN-06-4158.
Boland CR, Thibodeau SN, Hamilton SR, Sidransky D, Eshleman JR, Burt RW, Meltzer SJ, Rodriguez-Bigas MA, Fodde R, Ranzani GN, Srivastava S. 1998.A National Cancer Institute Workshop on Microsatellite Instability for cancer detection and familial predisposition: development of international criteria for the determination of microsatellite instability in colorectal cancer.Cancer Research58(22):5248–5257. Bosch LJW, de Wit M, Oudgenoeg G, Hiemstra A, Mongera S, Piersma SR, Pham TV,
reveals new candidate biomarkers for colorectal cancer screening [Abstract].Cancer Research72(8 Supplement):4523DOI 10.1158/1538-7445.AM2012-4523.
Breiman, Leo. 2001.Random forests.Machine Learning 45(1):5–32
DOI 10.1023/A:1010933404324.
Chen X, Ishwaran H. 2013.Pathway hunting by random survival forests.Bioinformatics
29(1):99–105DOI 10.1093/bioinformatics/bts643.
Díaz-Uriarte R, De Andres SA. 2006.Gene selection and classification of microarray data
using random forest.BMC Bioinformatics7(1):3DOI 10.1186/1471-2105-7-3.
Freeman TJ, Smith JJ, Chen X, Washington MK, Roland JT, Means AL, Eschrich SA, Yeatman TJ, Deane NG, Beauchamp RD. 2012.Smad4-mediated signaling inhibits intestinal neoplasia by inhibiting expression ofβ-catenin.Gastroenterology
142(3):562–571 e2DOI 10.1053/j.gastro.2011.11.026.
Gryfe R, Kim H, Hsieh ETK, Aronson MD, Holowaty EJ, Bull SB, Redston M, Gallinger S. 2000.Tumor microsatellite instability and clinical outcome in young
patients with colorectal cancer.New England Journal of Medicine342(2):69–77
DOI 10.1056/NEJM200001133420201.
Huang Z, Huang D, Ni S, Peng Z, Sheng W, Du X. 2010.Plasma microRNAs are
promising novel biomarkers for early detection of colorectal cancer.International
Journal of Cancer127(1):118–126 DOI 10.1002/ijc.25007.
Irizarry RA, Hobbs B, Collin F, Beazer-Barclay YD, Antonellis KJ, Scherf U, Speed TP. 2003.Exploration, normalization, and summaries of high density oligonucleotide array probe level data.Biostatistics4(2):249–264
DOI 10.1093/biostatistics/4.2.249.
Ishwaran H, Gerds TA, Kogalur UB, Moore RD, Gange SJ, Lau BM. 2014.Random survival forests for competing risks.Biostatistics15(4):757–773.
Ishwaran H, Kogalur UB, Blackstone EH, Lauer MS. 2008.Random survival forests.The Annals of Applied Statistics2(3):841–860.
Ishwaran H, Kogalur UB, Chen X, Minn AJ. 2011.Random survival forests for
high-dimensional data.Statistical Analysis and Data Mining 4(1):115–132
DOI 10.1002/sam.10103.
Jorissen RN, Gibbs P, Christie M, Prakash S, Lipton L, Desai J, Kerr D, Aaltonen LA, Arango D, Kruhoffer M, Orntoft TF, Andersen CL, Gruidl M, Kamath VP, Eschrich S, Yeatman TJ, Sieber OM. 2009.Metastasis-associated gene expression changes predict poor outcomes in patients with Dukes stage B and C colorectal
cancer.Clinical Cancer Research15(24):7642–7651
DOI 10.1158/1078-0432.CCR-09-1431.
Lu A-TT, Salpeter SR, Reeve AE, Eschrich S, Johnston PG, Barrier AJ, Bertucci F, Buckley NS, Salpeter EE, Lin AY. 2009.Gene expression profiles as predictors of poor outcomes in stage II colorectal cancer: a systematic review and meta-analysis.
Clinical Colorectal Cancer8(4):207–214DOI 10.3816/CCC.2009.n.035.
G, Laurent-Puig P, Boige V. 2013.Gene expression classification of colon cancer
into molecular subtypes: characterization, validation, and prognostic value.PLoS
Medicine10(5):e1001453DOI 10.1371/journal.pmed.1001453.
Markowitz SD, Bertagnolli MM. 2009.Molecular basis of colorectal cancer.New England Journal of Medicine361(25):2449–2460DOI 10.1056/NEJMra0804588. O’Connell JB, Maggard MA, Ko CY. 2004.Colon cancer survival rates with the new
American Joint Committee on Cancer sixth edition staging.Journal of the National
Cancer Institute96(19):1420–1425DOI 10.1093/jnci/djh275.
O’Connell MJ, Lavery I, Yothers G, Paik S, Clark-Langone KM, Lopatin M, Watson D, Baehner FL, Shak S, Baker J, Cowens JW, Wolmark N. 2010.Relationship between tumor gene expression and recurrence in four independent studies of patients with stage II/III colon cancer treated with surgery alone or surgery plus adjuvant
fluorouracil plus leucovorin.Journal of Clinical Oncology28(25):3937–3944
DOI 10.1200/JCO.2010.28.9538.
Oh SC, Park Y-Y, Park ES, Lim JY, Kim SM, Kim S-B, Kim J, Kim SC, Chu I-S, Smith JJ, Beauchamp RD, Yeatman TJ, Kopetz S, Lee J-S. 2012.Prognostic gene expression
signature associated with two molecularly distinct subtypes of colorectal cancer.Gut
61(9):1291–1298DOI 10.1136/gutjnl-2011-300812.
Ragnhammar P, Hafström L, Nygren P, Glimelius B. 2001.A systematic overview
of chemotherapy effects in colorectal cancer.Acta Oncologica40(2–3):282–308
DOI 10.1080/02841860121543.
Salazar R, Roepman P, Capella G, Moreno V, Simon I, Dreezen C, Lopez-Doriga A, Santos C, Marijnen C, Westerga J, Bruin S, Kerr D, Kuppen P, van de Velde C, Morreau H, Van Velthuysen L, Glas AM, Van’t Veer LJ, Tollenaar R. 2011.Gene expression signature to improve prognosis prediction of stage II and III colorectal
cancer.Journal of Clinical Oncology 29(1):17–24DOI 10.1200/JCO.2010.30.1077.
Shi M, Beauchamp RD, Zhang B. 2012.A network-based gene expression
signa-ture informs prognosis and treatment for colorectal cancer patients.PLoS ONE
7(7):e41292DOI 10.1371/journal.pone.0041292.
Shi M, Wu M, Pan P, Zhao R. 2014.Network-based sub-network signatures
un-veil the potential for acute myeloid leukemia therapy.Molecular BioSystems
10(12):3290–3297.
Smith JJ, Deane NG, Wu F, Merchant NB, Zhang B, Jiang A, Lu P, Johnson JC, Schmidt C, Bailey CE, Eschrich S, Kis C, Levy S, Washington MK, Heslin MJ, Coffey RJ, Yeatman TJ, Shyr Y, Beauchamp RD. 2010.Experimentally derived metastasis gene expression profile predicts recurrence and death in patients with colon cancer.
Gastroenterology138(3):958–968 DOI 10.1053/j.gastro.2009.11.005.
Statnikov A, Wang L, Aliferis CF. 2008.A comprehensive comparison of random forests
and support vector machines for microarray-based cancer classification.BMC
Bioinformatics9(1):319 DOI 10.1186/1471-2105-9-319.
patients with favorable prognosis in three tumor types.Journal of Molecular Medicine
87(6):633–644DOI 10.1007/s00109-009-0467-y.
Sveen A, Ågesen TH, Nesbakken A, Rognum TO, Lothe RA, Skotheim RI. 2011.
Transcriptome instability in colorectal cancer identified by exon microarray analyses: Associations with splicing factor expression levels and patient survival.Genome Medicine3(5):32–32DOI 10.1186/gm248.
Sveen A, Nesbakken A, Agesen TH, Guren MG, Tveit KM, Skotheim RI, Lothe RA. 2013.Anticipating the clinical use of prognostic gene expression–based tests for colon cancer stage II and III: is godot finally arriving?Clinical Cancer Research
19(24):6669–6677DOI 10.1158/1078-0432.CCR-13-1769.
Sveen A, Agesen TH, Nesbakken A, Meling GI, Rognum TO, Liestol K, Skotheim RI, Lothe RA. 2012.ColoGuidePro: a prognostic 7-gene expression signature for
stage III colorectal cancer patients.Clinical Cancer Research18(21):6001–6010
DOI 10.1158/1078-0432.CCR-11-3302.
Van Schaeybroeck S, Allen WL, Turkington RC, Johnston PG. 2011.Implementing
prognostic and predictive biomarkers in CRC clinical trials.Nature Reviews Clinical
Oncology8(4):222–232DOI 10.1038/nrclinonc.2011.15.
Yothers G, O’Connell MJ, Lee M, Lopatin M, Clark-Langone KM, Millward C, Paik S, Sharif S, Shak S, Wolmark N. 2013.Validation of the 12-gene colon cancer recurrence score in NSABP C-07 as a predictor of recurrence in patients with stage II and III colon cancer treated with fluorouracil and leucovorin (FU/LV)
and FU/LV plus oxaliplatin.Journal of Clinical Oncology 31(36):4512–4519
DOI 10.1200/JCO.2012.47.3116.
Zhu J, Wang J, Shi Z, Franklin JL, Deane NG, Coffey RJ, Beauchamp RD, Zhang B. 2013.Deciphering genomic alterations in colorectal cancer through transcriptional
subtype-based network analysis.PLoS ONE8(11):e79282
DOI 10.1371/journal.pone.0079282.
Zou M, Zhang P-J, Wen X-Y, Chen L, Tian Y-P, Wang Y. 2015.A novel mixed integer programming for multi-biomarker panel identification by distinguishing malignant