ZDB-Number: 2668735-5
IC Journal No: 8192
Volume 2 Issue 1
Online Available at www.phytojournal.com
Journal of Pharmacognosy and Phytochemistry
Vol. 2 No. 1 2013 www.phytojournal.com Page | 43
Carbon Stock Potential of Oak and Pine Forests in Garhwal
Region in Indian Central Himalayas
Nanda Nautiyal1, Vir Singh 2*
1. Research Scholar, Department of Environmental Science, College of Basic Sciences and Humanities, GB Pant University of Agriculture and Technology, Pantnagar-263145, Uttarakhand, India.
[E-Mail: [email protected]]
2. Professor, Department Of Environmental Science, College of Basic Sciences and Humanities, GB Pant University Of Agriculture And Technology, Pantnagar-263145, Uttarakhand, India.
[E-mail: [email protected], [email protected]]
Oak (Quercus leucotichophora) and pine (Pinus roxburghii) are the two most dominant forest types occurring in Indian Central Himalayas. CO2 mitigation potential of these two forest types was observed in the present study. Carbon stock densities for AGTB, BB, LHG, DWS, AGSB and SOC were estimated and higher values were recorded in oak forest stands. Total carbon density estimated was 2420.54 Mg/ha for oak forest of Gopeshwar and 986.93 Mg/ha for pine forest of Nandprayag. CO2 mitigation potential of oak forest of Gopeshwar was recorded to be 8,713.94 CO2e and of pine forests 3552.95 CO2e.
Keyword: Oak, Pine, Carbon Stock Potential, Forest Stock.
1. Introduction
Global warming thanks to continuous accumulation in the atmosphere of GHGs, especially of CO2, is spelling its ill impacts on the
forest ecosystems of the Himalayas. The increased CO2 needs to be sequestered for
striking an ecological balance and reversing global warming trends. Forests and soils are the natural sinks for the carbon in the nature. Forest vegetation and soils share almost 60% of the world’s terrestrial carbon (Winjum et al. 1992). An ecosystem plays an important role in the storage and cycling of carbon. A forest is an important and a core component of a mountain agro-ecosystem (Singh 2005).
The Himalayan forest vegetation ranges from tropical dry deciduous forests in the foothills to timberline. Oak (Quercus leucotichophora) and pine (Pinus roxburghii) constitute the dominant
forest ecosystems in the Central Himalayas (Ram et al. 2004). Pinus roxburgii is closely associated with Cedrus deodara, Lyonica ovalifolia, Pinus wallichiana, Pyrus pashia and Rhododendron arboretum in mid-altitudes while Quercus leucotichophora is closely associated with Alnus nepalensis, Lyonia ovalifolia, Myrica esculenta, Quercus glauca, Prunus cerasoides (Semwal et al,. 2009). Forests play a critical role in reducing ambient CO2 levels, by sequestering atmospheric
carbon into the growth of woody biomass through the process of photosynthesis and also by increasing the soil organic carbon (SOC) content (Brown and Pearce, 1994).
Vol. 2 No. 1 2013 www.phytojournal.com Page | 44
fodder and other daily needs of the villagers. Therefore, these two dominant types of forest were selected and analysed for working out their
potential of carbon mitigation in Garhwal Himalaya.
Table1:Above-ground tree biomass in oak dominated forest of Gopeshwar
S. No. Species DBH
(cm) Height (m)
ρ
(gcm-3)
AGTB (Kg)
1 Rhododendron arboreum 20 3 0.628 59.21
2 Rhododendron arboreum 14.9 1.3 0.628 7.03
3 Rhododendron arboreum 26.5 4.2 0.628 883.14
4 Myrica esculenta 28 6.37 0.737 8680.91
5 Quercus leucotichophora 50.48 9.1 0.865 30467.72
6 Quercus leucotichophora 134.5 12.6 0.865 13115.18
7 Quercus leucotichophora 200 20 0.865 18165.38
8 Quercus leucotichophora 157.4 13.9 0.865 22845.45
9 Quercus leucotichophora 174.3 15.7 0.865 59.21
10 Quercus leucotichophora 186.75 17.2 0.865 7.01
2. Materials and Methods
Present study was carried out in the oak (Quercus leucotrichophora) and pine (Pinus roxburghii) forest stands at Gopeshwar and Nandprayag areas of the Garhwal region in the Indian Central Himalayas, respectively. Oak forest was located at latitude and longitude of 30.42° N and 79.33° E with an elevation of 1,293 meters and pine forest at latitude and longitude of 30.33° N and 79.33° E with an elevation of 944 meters in the area of study.
Carbon stock of the two forest types was estimated by following the methodology of Subedi et al. (2011). The carbon stock in the forests was measured through the amounts of carbon present in leaf litter, herbs, and grass; above-ground sapling biomass; dead wood and stumps; soil organic carbon; below-ground biomass; and above-ground tree biomass. Total carbon stock density was converted to tons of CO2 equivalent by multiplying it by a factor of
3.67.
3. Results and Discussion
Oak (Quercus leucotichophora) in the study site of Gopeshwar was found occurring in association with Rhododendron arboretum and Myrica esculenta. On the other hand, Rhus parviflora and Lantana camara were other two types of vegetation seen associated with pine forest stands in the study area in Nandprayag.
3.1. Above-Ground Tree Biomass (AGTB)
The Diameter at breast height (DBH) (at 1.3m) and height of individual trees greater than or equal to 5cm DBH were measured in each permanent circular 250 m² plot. DBH is the basic measurement standard for trees. It can be calculated by the following formula:
AGTB = 0.0509 × ρD²H
Where, AGTB is in kg; wood specific gravity (ρ) in g cm -³; tree diameter at breast height (D) in cm; and tree height (H) in m.
Vol. 2 No. 1 2013 www.phytojournal.com Page | 45
of sampling plot (250 m²), the biomass stock density is attained in kg m-2. This value can be converted to t ha-1 by multiplying it by 10.
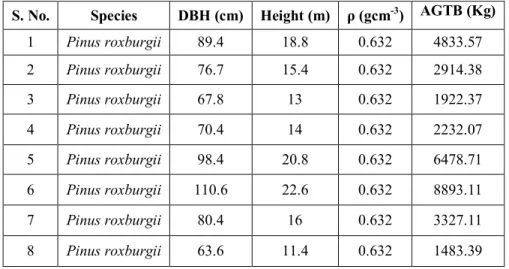
AGTB was calculated in both types of the forests and it was found to be 1771.97 Mg/ha in oak forest and 603.19 Mg/ha in pine forest. Tables 1 and 2 show information on tree species, trunk
diameter at breast height, tree height and wood specific gravity of tree observed at the study sites. Value of AGTB generally depends on height, DBH and specific gravity of the tree. Oak forest recorded high AGTB due to accumulation of more biomass in the oak stands than in the pine stand.
Table 2: Above-ground tree biomass in pine dominated forest of Nandprayag
S. No. Species DBH (cm) Height (m) ρ (gcm-3) AGTB (Kg)
1 Pinus roxburgii 89.4 18.8 0.632 4833.57
2 Pinus roxburgii 76.7 15.4 0.632 2914.38
3 Pinus roxburgii 67.8 13 0.632 1922.37
4 Pinus roxburgii 70.4 14 0.632 2232.07
5 Pinus roxburgii 98.4 20.8 0.632 6478.71
6 Pinus roxburgii 110.6 22.6 0.632 8893.11
7 Pinus roxburgii 80.4 16 0.632 3327.11
8 Pinus roxburgii 63.6 11.4 0.632 1483.39
3.2. Below-Ground Biomass (BB)
General formula recommended by Mac Dicken (1997) was considered here for estimation of BB which is based on 1:5 for root-to-shoot value. According to this simple value BB can be considered as 20% of AGTB.
BB value was higher in the oak stands (354.39 Mg/ha) than in the pine stands of (120.64 Mg/ha), which presumably was due to high AGTB value of the former species than that of the latter. More the AGTB more will be the below ground biomass. The well-developed root system of an oak accumulates more carbon than the relatively less developed tap roots of pine. Microbes associated with the roots also contribute to enhance the carbon sequestration in the soil. The roots of oak provide larger surface area for the microbes to capture more carbon than the pine tree roots.
3.3. Above-Ground Sapling Biomass (AGSB)
There were no saplings in the selected study plots in both the study areas. So it was ignored. The
forest floor was almost devoid of saplings which could be measured for the purpose.
3.4. Soil Organic Carbon (Soc)
The carbon stock density of SOC was calculated by following method (Pearson et al., 2007):
= × × %
According to this equation, carbon stock density was found higher in oak forest (97.46 Mg/ha) than 73.43 Mg/ha of pine forest.
SOC is an important component of the soil due to its capacity to affect plant growth as both a source of energy and an initiator for nutrient availability through mineralization. SOC fractions in the active pool serve as the main source of energy and nutrients for soil microorganisms. Temperature, precipitation, atmospheric CO2 concentration, and other
Vol. 2 No. 1 2013 www.phytojournal.com Page | 46
Correct assessment of SOC in the Indian Central Himalayas is very tricky to measure. It is subjected to change because villagers generally sweep the forest floor for their livelihood. They grab litter, wood and soil cover for agricultural and livestock purposes. Due to change in soil
cover SOC may vary because of change in microbial activity. Soil properties too have significant impact on SOC. The more acidic nature of pine forests soil decreases the storage of carbon in the soil.
Fig. 1: Carbon Stock Present in Different Carbon Pools in the Forests of Oak and Pine
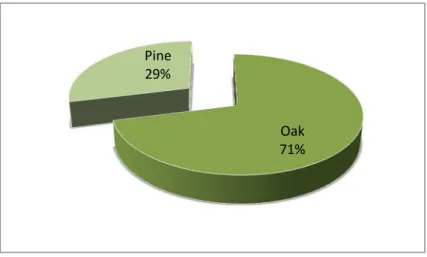
Fig. 2: Share of Oak and Pine Forests in Carbon Mitigation Potential
3.5. Leaf Litter, Herbs, and Grass (LHG)
Biomass of leaf litter, herbs and grass (LHG) was estimated under this category. LHG was found higher in the oak forest (196.72 Mg/ha), while it was recorded low in the pine forest (189.67 Mg/ha). Acidic nature of pine forest soil inhibits the growth of other vegetation. High soil moisture
and relatively higher pH of oak forest soil supports vegetation and litter layer in the forest to accumulate more carbon from the atmosphere.
3.6. Dead Wood and Fallen Stumps (DWS)
Under DWS carbon component, carbon was estimated in standing dead trees, fallen stems,
0 500 1000 1500 2000
AGTB AGSB BB SOC LHG DWS
C
a
rb
o
n
(
M
g
/h
a
)
Carbon Pool
Oak
Pine
Oak 71% Pine
Vol. 2 No. 1 2013 www.phytojournal.com Page | 47
fallen branches and stumps (dead or alive). In both the forest stands, no logged tree and standing dead tree were observed in study plot. Downed and dead wood was found in both the study areas and carbon was estimated in them. Oak forest stands were observed with relatively higher DWS values (4.5 x 10⁻³ Mg/ha) compared to pine stands (1.36x10⁻³ Mg/ha).
In the forests of Garhwal Himalayas local communities pick up the dead wood and fallen stumps for fulfilling their daily requirement. Many mountain communities still rely on fuel wood burning for domestic use. The herbs and grasses are also collected by the local people for agro-ecological activities. Cattle grazing and selective sieving by the communities in the region leads to continuous alteration in the carbon storage in the forest stands. DWS, LHG, AGSB and SOC, due to constant changes in their values, are very complicated to measure in the estimation of forest carbon stock for the area. Oak forest provides numerous opportunities to the community in the vicinity to fulfill their requirement for fodder lopping, fire wood collection, extracting wood for agricultural tools and implements, and for many other domestic purposes. An oak forest is ecologically sounder than a pine forest.
3.7. Total Carbon Stock Density
The carbon stock density was estimated by summing up all the carbon stock densities of individual carbon pools. It was calculated with the help of following expression:
C(LU) = C(AGTB) + C(AGSB) + C(BB) + C(LHG) + C(DWS) + SOC
Carbon stock density was found higher in oak forest (2420.54 Mg/ha) than in pine forest (986.93 Mg/ha) (Fig 1).
In most of the ecosystems, carbon is stored in the plant biomass in sal (Shorea robusta) and oak dominated forests, the proportion being 80-92%, while in pine dominated forests, biomass accounts for just a little more than 50% of the ecosystem carbon (Jina et al., 2008).
The carbon stock density values would vary according to the geographical location, plant species, age of the stand, aboveground input received from leaf litter, decomposition of fine roots below ground, management practices and other operating ecological factors. Land use and soil management practices can significantly influence soil organic carbon dynamics and carbon flux of the soil (Batjes, 1996; Tian et al., 2002; Rasse et al. 2006; Van Noordwijk et al. 1997).
3.8. Carbon Mitigation Potential
The total carbon stock is converted to tons of CO2
equivalent by multiplying it by 44/12, or 3.67 (Pearson et al. 2007). Carbon mitigation potential was estimated at 8,713.94 CO2e for the oak forest
and 3552.95 CO2e for the pine stands. Fig. 2
clearly shows the share of the forests in the mitigation of carbon in the atmosphere.
The values derived through this study corroborated with those encountered in other studies. Jina et al. (2009) conducted a study in degraded and non-degraded oak and pine forests in Indian Central Himalayas and reported high carbon value in oak forest than in pine forest. High carbon potential of oak forest over pine forest was also reported by Singh et al. (2009) in Garhwal Himalayas.
4. Conclusion
This study reveals that, compared to pine forests, oak forests were rich in terms of stocked carbon. Microclimate generated by oak forests stand enables other vegetation’s to incite easily. Carbon stock density was observed higher in oak forest (2420.54 Mg/ha) than in pine forest (986.93 Mg/ha). Carbon mitigation potential was estimated to be 8,713.94 CO2e for the oak stands
and 3552.95 CO2e for the pine stands. It can be
inferred from the study that oak forests are more potent and promising from the view point of their role in building up carbon stock and consequent climate change mitigation.
5. Acknowledgement
Albert-Vol. 2 No. 1 2013 www.phytojournal.com Page | 48
Flügel. DST-Inspire Fellowship awarded to the first author is gratefully acknowledged.
6. References
1. Batjes, N. H. 1996. Total carbon and nitrogen in the soils of the world. European Journal of Soil
Scence. 47:151-163.
2. Brown, K. and Pearce, D. 1994. The economic value of non-market benefits of tropical forests: carbon storage. In: Weiss, J. (ed.), The Economics of Project Appraisal and the
Environment: New Horizon in Environment
Economics. E. Elgar, Aldershot, Pp 102–119. 3. Jina, B. S., Bohra, C. S. and Sah, P. 2009.
Pedology of oak and pine forests in Indian Central Himalaya. Nature and Science. 7(7): 113-115.
4. Jina, B. S., Sah, P., Bhatt, M. D., and Rawat, Y. S. 2008. Estimating carbon sequestration rates and total carbon stockpile in degraded and non-degraded sites of oak and pine forest of Kumaun Central Himalaya. Ecoprint. 15: 75-81. 5. MacDicken, K. G. 1997 A Guide to Monitoring
Carbon Storage in Forestry and Agro-forestry Projects. Arlington, USA: Winrock International 6. Pearson, T. R., Brown, S. L., Birdsey, R. A. 2007.
Measurement guidelines for the sequestration of forest carbon. U.S.: Northern research Station, Department of Agriculture
7. Ram, J., Kumar, A. and Bhatt, J. 2004. Plant diversity in six forest types of Uttaranchal, Central Himalaya, India. Current Science 86: 975-978.
8. Rasse, D. P., Mulder, J., Moni, C. and Chenu, C. 2006. Carbon turnover kinetics with depth in a French loamy soil. Soil Sci Soc Am J. 70(6):2097–2105.
9. Semwal, S., Nautiyal, B. P. and Bhatt, A. B. 2008. Dominance diversity patterns and regeneration status of moist temperate forests in garhwal, part of the North-West Himalayas India. Taiwan J. For. Sci.. 23: 351-364.
10. Singh, H., Kumar, M. and Sheikh, M. A. 2009. Distribution pattern of oak and pine along altitudinal gradients in Garhwal Himalaya.
Nature and Science. 7(11): 81-85.
11. Singh, V. 2005. Agrobiodiversity, Sustainability and Food Security in the Himalayan Mountains:
An Uttaranchal Perspective. Gorakhpur:
Gorakhpur Environmental Action Group, 50 pp. 12. Subedi, B. P., Pandey, S. S., Pandey, Ajay., Rana, E. B., Bhattarai, S., Banskota, T. R., Charmakar, S. and Tamrakar, R. 2011. Guidelines for measuring carbon stocks in community-managed forests: ANSAB, FECOFUN, ICIMOD, NORAD. Pp 66+10.
13. Tian, H., Melillo, J. M. and Kicklighter, D. W. 2002. Regional carbon dynamics in monsoon asia and implications for the global carbon cycle. Global and Planetary Change. 37: 201-217.
14. Van Noordwijk, M., Cerri, C., Woomer, P. L., Nugroho, K. and Bernoux, M. 1997. Soil carbon dynamics in the humid tropical forest zone.
Geoderma. 79(1–4):187–225
15. Winjum, J. K., Dixon, R. K. and Schroeder, P. E. 1992. Estimating the global potential of forest and agroforest management practices to sequester carbon. Water, Air and Soil Pollution. 64: 213-228.
16. Zhou, X. Y., Zhang, C. Y. and Guo, G. F. 2010. Effects of climate change on forest soil organic carbon storage: a review. Ying Yong Sheng Tai