[23]
Agris on-line Papers in Economics and Informatics
Volume II Number 1, 2010
Competitiveness of Agrarian Areas in the Stavropol Region
V. Varivoda, W. Heijman, J. van Ophem
Valentina Varivoda, Stavropol State Agrarian Universit; Wim Heijma and Johan van Ophem, Wageningen University
Abstract
Regional development is determined by possessing specific competitive advantages and their constant improvement. The problem how to increase competitiveness of the areas remains one of the most important for the agrarian sector. Russian economic policy aims at the stable development of the agro industrial complex (and agriculture as its central part). Therefore it is necessary to analyze competitiveness not only on the country level, but also on the regional and sub-regional scale. In this paper we have analyzed the major factors influencing the competitiveness of agricultural areas in the Stavropol region.
Key words
Competitiveness, agrarian areas, Stavropol region, regional and sub-regional scale.
Anotace
Regionální rozvoj je ur en vlastnictvím zvláštních konkuren ních výhod a jejich stálým zlepšováním. Problém, jak zvýšit konkurenceschopnost oblastí z stává jednou z nejd ležit lších otázek agrárního sektoru. Cílem ruské hospodá ské poliky je stabilní rozvoj zem d lsko-pr myslového komplexu (a zem d lství jako jeho hlavní ásti). roto je nutné analyzovat konkurenceschopnost nejen na úrovni zem , ale také v regionálním a sub-regionálním m ítku. V tomto lánku auto i analyzovali hlavní faktory ovliv ující konkurenceschopnost zem, d lských oblastí ve Stavropolském regionu.
Klí ová slova
Konkurenceschopnost, zem d lské oblasti, Stavropolský region, regionální a sub-regionální m ítko.
Introduction
The aim of the paper is to analyse a state of legal regulation of information and communication technologies in the food industry in the CR in comparison with the Community law. To meet the given objective it was necessary to carry out a detailed study of the current publication sources from the area of national legislation and the Community law. The main methods used in the research were primarily an analysis of the legal regulations, a comparison, an abstraction, and a deduction analogy. Primary data sources used were acts, decrees and regulations in the areas of processing and trading of food products in the conditions of the CR.
During the process of economic globalization competitiveness for markets, investments, innovations and new technologies became much
more intense not only between commodity producers, but also between the agricultural areas. The prospects for the development of the agricultural areas is conditioned by the availability and constant improvement of competitive advantages for a better participation in the interregional division of labor in order to raise the living standards. The problem of improving the competitiveness of the regions is one of the most pressing challenges now, as will be shown later in this paper.
[24] suppliers (Pilipenko, 2005). The identification of the geographic scope of competitive advantage is necessary to determine the main objects of policies to improve the competitiveness of regions. This is especially important for rural areas, because the industry activity for the rural population is agriculture with its apparent limits in the spectral and spatial principles of governance. The spatial aspects of competitive advantages were first
considered in relation to the differentiation between countries in the global economy. Later on the study of competitiveness shifted to the study of competitive advantage at the regional level (O Brien, 1992). The South Federal District of Russia (SFD) contains the Stavropol region. The South Federal District of Russia is a very important agricultural production area.
The Stavropol region
The main goal of modern economic policy of Russia is to build effective and sustainable development of agro-industrial complex (AIC), the central core of which is agriculture. The agriculture in Russia is characterized by large scale farming and one of the major suppliers of agricultural products is the South Federal District. The large agro-industrial complex, which is in transition to a market economy is pointed to make significant contributions to fostering the objectives of economic and social revival of Russia. Taking 29.9% of the territory of Russia, it accounts for 13 % of the population. The total production value of
all economic activities of the Southern Federal District Organizations amounted to about 3 trillion. rubles in 2007 (CFSS, 2007).
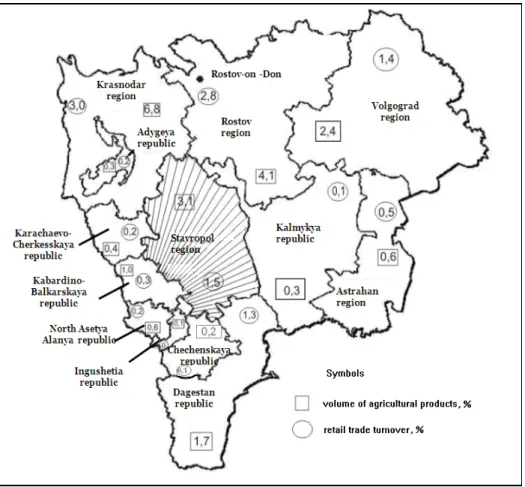
The territory of SFD comprises, see Figure 1, 8 republics, 3 regions (oblasts) and 2 regions (krays), one of which is the Stavropol region - a major commodity producer of agricultural products throughout the country, 47 % of its population is living in 307 rural municipalities.
Stavropol Region has a good economic performance: the volume of retail trade 1.5 %, and the volume products of agriculture 3.1 %.of Russian total. We know that economic growth in
[25] the region is dependent on the economic growth of the districts, which is achieved by higher competitiveness. Therefore, the problem of ensuring and enhancing the territorial competitiveness should be the primary objective of research at this moment. As of 1 January 2009 the number of population of the Stavropol region amounted to 2.705 million people, of whom 1.267 million people reside in rural areas (47 %), see Table 1 (CFSS, 2008). Some districts do not have an urban population, and do only have an agricultural focus, such as Alexandrovsky, Andropovsky, Apanasenkovsky, Arzgirsky, Grachevsky and etc..
Currently, the rural areas face a period of stabilization of industrial and social-economic
change. Average monthly salary is increasing, farming and small-scale business is developing. However, there are many problems in rural districts, in particular, the growing disparity in living standards between the urban and rural population. As we already know, competitive advantage is the ability to use objective advantages and to produce something exceptional in comparison to others. It is based primarily on the inequality in objective positions of the managing subjects. And of course, it is very interesting to study the factors or variables, which make a particular territory more competitive than another one. The core element of information for decision-making in the field of competitiveness is the data about the behavior of competitors, about their competitive positions. Therefore, the selection of the most important
Districts Total numbers of Urban The numbe r of rural
Alexandrovsky 50109 0 8
Andropovsky 34877 0 11
Apanasenkovsky 34487 0 11
Arzgirsky 26926 0 8
Blagodarnensky 63613 33075 13
Budennovsky 116990 65224 13
Georgievsky 160316 69202 14
Grachevsky 35897 0 8
Izobilnensky 100008 58710 12
Ipatovsky 65805 28133 15
Kirovsky 66515 23014 9
Kochubeevsky 205458 129106 15
Krasnogvardeysky 39974 0 11
Kursky 51555 0 12
Levokumsky 45995 0 11
Mineralovodsky 234210 76712 13
Nephtekumsky 68625 26495 10
Novoalexandrovsky 64329 26538 11
Novoselitsky 25531 0 8
Petrovsky 79285 39491 12
Predgorniy 505103 397160 15
Sovetsky 70910 40475 6
Stepnovsky 22596 0 7
Trunovsky 34408 0 6
Turkmensky 26302 0 11
Shpakovsky 475276 424701 11
Stavropolsky Region 2705100 1438036 281
[26] variables, in the analysis of competitiveness will be very useful for organizing decisions in the sphere of competitiveness management (Skopina, 2004).
Competitiveness and its indicators
For more information, describing the living standards of rural residents of Stavropol region, we used the data of State Statistics Committee of the Stavropol region on the following indicators in 2006, 2007 and 2008 years:- population size,
- average number of working-age population,
- wages,
- the average monthly vage,
- financial results for all enterprises and organizations,
- the size of investments in fixed assets,
- size of investment in housing,
- the number of putting into commissioned housing,
- total volume of agricultural products in the trend over the past 3 years,
- production of livestock products,
- production of milk,
- the volume of occupied territory,
- the proportion occupied by the market,
- urban population,
- the number of residents with higher education,
- the number of residents with secondary special education,
- the number of residents with the basic (school) education,
- the number of residents without education.
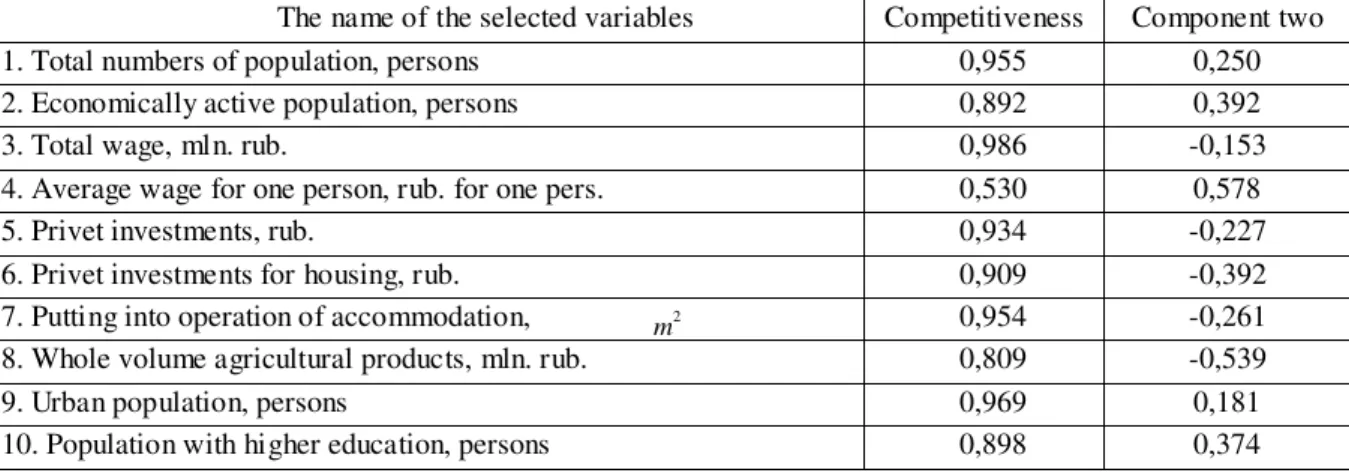
In order to investigate which of the 21 variables listed above are related to competitiveness, a principal component analysis (PCA) has been applied. The usual criteria in PCA were applied: Eigen value larger than one, loadings on components larger than 0.5 and, theoretically sound labeling of at least the main component. The final result is given in Table 2. The first component is the competitiveness, which explains about 80 per cent of the total variance. The ten variables listed in this table have high loadings (weights) on the first component which can be clearly labeled as competitiveness. Therefore, these variables are used in the subsequent analysis of this paper. Table 3 is based on Table 2, in which the data have been standardized to a common denominator. Table 3 presents all the results, taking into account the formulas used for the process of scaling values. Analyzing both tables we can see that the most important variables are the ones relating to wages, housing and education. The low level of wages has become one of the most powerful and permanent factors of destabilization the socio-economic situation in the country. The level of wages in Russia is the lowest among all developed countries.
This is partly due to differences in the structure of money incomes of urban and rural areas.
The name of the selected variables Competitiveness Component two
1. Total numbers of population, persons 0,955 0,250
2. Economically active population, persons 0,892 0,392
3. Total wage, mln. rub. 0,986 -0,153
4. Average wage for one person, rub. for one pers. 0,530 0,578
5. Privet investments, rub. 0,934 -0,227
6. Privet investments for housing, rub. 0,909 -0,392
7. Putting into operation of accommodation, 0,954 -0,261
8. Whole volume agricultural products, mln. rub. 0,809 -0,539
9. Urban population, persons 0,969 0,181
10. Population with higher education, persons 0,898 0,374
Table 2: Competitiveness and the factor loadings of its relevant variables . 2
[27] Districts Total
numbers of population
Econo-mically
active population
Total wage
Average wage for
one person
Privet investments
Privet investments for housing
Putting into operation of
accom-modation
Whole volume agricultural products 2008
Urban popula tion
Population with higher education
Alexandrovsky 0.057 0.036 0.010 0.120 0.006 0.001 0.001 0.006 0.000 0.038
Andropovsky 0.025 0.003 0.006 0.474 0.008 0.004 0.001 0.000 0.000 0.004
Apanasenkovsky 0.025 0.026 0.011 0.000 0.012 0.000 0.002 0.019 0.000 0.028
Arzgirsky 0.009 0.001 0.003 0.128 0.013 0.000 0.000 0.022 0.000 0.001
Blagodarnensky 0.085 0.043 0.023 0.224 0.020 0.011 0.007 0.026 0.078 0.046
Budennovsky 0.196 0.164 0.085 0.137 0.065 0.025 0.066 0.009 0.154 0.245
Georgievsky 0.285 0.131 0.075 0.293 0.102 0.046 0.046 0.042 0.163 0.219
Grachevsky 0.028 0.043 0.002 0.228 0.013 0.005 0.017 0.001 0.000 0.046
Izobilnensky 0.160 0.104 0.097 1.000 0.024 0.023 0.073 0.020 0.138 0.111
Ipatovsky 0.090 0.079 0.029 0.154 0.041 0.015 0.021 0.016 0.066 0.084
Kirovsky 0.091 0.067 0.024 0.399 0.023 0.032 0.030 0.054 0.054 0.072
Kochubeevsky 0.379 0.345 0.196 0.237 0.363 0.087 0.092 0.189 0.304 0.367
Krasnogvardeysky 0.036 0.025 0.020 0.364 0.088 0.002 0.007 0.089 0.000 0.026
Kursky 0.060 0.041 0.011 0.233 0.001 0.000 0.001 0.003 0.000 0.044
Levokumsky 0.048 0.032 0.008 0.046 0.024 0.008 0.001 0.006 0.000 0.034
Mineralovodsky 0.439 0.362 0.252 0.323 0.493 0.141 0.301 0.034 0.181 0.299
Nephtekumsky 0.095 0.073 0.042 0.473 0.067 0.000 0.003 0.008 0.062 0.077
Novoalexandrovsky 0.086 0.061 0.032 0.269 0.196 0.025 0.029 0.068 0.062 0.065
Novoselitsky 0.006 0.016 0.007 0.234 0.004 0.001 0.001 0.060 0.000 0.017
Petrovsky 0.117 0.078 0.038 0.239 0.025 0.009 0.011 0.026 0.093 0.083
Predgorniy 1.000 1.000 0.437 0.889 0.342 0.175 0.308 0.014 0.935 1.000
Sovetsky 0.100 0.066 0.042 0.400 0.040 0.014 0.010 0.057 0.095 0.070
Stepnovsky 0.000 0.001 0.000 0.064 0.000 0.001 0.001 0.008 0.000 0.001
Trunovsky 0.024 0.020 0.011 0.266 0.015 0.004 0.010 0.083 0.000 0.021
Trunovsky 0.008 0.000 0.002 0.057 0.002 0.005 0.001 0.014 0.000 0.000
Shpakovsky 0.938 0.651 1.000 0.557 1.000 1.000 1.000 1.000 1.000 0.693
[28] In particular, for urban residents the wage is the most significant kind of personal income. The greatest share in the structure of the monetary component of the budgets of rural households is the revenues from the sale of products produced in households. Also, this is due to the fact that the majority of the rural population is employed in industries with low wages - the agricultural and processing industry. As a result, in recent years, the average monthly wages of city residents has exceeded the average wages in rural areas by more than 70%.
Increasing wages and putting into operation of accommodation will help to alleviate the problems of the population in the socio-demographic sphere. It will positively affect the growth of the competitiveness of rural areas and, therefore, the Stavropol region and the whole country.
A prominent role in enhancing territorial's competitiveness, as shown by the data obtained, are the variables associated with the level of education. Raising the educational level of people is directly linked to improving the quality of life. Illiteracy hinders the development of public private sector and the economy as a whole.
Using existing statistical data, we found that a significant part of the population of the Stavropol region have not attended higher and secondary special education, which in turn limits the ability of people to make the right decisions for their financial health in the future. Improving the literacy level has become a public task and should be regarded as one of the priorities of our state. Unfortunately, the statistics do not provide an indication of the quality of education. The growth of the educational level of the population is the most important condition for the formation of an agent in the labor market. Education expands the possibility to using the ability of people to find a job. It allows them to correctly assess the situation, to make a decision and to implement it. This is illustrated by the experience of countries with developed market economies.
Typically, than the higher the educational level of the population, the lower the level of the unemployment rate. The role of education in achieving sustainable socio-economic development, in the growth of competitiveness of country and
strengthening of their position in the world market and world economy is constantly increasing..
The competitiveness of the Stavropol
districts
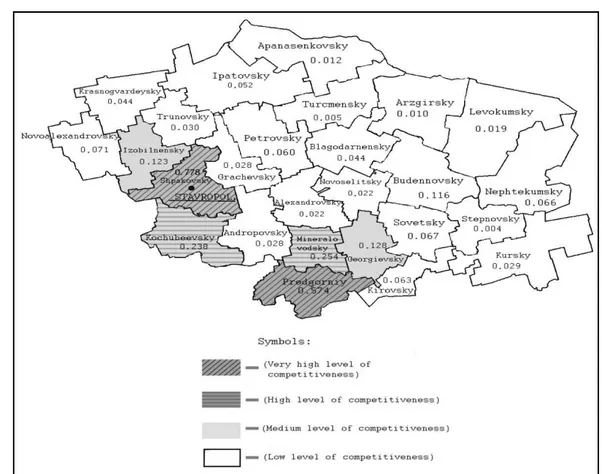
Based on the existing data and the use of a deterministic method for pattern recognition, the levels of competitiveness for all municipalities of the Stavropol region were established. The more similar numbers among the competitors in the market, the greater the competition between them, and in our case, as shown in Figure 2, we can see that the difference between the level of competition is very significant from 0.004 to 0.778 units.
We have divided the areas of analyzing in four groups according to the degree of competitiveness: (from 0 - up to 0.1) - less competitive (areas with low level of competitiveness), (from 0.1 - to 0.2) - competitive areas (areas with medium level of competitiveness), (from 0.2 - to 0.3) - more competitive areas (areas with a high level of competitiveness), (from 0.3 - to 1.0) – market’s leaders (districts with a very high level of competitiveness).
Noteworthy to mention is that the some of districts are desperately competing with each other - areas like Georgievsky (0.128) and Izobilnensky (0.123), Kochubeevsky (0.238) and Mineralovodsky (0.254) and etc.. The leading position is occupied by the Shpakovsky district. This indicates that the Shpakovsky district is the most competitive and likely to have better living conditions than its competitors. The highest level of income is in the regional center (Shpakovsky district).
[29]
Figure 2: Ranking of districts by the level of competitiveness within the taking into account the 2008 value of the indicators.
The greater competitiveness of the Stavropol is built up by a system of connecting of its districts with other territories participating in overall business and trade. Over the last decade as a result of the sharp decline in agricultural production and worsening of the financial situation of the agricultural sector, the disparities between village and town have increased with respect to favorable conditions of life. One of the reasons for the economic poverty in rural areas is the lack of domestic agricultural production and its weak adaptation to the globalization process (Skopina, 2004).
Conclusion
Variables related to education, housing and wages are the most important factors improving the competitiveness of a region.
The most competitive districts are small in numbers - 2 out of 26. Therefore, in order to increase the level of territorial's competitiveness of the Stavropol region, it is necessary to pay close
attention to the formation of a favorable climate of life for the rural residents, those districts that are less competitive.
Thus, to achieve a higher level of the competitiveness of the Stavropol region, a more substantial and sound public policy is needed for those districts which do not have a shortage of skilled manpower, lack financial support and, moreover, are faced in the worst weather conditions. Otherwise they would not be able to survive the competition and will disappear from the market space and, thereby, lose its appeal.
[30] Corresponding author:
Prof. Dr. Wim J.M. Heijman Wageningen University
Costerweg 50, 6701 BH Wageningen, The Netherlands email: Wim.Heijman@wur.nl
Literature
[1] Kachalina, L. (2006): Competitive management, Moscow: Eksmo (Professional edition for Business): 226.
[2] Maslennikova, E., Borisova, E., Holodov, V. (2002): On the implementation of the key areas of agricultural policy of the Government of the Russian Federation on 2001-2010, Food Industry: 20-24.
[3] Pilipenko, I. (2006): Competitiveness of countries and regions in the world economy: theory, experience of small countries in Western and Northern Europe, Smolensk, Ojkumena: 65-70.
[4] Fathutdinov, R. (2004): How to improve the competitiveness of Russia, Standards and quality: 15-17.
[5] CFSS (2007): Socio-economic Status of the Southern Federal District in 2007, Collection of the Federal State Statistics Service, Stavropol.
[6] CFSS (2008): Socio-economic Status of the Southern Federal District in 2008, Collection of the Federal State Statistics Service, Stavropol.
[7] Statistical handbook (2006): Stavropol Region in the figures, Stavropol Regional Committee of State Statistics, Stavropol.
[8] Statistical handbook (2007): Stavropol Region in the figures, Stavropol Regional Committee of State Statistics, Stavropol.
[9] Statistical handbook (2008): Stavropol Region in the figures, Stavropol Regional Committee of State Statistics, Stavropol.
[10] Skopina, I. (2004): Efficient management of regional economies. Collection of International Scientific and Practical Conference, Kirov: VyatGU: 231-234.
[11] O Brien R. (1992): Global Financial Integration: The End of Geography? L.: Pinter Publishers: 96-100.