Universidade Federal de Minas Gerais
Programa de Pós-Graduação em Ecologia, Conservação e Manejo da Vida
Silvestre
Rafael Barros Pereira Pinheiro
Trade-offs and resource breadth processes as drivers of
performance and specificity in a host-parasite system: a new
integrative hypothesis
Belo Horizonte
Minas Gerais
–
Brasil
Trade-offs and resource breadth processes as drivers of
performance and specificity in a host-parasite system: a new
integrative hypothesis
Trabalho de dissertação apresentado ao Programa de Pós-Graduação em Ecologia, Conservação e Manejo da Vida Silvestre da Universidade Federal de Minas Gerais como requisito para a obtenção do título de Mestre.
Orientador: Prof. Marco Aurélio Ribeiro de Mello Coorientadora: Prof.ª Érika Martins Braga
Belo Horizonte Minas Gerais - Brasil
Agradeço a Deus que me guiou e guardou até aqui.
Ao meu orientador: Marco Mello.
Á minha coorientadora: Érica Braga.
Ao meu amigo e coautor Gabriel, que foi na prática tão responsável pela execução desse projeto quanto eu.
Ao Prof. José Eugênio pela orientação inicial e muitas outras contribuições durante o trabalho.
Aos demais colaboradores do projeto: Gustavo Lacorte, Anderson Vieira e Fabrício Rodrigues.
À minha família, pelo apoio. Em especial, à minha mãe que lutou muito para que eu chegasse até aqui, e à minha tia Antônia Célia que me hospedou durante todos esses anos de graduação e mestrado.
Aos amigos, pois eu sei que tenho os melhores.
Ao Grupo Evolução em Foco, por abrir os meus horizontes e me proporcionar muitas oportunidades de me desenvolver cientificamente.
1. Abstract ... 1
2. Resumo ……….. 2
3. Introduction ... 3
4. Methods ... 5
4.1 Data collection and phylogenetic analysis ………... 5
4.2 Specificity indices ... 6
4.3 Prevalence vs. Specificity... 6
4.4 Phylogenetic signal in parasitism and in local assemblage composition……….. 6
4.5 Network analysis ...………... 7
5. Results…... 7
6. Discussion... 10
7. Acknowledgments ... 18
8. Fundings ……….…... 18
9. References ……….. 19
Figures, Tables, Boxes and Supplementary Material
Table 1 ………... 8
Figure 1 ... 9
Figure 2 ……... 11
Box 1 ……….. 12
Figure 3 ... 14
Figure 4 ………..……… 15
Supplementary Material ...…... 22
Appendix S1... 22
Table S1 ……….. 24
Appendix S2 ………... 26
Figure S1 ………. 29
Table S2 ……….. 30
Trade-offs and resource breadth processes as drivers of performance
and specificity in a host-parasite system: a new integrative hypothesis
ABSTRACT
One of the unresolved issues in the ecology of parasites is the relationship between host specificity and performance. Previous studies tested this relationship in different systems and resulted in all possible outcomes. Therefore, two main hypotheses have been proposed to explain those conflicting results: the trade-off and resource breadth hypotheses, which are treated as alternative explanations in the literature and were corroborated by different studies. Here, we performed an extensive study, using specificity indices and network analysis, in order to test for a relationship between host specificity and prevalence in a rich avian malaria system. There was no correlation between specificity and prevalence, which contradicts both the trade off and resource breadth hypotheses. In addition, we detected a modular structure in our host-parasite network and found that its modules were not composed of geographically close, but of phylogenetically close host species. Despite trade-off and resource breadth hypotheses leading to opposite predictions, after performing our study we reached the conclusion that they are not mutually exclusive. As a conceptual solution we propose “The Integrative Hypothesis of Parasite Specialization”, a novel hypothesis that explains the contradictory results found so far and shows that the trade-off and resource breadth hypotheses are two sides of the same coin.
Trade-offs e processos relacionados à amplitude de nicho
determinando o desempenho e a especificidade em um sistema
parasito-hospedeiro: uma nova hipótese integrativa
RESUMO
Uma questão ainda não resolvida na ecologia de parasitos é a relação entre a especificidade de hospedeiros e desempenho de parasitos. Estudos anteriores testaram essa relação em diferentes sistemas e encontraram todos os possíveis resultados. Consequentemente, duas hipóteses principais foram propostas para explicar esses resultados conflitantes: a hipótese do trade-off e a hipótese da amplitude de nicho, as quais são tratadas na literatura como explicações alternativas e são corroboradas por diferentes estudos. Nesse trabalho realizamos um estudo aprofundado, utilizando índices de especificidade e análises de rede, com o objetivo de testar a relação entre especificidade de hospedeiros e prevalência em um sistema rico de malária aviária. Não houve correlação entre especificidade e prevalência, o que contradiz tanto a hipótese de
trade-off quanto a de amplitude de nicho. Além disso, nós detectamos uma estrutura
modular em nossa rede parasito-hospedeiro e descobrimos que esses módulos não são compostos por espécies hospedeiras geograficamente relacionadas, mas por espécies hospedeiras filogeneticamente próximas. Apesar das hipóteses de trade-off e amplitude de nicho possuírem predições opostas, depois de realizarmos nosso estudo concluímos que elas não são mutuamente exclusivas. Como uma solução conceitual nós propomos a “Hipótese Integrativa da Especialização de Parasitos”, uma nova hipótese que explica os resultados contraditórios encontrados até o momento na literatura científica e mostra que as hipóteses de trade-off e amplitude de nicho são dois lados da mesma moeda.
INTRODUCTION
Ecological specialization can be defined, in a broad sense, as a restriction in the niche of a species (Futuyma and Moreno 1988). Parasitism is a very interesting model for studies on niche breadth, as hosts represent both habitat and food for parasites. Therefore, the simplest way to measure the niche breadth of a parasite is through host specificity (Poulin et al. 2011).
Krasnov et al. (2004) suggested that the taxonomic composition of the host assemblage may be key to understand this variety of outcomes. From this perspective, predictions derived from the resource breadth hypothesis tend to be confirmed when the host assemblage is composed of phylogenetically close species, but they tend to be rejected when the hosts are phylogenetically distant from each other. The basic idea leading to this generalization is that closely related hosts have similar defense mechanisms, thus ecological and evolutionary processes that cause an increase in performance in one host species will probably have the same effect on all other species. In a phylogenetically diverse host assemblage, however, an increase in performance in one host species generally occurs at the expense of performance in others.
The simplest measure of host specificity is the number of host species exploited by a parasite (basic host specificity), but other aspects of the interaction can also be quantified, such as phylogenetic distinctiveness of host species (phylogenetic host specificity) and turnover of hosts used by a parasite in different localities (geographic host specificity) (Poulin and Mouillot 2003, Poulin et al. 2011). Recently, network theory has acquired great importance in ecology as an integrative approach to study ecological interactions in multi-species systems by focusing on the interactions rather than on the species (Proulx et al. 2005, Bascompte 2009) and it can be applied to studies on specialization (Blüthgen et al. 2007, Poulin 2010). One of the most important network proxies for specialization is modularity, which can be defined as the presence of cohesive subgroups of densely connected species in a network (i.e., modules) (Olesen et al. 2007, Mello et al. 2011). Generally, these modules are composed of phylogenetically close species or species that converge in traits that affect the interaction (Schleuning et al. 2014). Network analysis has been successfully used also to study parasitism and a highly modular structure is commonly found in parasitic networks (Fortuna et al. 2010, Bellay et al. 2011, Krasnov et al. 2012), which is probably related to the high intimacy of host-parasite interactions.
2007, Lacorte et al. 2013) and lead to the construction of large databases used in ecological and evolutionary studies (Fallon et al. 2005, Pérez-Tris et al. 2007, Hellgren et al. 2009, Svensson-Coelho et al. 2014).
In the present study we performed a thorough assessment of one tropical avian malaria system, using different approaches with the objective of understanding the relationship between specificity and performance. More specifically, we: (i) suggest a new index of prevalence, (ii) tested for a phylogenetic signal in parasitism, (iii) performed a network analysis for avian malaria together with the commonly used specificity indices, (iv) built a molecular phylogenetic tree of hosts to calculate phylogenetic specificity while previous studies used only taxonomic distance, and (v) tested the predictions of the trade-off and resource breadth hypotheses in a species rich environment. Despite those hypotheses leading to opposite predictions, after performing our study we reached the conclusion that they are not mutually exclusive. Therefore, (vi) we propose an integrative hypothesis aimed at explaining the emergence of different relationships between performance and specificity, which reconciles the contrasting results reported in the literature, as well as the logical basis supporting the trade-off and resource breadth hypotheses.
METHODS
Data collection and phylogenetic analysis
The parasite lineages and avian host species previously described by Lacorte et al. (2013), which were collected in 10 southeastern Brazilian sites, were used in our study. However, in order to quantify specificity with more accuracy, we used only lineages reported five times or more (28 out of 110). This procedure is important, since lineages observed only a few times appear only in a few host species, whether or not being intrinsically specialized, which could produce a spurious correlation between low prevalence and specialization.
COI, CytB, and ND2. Phylogenetic analyses using Bayesian inference were implemented in the program MrBayes v3.2.1 (Ronquist et al. 2012). For details on laboratory procedures and phylogenetic reconstructions see supplementary material, Appendix S1 and Table S1.
Specificity indices
The basic specificity of each parasite lineage was calculated as the number of host species in which it was found. For calculating phylogenetic host specificity we used a modified version of the 𝑆 index (Hellgren et al. 2009) in a phylogenetic context, and to measure geographic host specificity we applied the 𝛽 proposed by Krasnov et al. (2011). Formulas and details of specificity indices are described in appendix S2. We estimated geographic specificity only for lineages present in at least three localities, totaling 18 lineages that infect 55 host species.
Prevalence vs. Specificity
We measured three types of prevalence for each lineage: specific prevalence, maximum prevalence, and β-corrected prevalence. Specific and maximum prevalence are commonly calculated in specificity analyses and represent, respectively, the prevalence of a parasite lineage in all avian species infected by it and the maximum prevalence in any single host species infected by a parasite. β-corrected prevalence, however, is a new index that we have developed and represents the prevalence taking into account only the individuals of each avian species in the localities where that species is infected by the lineage. Assuming that geographic specificity is a natural property of parasites leads to the conclusion that a host species in one locality may not be a host in another, even if it was present in that locality. In that case, traditional measures of prevalence may not represent the effective prevalence of a parasite in its real hosts across its geographic distribution.
To test for associations between indices of prevalence and indices of specificity we performed generalized linear models (GLM’s) using quasibinomial distributions. We only calculated prevalence when the number of sampled individuals of host species was at least 10.
We tested whether host assemblages exploited by each parasite were composed of species that are phylogenetically closer than expected by chance. We used the Jaccard index (Jaccard 1912) to measure composition dissimilarity in the group of parasites infecting each avian species and tested for a correlation with a matrix of host phylogenetic distance with a Mantel test. Similarly, we tested for phylogenetic signal in host local assemblages, using the Jaccard index as a measure of dissimilarity in local occurrences. Mantel statistics were based on Spearman’s rank correlation rho and for each test we performed 1000 permutations.
Network Analysis
The data were organized as a binary adjacency matrix (presence/absence) for the network analysis. According to Krasnov et al. (2012), the properties of parasitic interactions make binary data more appropriate than weighted data for this kind of analysis.
To test for the existence of modules in the host-parasite network we used an optimization method based on simulated annealing (Guimerà and Nunes Amaral 2005) and calculated an index of modularity (M) (Newman and Girvan 2004). To estimate the significance of M we used a null model analysis based on bootstrapping with 1,000 randomizations from the “null model 2” of Bascompte et al. (2003), in which the probability of an interaction in a cell of the matrix is proportional to the marginal sums of columns and rows. To perform the modularity analysis we used the software Modular (Marquitti et al. 2013). We tested for phylogenetic and geographic signals in host module composition using Mantel tests with a matrix of pairwise values of dissimilarities in module identity (based on Jaccard index) and matrices of phylogenetic distance and dissimilarity in local occurrences, respectively.
RESULTS
Basic host specificity of malaria lineages varied from 1 to 11 host species. The number of local occurrences (geographic distribution) also varied largely in the parasite assemblage, from 1 to 7 localities. Among the analyzed lineages, only COSQU01 did not have its prevalence indices calculated, since its host species sampling was below 10 individuals. Specific prevalence varied from 0.04 (TARUF01) to 0.39 (VIOLI01), and maximum prevalence reached 0.6 (VIOLI01). As expected, β-corrected prevalence were always bigger than specific prevalence index. All indices for malaria lineages calculated in our analysis are presented in Table S2.
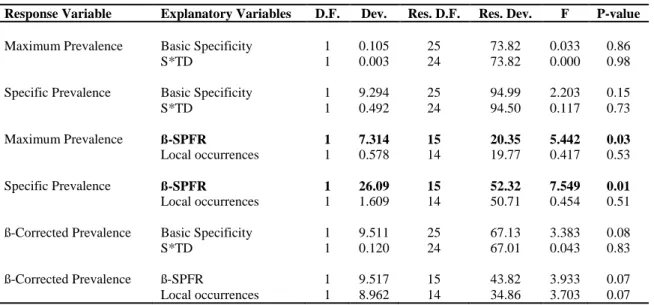
There was no correlation between any measure of prevalence and basic or phylogenetic specificity (Table 1). Although maximum and specific prevalence were inversely correlated with 𝛽 , this relationship did not hold in the model with β-corrected prevalence. The number of local occurrences had no influence in any prevalence index.
TABLE 1 – Results of GLM’s with prevalences and specificity indices. Each Response Variable in the table represents a model. For the significant variables, the values shown are those of the minimum model and for the non-significant variable, they are those of the maximum model. D.F.= Degrees of Freedom; Dev.= Deviance; Res. D.F.= Residual Degrees of Freedom; Res. Dev.= Residual Deviance.
Response Variable Explanatory Variables D.F. Dev. Res. D.F. Res. Dev. F P-value
Maximum Prevalence Basic Specificity 1 0.105 25 73.82 0.033 0.86 S*TD 1 0.003 24 73.82 0.000 0.98
Specific Prevalence Basic Specificity 1 9.294 25 94.99 2.203 0.15 S*TD 1 0.492 24 94.50 0.117 0.73
Maximum Prevalence ß-SPFR 1 7.314 15 20.35 5.442 0.03
Local occurrences 1 0.578 14 19.77 0.417 0.53
Specific Prevalence ß-SPFR 1 26.09 15 52.32 7.549 0.01
Local occurrences 1 1.609 14 50.71 0.454 0.51
ß-Corrected Prevalence Basic Specificity 1 9.511 25 67.13 3.383 0.08 S*TD 1 0.120 24 67.01 0.043 0.83
ß-Corrected Prevalence ß-SPFR 1 9.517 15 43.82 3.933 0.07 Local occurrences 1 8.962 14 34.86 3.703 0.07
phylogenetic distance among host species was correlated with the composition of hosts within the modules (Mantel statistic r = 0.13, P < 0.001) and of the assemblages exploited by each parasite lineage (Mantel statistic r = 0.11, P < 0.01). Nevertheless, there was no phylogenetic signal in local host assemblages (Mantel statistic r = 0.01, P = 0.38) or a geographic signal in the composition of host within the modules (Mantel statistic r = -0.01, P = 0.72).
Figure 1 – The host-parasite network with bird species (circles) and malaria lineages
(diamonds). Modules of the network are represented in gray tones and identified by letters (A
DISCUSSION
Our results point to no relationship between prevalence and basic or phylogenetic specificity, which contradicts predictions from both the trade-off (Poulin 1998) and the resource breadth hypotheses (Krasnov et al. 2004). One implicit assumption of the trade-off hypothesis is that eventually new adaptations that increase performance in one host will represent maladaptation to other hosts in the community. On the other hand, the implicit assumption of the resource breadth hypothesis is that those new adaptations increase performance in all hosts. We don’t see theoretical support to assume one or another hypothesis as a universal explanation for all cases. Krasnov et al. (2004), for example, suggested that the hypothesis that best explains each case depends on the phylogenetic structure of the studied community of hosts. In addition, the relationship between specialization and performance will be better explained by one or another hypothesis in different systems. We think that this explanation, despite being logically valid, can only be applied if the phylogenetic distance between hosts varies gradually, which is not the case in our system.
preferences, behavioral and immunological defenses, and chemical composition of blood (Thompson 1994). The biological dendrogram will be very similar to the phylogenetic tree of the group if there is strong phylogenetic conservatism in the evolution of the biological traits considered, though, in several cases convergence can unite phylogenetically distant species and separate phylogenetically close species.
Figure 2 – A new explanation for the conflicting results observed in the relationship
between performance and host range of parasites. (A) Dendrograms of hypothetical host
communities with: (i) low differences among hosts that change gradually in the community; (ii) high differences among hosts that change gradually in the community; (iii) a clustered structure in which the differences among hosts are low within each cluster and high between clusters. Dashed rectangles delimit clusters of close species. (B) Expected effects of host community structure and the difference among hosts on the relationship between performance and host range. The cases (i), (ii) and (iii) correspond to dendrograms in Figure 2a.
Several authors have argued that modularity usually emerges from a combination of shared phylogenetic history and trait convergence (Olesen et al. 2007, Krasnov et al. 2012, Schleuning et al. 2014). If this is true, modules should be composed of species that are closer to each other than to species of other modules, considering not only phylogenetic distance, but also all biological characters (either homologies and convergences) that affect the interaction, which is exactly the same as the host clusters presented in Figure 2a. Considering that the network was built based on connections that are effectively made in the system, we conclude that the network structure is the final outcome of the process of parasite specialization and that modularity results from trade-offs and breadth resource processes that occur simultaneously at different scales in the host community. This conclusion is, in a few words, what we are calling here as “The Integrative Hypothesis of Parasite Specialization”, which we explain in Box 1.
BOX 1: The Integrative Hypothesis of Parasite Specialization
Assumptions:
1) Specialization of parasites always involves trade-offs between performance in different hosts, and the trade-offs will be stronger the greater the dissimilarity of hosts from the parasites’ perspective.
2) Resource breadth processes always play a role in parasite specialization, but they are weaker the greater the dissimilarity of hosts from the parasites’ perspective. 3) In most host communities, host dissimilarity is not gradually structured. These
communities are commonly composed of clusters of similar organisms separated from other clusters by discontinuous differences.
Conclusion:
sides of the same coin and exert greater influence at different scales of the host community. As the dissimilarity among host species is much larger between than within clusters of host community, there is a discontinuity in the balance between trade-off and resource breadth processes. Instead of a gradual increase in the effect of trade-off and a gradual decline of resource breadth processes with the broadening of host range, there will probably be an abrupt change when the limits of these clusters are exceeded. Within these clusters resource breadth processes predominate and between clusters a trade-off is expected to be stronger.
A relationship between performance and cluster specialization (Figure 3) will emerge with the clusters as the main unity of specialization. Consequently, a parasite is considered specialized if it infects hosts of a single or a few clusters, while generalized parasites infect hosts of several clusters.
Based on this new theoretical perspective, we make novel predictions aimed at explaining the conflicting results reported in the literature.
Some predictions of The Integrative Hypothesis of Parasite Specialization:
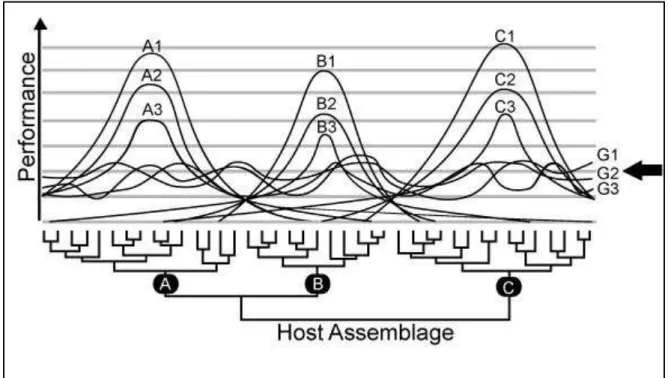
Figure 3 – Patterns of performance predicted by the Integrative Hypothesis of Parasite
Specialization, in which resource breadth processes are stronger within each cluster of
biologically close hosts and trade-offs are stronger between clusters. Curves represent the performance of each parasite lineage or species. A1, A2, and A3 are the parasites specialized in cluster A; the same goes for clusters B and C. G1, G2, and G3 are generalist parasites. Specialized parasites with high performance in a host species have also a high performance in all other hosts of the same cluster. However, this high performance in all host species of a cluster is related to a very low performance in hosts of other clusters. The most generalist parasites are able to infest hosts of all clusters, but have a low performance in each host.
Clusters of similar hosts from the parasites’ perspective are the main unit of specialization, and
host specificity is better measured in terms of how many clusters each parasite infects, instead of how many host species it infects. The arrow is a possible detection limit for those parasites. Parasites above this limit have a significant chance of being detected in the host population. Obviously, this limit is variable for each system and is influenced by sampling method and effort. Moreover, the randomness of sampling can result in parasites with low performance
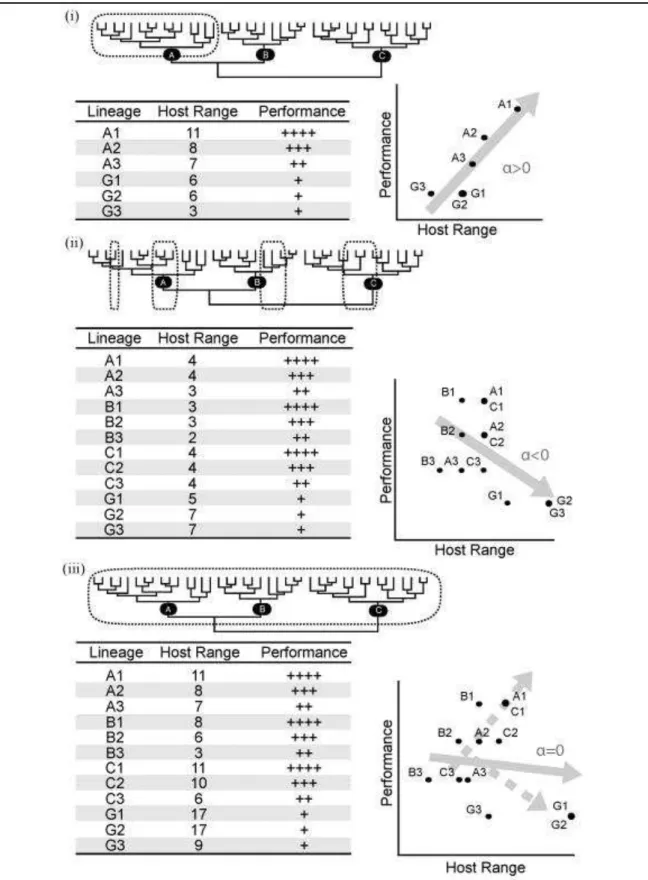
Figure 4 – Effect of sampling on the detection of different relationships between
performance and host range in a host-parasite system. Dendograms correspond to the host
between performance and host range when the sample is composed of (i) a cluster of related hosts, (ii) a few hosts of several clusters, and (iii) the whole host community.
When the host community is composed of clusters, the relationship between performance and specificity will be strongly influenced by sampling scale, and contrasting results are expected. We may expect three different results when comparing a study that samples a single group of closely related hosts, a second that samples few hosts of several clusters, and a third that samples several hosts of several clusters (Figure 4). We are not referring to the real host diversity, but to the subset of host species sampled. Once generalist parasites have poorer performance than specialists, they have a lower chance of being detected in all of their real hosts, either because of a sampling error in least sampled species or random fluctuations in local prevalence. This underestimation of host range leads to parasites with low prevalence being considered more specialized than they actually are, which masks the trade-offs involved in generalization. When a study samples a single cluster, this bias creates an artificial relationship between performance and host range (Figure 4b, case i). On the other hand, when a few hosts in each cluster are sampled, the host ranges of parasites that infect all hosts of a single cluster may be even more underestimated, because only a few of their hosts were sampled. In this case what is being masked is the effect of resource breadth processes acting within these clusters, and an artificial negative relationship between performance and host range may be observed (Figure 4b, case ii). When all clusters are well sampled, neither trade-off nor resource breadth processes are masked, and no correlation between performance and host range is observed (Figure 4b, case iii).
absent in Hellgren et al. (2009) (i.e., suborder Tyranni and the orders Columbiforme, Galbuliforme and Piciforme) explains the difference between our results, with our dataset comprising some of the most marked phylogenetic and ecological discontinuities in birds (Sick 1997). Furthermore, our samples were taken from one of the most biodiverse regions in the world and have a strong environmental discontinuity (i.e., they include birds that occur in three different vegetation types) (Lacorte et al. 2013), which probably results in an even higher diversity and a more clusterized structure in our host assemblage than expected by phylogeny alone. Szöllosi et al. (2011) presented a more extreme example of micro scale analysis by sampling host populations of a single species and, as expected, they also found a positive relationship between host range (number of host populations in which each lineage was found) and prevalence.
It is important to understand the effect of the processes explained by the Integrative Hypothesis of Parasite Specialization in the shaping of interaction networks. As we observed, the clusters of host community can be reflected in a modular network structure. This occurs because of the intensity of trade-offs in performance in hosts of different clusters, or in other words, modularity is a consequence of strong trade-offs between host clusters. Moreover, we think that resource breadth processes can also affect network structure by generating another common pattern described in the ecological network literature: nestedness. Modularity and nestedness have been traditionally seen as mutually exclusive (Bascompte et al. 2003), but recently they have been shown to represent two sides of the same coin (Fortuna et al. 2010). Similarly to trade-off and resource breadth processes in our hypothesis, these patterns can also occur at different scales of a network. Future studies should focus on understanding the relationship between specialization and network structure based on real world field data and not only on mathematical simulation.
parasite performance index, which is not biased by spatial host turnover and has the potential to reveal ecological and evolutionary patterns that are invisible to traditional measures of prevalence. This spatial component of specificity, in which local adaptations or local competition results in hosts of one parasite in one place not being hosts in other places, is an additional dimension of the specialization process, little studied yet. More studies are needed to provide a clearer understand of how this geographic facet of specialization influences what we are proposing here.
Therefore, we propose a unifying hypothesis about parasite performance and host specialization that integrates the Trade-Off and Breadth Resource hypotheses within a single more general framework, by taking into account the biological structure of the entire host community and the sample. The Integrative Hypothesis of Parasite Specialization can explain the contrasting results found in previous studies that tested the relationship between performance of parasites and host specificity, and it helps advance the debate further. Moreover, our hypothesis generates several testable predictions (Box 1) and we kindly invite the scientific community to put them to the test.
ACKNOWLEDGEMENTS
We thank José E.C. Figueira for his contribution to our study. This work was supported by the Graduate School in Ecology, Conservation, and Management of Wildlife of the Federal University of Minas Gerais (PPG-ECMVS/UFMG).
FUNDING
REFERENCES
Barger, M. A., and G. W. Esch. 2002. Host Specificity and the Distribution - Abundance Relationship in a Community of Parasites Infecting Fishes in Streams of North Carolina. Journal of Parasitology 88:446–453.
Bascompte, J. 2009. Disentangling the web of life. Science (New York, N.Y.) 325:416–9. Bascompte, J., P. Jordano, C. J. Melián, and J. M. Olesen. 2003. The nested assembly of
plant-animal mutualistic networks. Proceedings of the National Academy of Sciences of the United States of America 100:9383–7.
Bellay, S., D. P. Lima, R. M. Takemoto, and J. L. Luque. 2011. A host-endoparasite network of Neotropical marine fish: are there organizational patterns? Parasitology:1–8.
Blüthgen, N., F. Menzel, T. Hovestadt, B. Fiala, and N. Blüthgen. 2007. Specialization, constraints, and conflicting interests in mutualistic networks. Current biology : CB 17:341–6.
Brown, J. 1984. On the relationship between abundance and distribution of species. American naturalist 124:255–279.
CBRO - Comitê Brasileiro de Registros Ornitológicos. 2013. Lista das Aves do Brasil 10 Ed. www.cbro.com.br.
Fallon, S. M., E. Bermingham, and R. E. Ricklefs. 2005. Host specialization and geographic localization of avian malaria parasites: a regional analysis in the Lesser Antilles. The American naturalist 165:466–80.
Fortuna, M. a, D. B. Stouffer, J. M. Olesen, P. Jordano, D. Mouillot, B. R. Krasnov, R. Poulin, and J. Bascompte. 2010. Nestedness versus modularity in ecological networks: two sides of the same coin? The Journal of animal ecology 79:811–7.
Futuyma, D., and G. Moreno. 1988. The evolution of ecological specialization. Annual Review of Ecology and Systematics 19:207–233.
Guimerà, R., and L. A. Nunes Amaral. 2005. Functional cartography of complex metabolic networks. Nature 433:895–900.
Hellgren, O., J. Pérez-Tris, and S. Bensch. 2009. A jack-of-all-trades and still a master of some: prevalence and host range in avian malaria and related blood parasites. Ecology 90:2840– 9.
Jaccard, P. 1912. The distribution of the flora in the alpine zone. 1. New phytologist XI:37–50. Krasnov, B. R., M. a Fortuna, D. Mouillot, I. S. Khokhlova, G. I. Shenbrot, and R. Poulin. 2012.
Phylogenetic signal in module composition and species connectivity in compartmentalized host-parasite networks. The American naturalist 179:501–11.
Krasnov, B. R., R. Poulin, G. I. Shenbrot, D. Mouillot, and I. S. Khokhlova. 2004. Ectoparasitic
“jacks-of-all-trades”: relationship between abundance and host specificity in fleas (Siphonaptera) parasitic on small mammals. The American naturalist 164:506–16. Lacorte, G. A., G. M. F. Félix, R. R. B. Pinheiro, A. V Chaves, G. Almeida-Neto, F. S. Neves,
L. O. Leite, F. R. Santos, and E. M. Braga. 2013. Exploring the diversity and distribution of neotropical avian malaria parasites--a molecular survey from Southeast Brazil. PloS one 8:e57770.
Lapointe, D. A., C. T. Atkinson, and M. D. Samuel. 2012. Ecology and conservation biology of avian malaria. Annals of the New York Academy of Sciences 1249:211–26.
Marquitti, F. M. D., P. R. Guimaraes, M. M. Pires, and L. F. Bittencourt. 2013. MODULAR: Software for the Autonomous Computation of Modularity in Large Network Sets:1–10. Mello, M. A. R., F. M. D. Marquitti, P. R. Guimarães, E. K. V. Kalko, P. Jordano, and M. A. M.
de Aguiar. 2011. The modularity of seed dispersal: differences in structure and robustness between bat- and bird-fruit networks. Oecologia 167:131–40.
Morand, S., and J.-F. Guegan. 2000. Distribution and abundance of parasite nematodes: ecological specialisation, phylogenetic constraint or simply epidemiology? Oikos 88:563– 573.
Newman, M., and M. Girvan. 2004. Finding and evaluating community structure in networks. Physical Review E 69:026113.
Olesen, J. M., J. Bascompte, Y. L. Dupont, and P. Jordano. 2007. The modularity of pollination networks. Proceedings of the National Academy of Sciences of the United States of America 104:19891–6.
Outlaw, D. C., and R. E. Ricklefs. 2011. Rerooting the evolutionary tree of malaria parasites. Proceedings of the National Academy of Sciences of the United States of America 108:13183–7.
Pérez-Tris, J., O. Hellgren, A. Krizanauskiene, J. Waldenström, J. Secondi, C. Bonneaud, J. Fjeldså, D. Hasselquist, and S. Bensch. 2007. Within-host speciation of malaria parasites. PloS one 2:e235.
Poulin, R. 1998. Large-scale patterns of host use by parasites of freshwater fishes. Ecology Letters 1:118–128.
Poulin, R. 2010. Network analysis shining light on parasite ecology and diversity. Trends in parasitology 26:492–8.
Poulin, R., B. R. Krasnov, and D. Mouillot. 2011. Host specificity in phylogenetic and geographic space. Trends in parasitology 27:355–61.
Poulin, R., and D. Mouillot. 2003. Parasite specialization from a phylogenetic perspective: a new index of host specificity. Parasitology 126:473–480.
Proulx, S. R., D. E. L. Promislow, and P. C. Phillips. 2005. Network thinking in ecology and evolution. Trends in ecology & evolution 20:345–53.
phylogenetic inference and model choice across a large model space. Systematic biology 61:539–42.
Schleuning, M., L. Ingmann, R. Strauss, S. A. Fritz, B. Dalsgaard, D. Matthias Dehling, M. Plein, F. Saavedra, B. Sandel, J.-C. Svenning, K. Böhning-Gaese, and C. F. Dormann. 2014. Ecological, historical and evolutionary determinants of modularity in weighted seed-dispersal networks. Ecology letters 17:454–63.
Sick, H. 1997. Ornitologia Brasileira. Page 912. Second edition. Nova Fronteira, Rio de Janeiro, Brazil.
Svensson-Coelho, M., V. a. Ellis, B. a. Loiselle, J. G. Blake, and R. E. Ricklefs. 2014. Reciprocal Specialization in Multihost Malaria Parasite Communities of Birds: A Temperate-Tropical Comparison. The American Naturalist:000–000.
Szöllosi, E., M. Cichoń, M. Eens, D. Hasselquist, B. Kempenaers, S. Merino, J.-Å. Nilsson, B. Rosivall, S. Rytkönen, J. Török, M. J. Wood, and L. Z. Garamszegi. 2011. Determinants of distribution and prevalence of avian malaria in blue tit populations across Europe: separating host and parasite effects. Journal of evolutionary biology 24:2014–24.
Appendix S1 – Details on the method used for reconstructing the phylogeny of host
species.
Methods:
Tissue samples of some bird specimens were obtained from Center for Taxonomic Collections of Universidade Federal de Minas Gerais, Brazil (CCT-UFMG). We too used Genbank sequences for the most species analyzed. Genomic DNA was extracted from the blood, liver or pectoral muscle tissues of specimens. For DNA extraction from we used a modified phenol–chloroform–isoamilic alcohol protocol. DNA was stored at CCT-UFMG, and all new sequences were deposited in GenBank (supplementary material, Table S1).
To construct the phylogenetic hypotheses for the relationships of the taxa of interest, we used sequences of the three protein-coding mitochondrial genes Cytochrome Oxidase subunit 1 (COI), NADH Dehydrogenase subunit 2 (ND2) and Cytochrome B (CytB). We then conducted the analysis with partitioned output for three genes (COI, CytB and ND2) .
The PCR reactions were denatured for 1.5 min at 95 °C, followed by 35 thermal cycles of 95 °C denaturing for 1 min, annealing of 62°C for 1 min (COI), 50°C for 45 s (CytB), 60 °Cfor 40 s (ND2) and 72 °C extension for 1 min, and terminated with a 10 min extension at 20 °C.
The amplification products were purified by precipitation in PEG 8000 (20% polyethyleneglycol, 2.5 m NaCl) and finally dissolved in ultrapure water.
The purified PCR products were sequenced using the BigDye v3.1 terminator sequencing reaction mix following the manufacturer’s protocols (Applied Biosystems, USA), electrophoresed on an ABI3130xl sequencer. Sequencing products were purified using ammonium acetate and ethanol. Each gene region was bidirectionally sequenced to verify accuracy. Sequences were aligned and checked for quality and accuracy using SeqScape v2.6 to visualise and check manually all electropherograms.
Phylogenetic inference
The models for nucleotide substitutions used in the analyses were selected for each gene individually by applying the Akaike Information Criterion (AIC) (Akaike 1973) in the programme MrModeltest v2.3 (Nylander 2004) based on likelihood scores from PAUP* (Swofford 1998). Bayesian inference in MrBayes v3.2.1 (Ronquist et al. 2011) on the Cipres Science Portal (Miller et al. 2010) were used to estimate the phylogenetic relationships.
Bayesian analyses were performed for both the individual gene partitions and the partitioned combined data set using the best-fit model chosen according to the AIC. The posterior probabilities for model parameters, tree and branch lengths were approximated with a Metropolis-coupled Markov chain Monte Carlo (MCMC). All chains were run for two independent runs with 20 million generations each of four MCMCs each, with trees sampled every 1000th generation. The trees sampled during the 15% burn-in phase were discarded. Posterior parameter and tree distributions were examined with Tracer v1.5 (Rambaut and Drummond 2009) for convergence and adequate sampling.
Additional References:
Akaike,H. 1973. Information theory and an extension of the maximum likelihood principle. - In: Petrov., B. N. and Csaki, F. (eds), Proceedings of the Second International Symposium on Information Theory, Budapest. Akademiai Kiado, pp. 267-281.
Edgar, R. C. 2004. MUSCLE: multiple sequence alignment with high accuracy and high throughput. - Nucleic Acids Res. 32(5): 1792-97.
Miller, M. A., Pfeiffer, W. and Schwartz, T. 2010. Creating the CIPRES Science Gateway for Inference of Large Phylogenetic Trees. In: Proceedings of the Gateway Computer Environments Workshop, New Orleans, LA, pp. 1–8.
Nylander, J. A. A. 2004. MrModeltest v2. Program distributed by the author. - Evolutionary Biology Centre, Uppsala University.
Rambaut, A., Drummond, A. J. 2009. Tracer v1.5. - Available from http://beast.bio.ed.ac.uk/Tracer. Ronquist, F., Teslenko, van der Mark, P., Ayres, D. , Darling, A., Höhna, S., Larget, B., Liu, L., Suchard,
M. A. and Huelsenbeck, J. P. 2011. MrBayes 3.2: Efficient Bayesian phylogenetic inference and model choice across a large model space. - Syst. Biol. 61: 539-542.
Swofford, D. L. 1998. PAUP* Phylogenetic Analysis Using Parsimony (*and Other Methods).Version 4. - Sunderland, MA: Sinauer Associates.
Table S1 – GenBank numbers for all sequences used in this study.
Species Family CYTB ND2 COI
Claravis pretiosa Columbidae AF182682 FJ175691 this study Columbina squammata Columbidae AF182684 EF373330 EF373368
Nonnula rubecula Bucconidae this study this study Celeus flavescens Picidae DQ479263 JF433288
Dryocopus lineatus Picidae DQ479270 DQ479186 JQ174724 Polioptila plumbea Polioptilidae FJ176028 JQ175941 Hylophilus ochraceiceps* Vireonidae FJ899419 JQ445501
Vireo olivaceus Vireonidae JQ239201 AY136614 HM033940
Basileuterus culicivorus Parulidae GU189181 AF281022 FJ027222 Basileuterus flaveolus Parulidae AF382994 AF383110 JQ174157 Basileuterus hypoleucus Parulidae GU932371 GU932050 JN801518 Parula pitiayumi Parulidae AY216822 EU815768 FJ027956 Cantorchilus longirostris Troglodytidae DQ415681 JN802044 Pheugopedius genibarbis Troglodytidae DQ415682 this study Troglodytes musculus Troglodytidae DQ415711 AF104978
Turdus albicollis Turdidae EU154600 DQ911063 FJ028486 Turdus amaurochalinus Turdidae EU154602 DQ911065 FJ028498 Turdus leucomelas Turdidae DQ910957 JN049524 FJ028508 Turdus rufiventris Turdidae EU154672 JN049522 FJ028520 Coereba flaveola Coerebidae AY383089 AF383109 this study Euphonia violacea Fringillidae JN715453 JQ174822 Gnorimopsar chopi Icteridae AF089025 AF109941 JQ174951 Tiaris fuliginosus Emberizidae GU215360 EU648107 JN802046 Volatinia jacarina Emberizidae GU215364 FJ176144 FJ028563 Zonotrichia capensis Emberizidae FJ547285 FJ547326 FJ028606 Dacnis cayana Thraupidae GU215305 JN810456 JQ174638 Lanio melanops Thraupidae FJ799900 FJ799867 FJ028450 Lanio pileatus Thraupidae FJ799870 FJ799836 JN801603 Nemosia pileata Thraupidae AF006241 JN810480 JN801861
Thamnophilus ambiguus Thamnophilidae EU295809 EU295781
Thamnophilus caerulescens Thamnophilidae AY962685 EF030294 FJ028410 Dendrocolaptes platyrostris Dendrocolaptidae AY442990 JF975349 FJ027494 Sittasomus griseicapillus Dendrocolaptidae GU215198 JQ445785 FJ028292 Anabazenops fuscus Furnariidae this study JF975308
Philydor rufum Furnariidae JF975306
Appendix S2 - Formula and details of specificity indices.
The basic specificity of each parasite lineage was calculated as the number of host species in which it was found. For calculating phylogenetic host specificity we used the
𝑆 index (Clarke and Warwick 1998, Poulin and Mouillot 2003, Poulin et al. 2011).
𝑆 is commonly used as a measure of taxonomic distinctness between the hosts of a parasite, but it can be also used in a full phylogenetic context, by replacing taxonomic classification with a phylogenetic tree with known branch lengths (Poulin and Mouillot 2003). In that case, the more general form of the index must be used (see Clarke & Warwick 2001):
S
D=
∑∑≠ −1ω(1)
where 𝜔 is the phylogenetic distance between hosts (i.e., the lengths of the branches connecting each pair of them in the tree) and 𝑠 is the number of host species of a parasite. However, the 𝑆 index does not reflect the number of host species and can generate results in which parasites with only two hosts has a higher 𝑆 value than parasites with several hosts with the same maximum phylogenetic distance. Here, we used a modified version of 𝑆 that includes the number of host species and the variance of phylogenetic distance (see Hellgren et al. 2009):
S
∗D
= S
D+
1+V −1TD(2)
(see Clarke & Warwick 2001):
VarS
D=
∑∑≠ (ω − TD)2
−1
(3)
where the variables are the same as in equation (1). We computed this index using the packages “vegan” (Oksanen et al. 2013) and “ape” (Paradis et al. 2004) for R (R Core Team 2012). The 𝑆∗ of lineages infecting only one host was considered 0, once it represents the highest possible phylogenetic specificity of a parasite in our study.
different species in another site, while nestedness represents the elimination (or addition) of species in only one of the sites. To estimate geographic host specificity (𝛽 ) we measured the spatial turnover of hosts by malaria linages using the 𝛽𝐼 index (Krasnov et al. 2011, Poulin et al. 2011). This index is based on the Simpson dissimilarity index (Simpson 1943, Baselga 2010):
β
IM=
[∑ − [∑< ( , )]T]+ [∑< ( , )]
(4)
where S is the number or species in site i, S is the number of species in all sites, b is the number of species occurring only in site I, and b is the species occurring only in site j, when compared by pairs. The metrics proposed by Baselga (2010), however, are influenced by the number of sites, and to compare the values obtained for lineages occurring in different number of sites it is necessary the use of resampling procedures. In this study, we took 1,000 random samples of three host spectra and computed the average 𝛽 for each lineage.
Krasnov et al. (2011) alerted that 𝛽 might be not only an intrinsic property of a parasite, but may reflect differences in host composition between sites. To test this relationship, we estimated the spatial turnover of all host species infected by lineages of malaria (𝛽𝐼 ) and calculated a linear regression, with 𝛽 as the response variable. Deviations from the regression line (𝛽 ) between these metrics represent turnover either higher or lower than expected by differences in host composition between sites.
𝛽 is an index that reflects intrinsic properties of the parasites, free from effects of host community variation (Krasnov et al. 2011), and was adopted as a measure of geographic host specificity in our study. To perform this analysis we used the package “betapart” for R (Baselga et al. 2013). We estimated geographic specificity only for lineages present in at least three localities, totaling 18 lineages that infect 55 host species.
References:
Baselga, A. 2010. Partitioning the turnover and nestedness components of beta diversity. Global Ecology and Biogeography 19:134–143.
Clarke, K. R., and R. M. Warwick. 1998. A taxonomic distinctness index and its statistical properties. Journal of Applied Ecology 35:523–531.
Clarke, K., and R. Warwick. 2001. A further biodiversity index applicable to species lists: variation in taxonomic distinctness. Marine Ecology Progress Series 216:265–278.
Hellgren, O., J. Pérez-Tris, and S. Bensch. 2009. A jack-of-all-trades and still a master of some: prevalence and host range in avian malaria and related blood parasites. Ecology 90:2840– 9.
Krasnov, B. R., D. Mouillot, G. I. Shenbrot, I. S. Khokhlova, and R. Poulin. 2011. Beta-specificity: the turnover of host species in space and another way to measure host specificity. International journal for parasitology 41:33–41.
Oksanen, J., F. G. Blanchet, R. Kindt, P. Legendre, P. R. Minchin, R. B. O’Hara, G. L. Simpson, P. Solymos, M. H. H. Stevens, and H. Wagner. 2013. vegan: Community Ecology Package.
Paradis, E., J. Claude, and K. Strimmer. 2004. APE: analyses of phylogenetics and evolution in R language. Bioinformatics 20:289–290.
Poulin, R., B. R. Krasnov, and D. Mouillot. 2011. Host specificity in phylogenetic and geographic space. Trends in parasitology 27:355–61.
Poulin, R., and D. Mouillot. 2003. Parasite specialization from a phylogenetic perspective: a new index of host specificity. Parasitology 126:473–480.
R Core Team. 2012. R: A language and environment for statistical computing. R Foundation for Statistical Computing, Vienna, Austria.
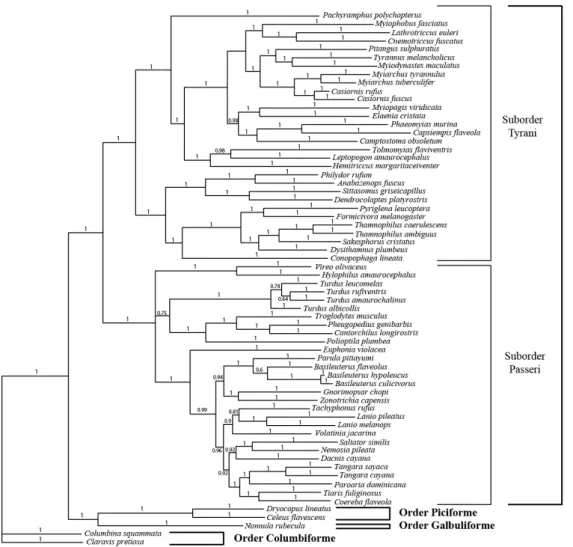
Figure S1 – Host species phylogeny used with orders and suborders of Passeriforme.
Table S2 – Lineages and bird species names with labels to the network (Figure 1)
Lineages Bird Species Bird Species
1 BAFLA03 29 Anabazenops fuscus 61 Myiopagis viridicata 2 BAFLA04 30 Basileuterus culicivorus 62 Myiophobus fasciatus 3 BAHYP01 31 Basileuterus flaveolus 63 Nemosia pileata 4 CAOBS01 32 Basileuterus hypoleucus 64 Nonnula rubecula
5 CARUF01 33 Camptostoma obsoletum 65 Pachyramphus polychopterus 6 COLIN01 34 Cantorchilus longirostris 66 Paroaria dominicana
7 COLIN05 35 Capsiempis flaveola 67 Parula pitiayumi 8 COLIN11 36 Casiornis fuscus 68 Phaeomyias murina 9 COPIL01 37 Casiornis rufus 69 Pheugopedius genibarbis 10 COSQU01 38 Celeus flavescens 70 Philydor rufum
11 DENPET03 39 Claravis pretiosa 71 Pitangus sulphuratus 12 ELALB01 40 Cnemotriccus fuscatus 72 Polioptila plumbea 13 LEAMA01 41 Coereba flaveola 73 Pyriglena leucoptera 14 MYITYR01 42 Columbina squammata 74 Sakesphorus cristatus 15 PACPEC02 43 Conopophaga lineata 75 Saltator similis 16
17
PADOM09 44 Dacnis cayana 76 Sittasomus griseicapillus PADOM11 45 Dendrocolaptes platyrostris 77 Tachyphonus rufus 18 PYLEU01 46 Dryocopus lineatus 78 Tangara cayana 19 TARUF01 47 Dysithamnus plumbeus 79 Tangara sayaca
20 THAMB01 48 Elaenia cristata 80 Thamnophilus ambiguus 21 THAMB02 49 Euphonia violacea 81 Thamnophilus caerulescens 22 THCAE01 50 Formicivora melanogaster 82 Tiaris fuliginosus
23 TOFLA01 51 Gnorimopsar chopi 83 Tolmomyias flaviventris 24 TRMEL02 52 Hemitriccus margaritaceiventer 84 Troglodytes musculus 25 TUAMA01 53 Hylophilus amaurocephalus 85 Turdus albicollis 26 TULEU01 54 Lanio melanops 86 Turdus amaurochalinus 27 TUMIG03 55 Lanio pileatus 87 Turdus leucomelas 28 VIOLI01 56 Lathrotriccus euleri 88 Turdus rufiventris
57 Leptopogon amaurocephalus 89 Tyrannus melancholicus 58 Myiarchus tuberculifer 90 Vireo olivaceus
Table S3 – Specificity and prevalence indices for each malaria lineage. Basic: Basic Specificity; Sprev: Specific Prevalence; Maxprev: Maximum Prevalence; ßprev: ß-Corrected Prevalence; Occur: Local Ocurrences.
Lineage Basic S*TD ß-SPFR Sprev Maxprev ßprev Occur
BAFLA03 10 9.17 0.165 0.085 0.125 0.159 6
BAFLA04 3 2.23 NA 0.051 0.034 0.172 2
BAHYP01 3 2.22 NA 0.114 0.130 0.385 2
CAOBS01 3 2.24 -0.077 0.250 0.083 0.385 3
CARUF01 2 1.18 NA 0.240 0.455 0.600 2
COLIN01 1 0.00 NA 0.130 0.130 0.162 2
COLIN05 7 6.20 -0.013 0.120 0.217 0.260 5
COLIN11 1 0.00 NA 0.109 0.109 0.172 1
COPIL01 4 3.21 0.266 0.200 0.200 0.389 3
COSQU01 2 1.09 0.182 NA NA NA 4
DENPET03 10 9.19 0.174 0.077 0.091 0.224 7
ELALB01 7 6.16 0.155 0.173 0.118 0.452 4
LEAMA01 2 1.17 0.190 0.126 0.220 0.407 3
MYITYR01 3 2.04 -0.134 0.268 0.294 0.579 3
PACPEC02 2 1.23 NA 0.316 0.313 0.545 1
PADOM09 11 10.19 0.200 0.159 0.259 0.284 7
PADOM11 7 6.21 0.606 0.058 0.150 0.238 5
PYLEU01 2 1.22 -0.425 0.326 0.636 0.375 5
TARUF01 4 3.20 0.063 0.041 0.050 0.156 3
THAMB01 1 0.00 NA 0.083 0.083 0.500 1
THAMB02 1 0.00 -0.645 0.306 0.306 0.595 3
THCAE01 3 2.15 NA 0.070 0.250 0.206 2
TOFLA01 2 1.20 -0.164 0.211 0.282 0.400 4
TRMEL02 4 3.22 NA 0.125 0.100 0.200 2
TUAMA01 3 2.10 -0.091 0.071 0.105 0.171 5
TULEU01 4 3.13 -0.287 0.078 0.216 0.190 5
TUMIG03 1 0.00 -0.164 0.158 0.158 0.250 3