A R C H I V E S
o f
F O U N D R Y E N G I N E E R I N G
Published quarterly as the organ of the Foundry Commission of the Polish Academy of Sciences
ISSN (1897-3310)
Volume 7
Issue 3/2007
237 – 240
44/3
A R C H I V E S o f F O U N D R Y E N G I N E E R I N G V o l u m e 7 , I s s u e 3 / 2 0 0 7 , 2 3 7 - 2 4 0 237
Determination of Reliability Index
and Weibull Modulus as a Measure
of Hypereutectic Silumins Survival
J. Szymszal
a,*, J. Piątkowski
a, J. Przondziono
a aChair of Metal Alloys and Composites Engineering, Silesian University of Technology,
Krasinskiego 8 Str., 40-019 Katowice, Poland
*e-mail: [email protected]
Received on 24.04.2007; Approved for printing on: 27.04.2007
Abstract
The first part of the study describes the methods used to determine Weibull modulus and the related reliability index of hypereutectic silumins containing about 17% Si, assigned for manufacture of high-duty castings to be used in automotive applications and aviation. The second part of the study discusses the importance of chemical composition, including the additions of 3% Cu, 1,5% Ni and 1,5% Mg, while in the third part attention was focussed on the effect of process history, including mould type (sand or metal) as well as the inoculation process and heat treatment (solutioning and ageing) applied to the cast AlSi17Cu3Mg1,5Ni1,5 alloy, on the run of Weibull distribution function and reliability index calculated for the tensile strength Rm of the investigated alloys.
Keywords: Casting quality management, Reliability, Weibull modulus, Hypereutectic silumins, Mechanical properties
1. Introduction
Cast alloys used for high-duty parts operating in automotive industry and aviation should, besides excellent mechanical properties, offer also stable and failure-free performance. A good measure of the reliability of a selected examined property, e.g. the tensile strength Rm, is estimation of the value of Weibull modulus, closely related with the, so called, part’s survival probability [1].
The effect of chemical composition and process history applied in manufacture of the Al-Si-Me alloys with Cu, Ni and Mg was traced using Weibull distribution function, the values of this distribution, and the values of the, so called, reliability index. The analysis of the technological process history included type of foundry mould and processes of modification and heat treatment. An additional argument for undertaking the investigation was the lack (so far) of a domestic counterpart of these alloys, widely used in West European countries and USA for, among others, cast pistons and cylinder heads operating in I.C. engines. Using the results of own investigations carried out on a wide scale [2], it has
been concluded that a counterpart of the above mentioned alloys can be the silumin containing about 17% Si, with additions of 3% Cu, 1,5% Ni and 1,5% Mg. In this context, of particular significance are the methods determining the admissible risk of failure (the survival probability) of parts put in service. In modern techniques of testing parts for their mechanical resistance, it is the statistical analysis that plays the role of a tool effectively aiding the tests and determining the range of application of structural materials for operation under high-duty conditions. Quite important is also careful analysis of the individual stages of alloy fabrication.
2. Methods of investigation
In statistical analysis, the calculation sheet of Excel v. 2000 made by Microsoft and programs: Statistica v. 7.1 PL offered by StatSoft and MedCalc v. 9.1.0.1 were used.
Detailed information on the measurement of the tensile strength Rm of a modified Al-Si-Cu-Mg-Ni alloy cast in sand
A R C H I V E S o f F O U N D R Y E N G I N E E R I N G V o l u m e 7 , I s s u e 3 / 2 0 0 7 , 2 3 7 - 2 4 0 238
Fig.1. The results of the tensile strength Rm measurement taken on
a modified Al-Si-Cu-Mg-Ni alloy cast in sand moulds
For the first stage of statistical analysis, the parameters of descriptive statistics shown in Figure 2 were selected.
Fig.2. Basic parameters of descriptive statistics used for the data from Figure 1
The determination of some parameters shown in Figure 2 (e.g. confidence interval for the mean) makes sense only when a close-to-normal distribution of the variable is obtained [3]. To know this, it is necessary to check the null hypothesis H0, assuming that the distribution of the examined variable is consistent with the normal one, which can be done using, e.g. Kolmogorov-Smirnov consistency test or Shapiro-Wilk test.
The confidence interval calculated for the results of Rm from the lower limit equal to about 194,35 to 196,42 [MPa] is an important factor showing the alloy reliability in respect of this parameter, since the interval covers the true mean value of Rm
with the assumed probability equal to 0,95.
The determined values of the lower quartile (also known as 25% quartile) and upper quartile (also known as 75% quartile) belong to the positional measures of location, while the respective values denote that 25% Rm values are below 193 [MPa] and, at the same time, 75% Rm are above 198,5 [MPa]. So, a half (50% - 26 results) of the obtained Rm values are comprised within the range
of 5,5 [MPa], which forms the, so called, quartile range (Fig.1). At the second stage of the statistical analysis of the life of the examined alloy, the obtained values of Rm were divided into 13 classes. For this purpose, having arranged the values in an increasing order, the size of the class interval wp was determined using the following equation:
(1)
For the examined alloy this value amounted to about 1,33 [MPa]. Next, for each of the obtained values of Rm a cumulative percentage of samples that exceeded the adopted threshold limit was determined using the following equation:
(2)
where: ns – is the cumulative size of sample in which the value of the examined property has exceeded the adopted threshold limit. Then, the sigma0 value for which 37% of the samples have exceeded this value in respect of Rm was determined (Fig. 3)
After determination of the upper interval limits, where as an upper limit of the first interval the value minRm, was adopted and
each of the remaining intervals was open from the lower limit and closed from the upper one, the number of samples (the, so called, frequency) belonging to the described intervals nk was determined, using Excel table function CZĘSTOŚĆ() Y - FREQUENCY (Fig. 3).
Fig.3. Determination of values necessary for the estimation of Weibull modulus
For the estimation of Weibull modulus m the authors used the function allowing for a relationship between the “survival” probability p (i.e. the cumulative probability that the examined property will exceed the adopted threshold limit, counted from its maximum value), the selected property of material (e.g. σ (sigma) – that is Rm) and modulus m, given by M. Ashby and D. Jons [2]:
(3)
where: sigma0 (σ0) is the value for which 37% of samples exceed
this value in respect of the examined property.
Function (3) was reduced to its linear form by double two-sided logarithmic operation done with a natural logarithm. As a result of this operation, a function model in the form y= a·x: was obtained (Fig.3)
(4)
Rm [MPa] Al-Si-Cu-Mg-Ni alloy Specim en
no.
Sand m ould + m odification
Specim en no.
Sand m ould + m odification
1 187 27 201
2 191 28 195
3 189 29 201
4 193 30 203
5 191 31 193
6 189 32 197
7 189 33 199
8 190 34 196
9 195 35 196
10 194 36 199
11 191 37 198
12 195 38 199
13 193 39 199
14 196 40 199
15 190 41 199
16 191 42 199
17 195 43 198
18 197 44 194
19 194 45 195
20 192 46 202
21 193 47 195
22 192 48 196
23 196 49 198
24 197 50 199
25 196 51 200
26 197 52 197
Al-Si-Cu-Mg-Ni alloy
Interval size (wp) Sigma
Frequency (nk)
Cumulative
(nks) 52-nks Pi 1/Pi ln(1/p) ln(ln(1/p)) Sigma/Sigma0 ln(Sigma/Sigma0)
1,33 187,00 1 1 51 0,9808 1,020 0,019 -3,9416 0,9492 -0,0521
Sigma0 188,33 0 1 51 0,9808 1,020 0,019 -3,9416 0,9560 -0,0450
197 189,67 3 4 48 0,9231 1,083 0,080 -2,5252 0,9628 -0,0379
191,00 6 10 42 0,8077 1,238 0,214 -1,5438 0,9695 -0,0309
192,33 2 12 40 0,7692 1,300 0,262 -1,3380 0,9763 -0,0240
193,67 4 16 36 0,6923 1,444 0,368 -1,0004 0,9831 -0,0171
195,00 9 25 27 0,5192 1,926 0,655 -0,4225 0,9898 -0,0102
196,33 6 31 21 0,4038 2,476 0,907 -0,0979 0,9966 -0,0034
197,67 5 36 16 0,3077 3,250 1,179 0,1644 1,0034 0,0034
199,00 11 47 5 0,0962 10,400 2,342 0,8509 1,0102 0,0101
200,33 1 48 4 0,0769 13,000 2,565 0,9419 1,0169 0,0168
201,67 2 50 2 0,0385 26,000 3,258 1,1811 1,0237 0,0234
203,00 2 52
Razem 52 y variable x variable
=CZĘSTOŚĆ(E3:E54;H3:H15) =I4+J3 =52-J4
=K3/$I$16 =1/L3 =LN(M3)
=LN(N3) =H3/$G$5 =H3/$G$5
PARAMETER VALUE
N 52
Mean 195,38
Confidence -95% 194,349 Confidence +95% 196,421
Median 196
Minimum 187
Maximum 203
Quartile 25% 193 Quartile 75% 198,5
Range 16
Quartile range 5,5 Variance 13,849 Standard deviation 3,721 Standard Error of Main 0,516 Skewness -0,207 Kurtosis -0,568
max( ) min( )
12
m m
p
R R
w = −
52
% 100%
52
s
n próbek= − ⋅
0 exp
m
p σ
σ
= −
0 1
ln ln mln
p
σ σ =
A R C H I V E S o f F O U N D R Y E N G I N E E R I N G V o l u m e 7 , I s s u e 3 / 2 0 0 7 , 2 3 7 - 2 4 0 239 Using the obtained empirical pairs of values (xi; yi) (Fig.3),
parameters of the model of linear function of the type y= a·x: were estimated. For this purpose an Excel Narzędzie - Tool from the packet of tools Analiza Danych - Data Analysis called
Regresja - Regression was used [4]. To estimate the coefficients of the function of regression, the Tool uses a method of optimisation based on minimalisation of the sum of least squares (SLS) of the deviations of empirical points from a model curve. The results of the estimation of the coefficient a of the function of regression, which at the same time is the searched value of Weibull modulus for the examined cast alloy, are shown in Fig. 4.
Fig.4. Determination of Weibull modulus value (m) for the examined alloy (sigma0=197)
The obtained model of the searched function of regression for the examined alloy is as follows:
(5)
A graphic representation of the model obtained in double logarithmic system is shown in Figure 9.
Fig.5. Graphic representation of a model of the survival function plotted in double logarithmic system
Table 1 shows the effect of chemical composition of the examined cast Al-Si17 alloys after modification and casting into metal mould on the values of Weibull modulus m determined for the tensile strength.
The results of the investigations indicated that the highest value of Weibull modulus m had Al-Si-Cu-Mg-Ni alloys. Therefore these alloys were subjected to further examinations to estimate the effect of process history on their properties.
Table 1.
Effect of the chemical composition of cast Al-Si17 alloys after modification and casting into metal mould on the values of Weibull distribution m determined for Rm
To interrelate the estimated values of Weibull modulus with very important (for the structural materials) values of the statistical descriptive characteristics belonging to a group of the variability measures, several indeces were proposed interrelating the estimated value m with: the value of standard deviation s –
Wsk1, the value of variability index Vz – Wsk2 and the assumed value of Rm and Vz – Wsk3:
(6,7,8)
Each of the indices should have the highest value possible and as such can serve as a criterion in the choice of material best matching the assumed operating conditions. Table 2 shows the effect of process history during manufacture of the examined cast alloys on the value of Weibull modulus m and on the values of the indices: Wsk1, Wsk2 and Wsk3 enabling the choice of best material for the specific operating conditions. It has been observed that the highest values of Weibull modulus and of the calculated indices had the samples of the modified Al-Si-Cu-Mg-Ni alloy cast into metal mould and subjected to heat treatment, which decided this alloy was selected for further investigations of the thermal fatigue behaviour and was proposed as a material for industrial applications.
Table 2.
Effect of process history during manufacture of cast Al-Si-Cu-Mg-Ni alloys on the values of Weibull modulus m determined for the tensile strength Rm
3. Summary and conclusions
Analysing the obtained results in terms of their practical applicability, the following example is given for consideration. It is demanded that, besides many other requrements imposed on an alloy assigned for constructional purposes, like modest price, low density, etc., it should also have the tensile strength of minimum 150 MPa. In this study, attention has mainly been focussed on the processes and not on the requirements demanded by the
Analysis of regression and correlation
Linear model y=ax : ( ln(ln(1/p ))=ln(Sigma/Sigma0)*m ) Regression statistics
Multiple 0,9756
R square 0,9517
Sdjusted R square 0,8608 Standard error 0,3890
Observations 12
Coefficients Standard error t Stat p
Moduł Weibulla (m ): 69,8362 4,08756 17,085 0,0000 Lower 95% Upper 95%
60,83958 78,83288
1
ln ln 69,84 ln
197
p
σ =
-4,0
-3,0
-2,0
-1,0
0,0
1,0
2,0
-0,06 -0,05 -0,04 -0,03 -0,02 -0,01 0,00 0,01 0,02 0,03
ln(Sigma/Sigma0)
ln
(ln
(1
/p
))
Rm Metal mould + modification
[MPa] AlSi AlSiCu AlSiCuNi AlSiCuMg AlSiCuMgNi
Mean 147,79 165,98 166,69 175,21 215,92 Weibull modulus 42,86 74,75 67,48 71,54 82,58
Sigma0 149 167 168 176 217,8
SD 4,031 3,777 2,832 3,103 3,044 Variability index 0,0273 0,0228 0,0170 0,0177 0,0141
W sk1 10,63 19,79 23,83 23,06 27,13
W sk2 15,714 32,849 39,718 40,395 58,576
Assumed W sk3 W sk3 W sk3 W sk3 W sk3
200 -5,55 -6,73 -7,94 -5,72 4,32
1 m
Wsk s
= 3
100
z
x W m Wsk
s
−
= ⋅
1 2
100 z
m Wsk
V = ⋅
AlSiCuMgNi AlSiCuMgNi AlSiCuMgNi AlSiCuMgNi AlSiCuMgNi AlSiCuMgNi AlSiCuMgNi AlSiCuMgNi
AlSiCuMgNi - alloy Modification
Rm Modification Heat treatment Heat treatment
[MPa] Sand m ould Metal m ould Sand m ould Metal m ould Sand m ould Metal m ould Sand m ould Metal m ould
Mean 16,38 188,33 195,38 215,92 192,5 207,57 221,75 235,26
Weibull modulus 59,71 68,03 69,83 82,58 67,84 70,78 105,79 116,22
Sigma0 178 190 197 217,8 193 209 222 236
SD 3,75 3,179 3,785 3,044 3,846 4,153 2,847 2,565
Variability index 0,2289 0,0169 0,0194 0,0141 0,0200 0,0200 0,0128 0,0109
Wsk1 15,92 21,40 18,45 27,13 17,64 17,04 37,16 45,31
Wsk2 2,608 40,302 36,046 58,576 33,955 35,376 82,399 106,596
Assumed Wsk3 Wsk3 Wsk3 Wsk3 Wsk3 Wsk3 Wsk3 Wsk3
A R C H I V E S o f F O U N D R Y E N G I N E E R I N G V o l u m e 7 , I s s u e 3 / 2 0 0 7 , 2 3 7 - 2 4 0 240
specifications, although equation (8) allows us to consider an assumed value of the examined property (e.g. in Tables 2 and 3 the value of the tensile strength Rm equal to 200 MPa has been
adopted).
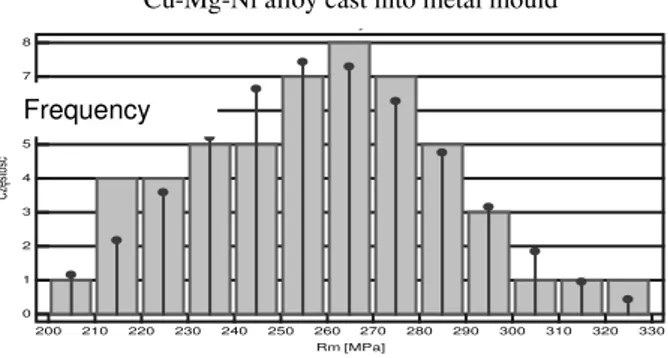
The modified Al-Si-Cu-Mg-Ni alloy cast into metal moulds, whose Rm histogram is shown in Figure 8, was compared with a
structural material called "Reference Material” - whose histogram Rm is shown in Figure 9.
Fig. 8. Histogram of the tensile strength Rm of the modified
Al-Si-Cu-Mg-Ni alloy cast into metal mould
Fig. 9. Histogram of the tensile strength Rm of the reference
material
In both cases, i.e. in the case of silumin and reference material, using Shapiro-Wilk test it has been stated that the distribution of the tensile strength Rm was not straying from the
normal distribution (p=0,1466 and p=0,7082, respectively). Figure 10 shows plotted diagrams of the survival abilities of the silumin and reference material.
Fig. 10. Plotted diagrams of the Rm survival abilities of the
silumin and reference material
From data presented in Figure 15 it follows that both alloys satisfy the requirements imposed by the specification; there are no values of Rm lower than 150 MPa. For silumin the survival ability
index (Cpk) has a value equal to 9,22, for a reference material this
value amounts to 6,45. Both these values are larger than the unity, and as such do not allow rejecting one of the alloys on account of the insufficient value of Cpk. So, other parameters should be taken
into consideration. The reference material has an average Rm
value of about 259 [MPa], while silumin offers the value of about 216 [MPa], which means that it is much lower (Table 3).
Table 3.
Reliability indices of silumin and reference material
The reference material may be worth paying some attention since the prevailing percent share of samples made from it (about 87%) have the value of Rm higher than the samples cast from
silumin characterised by maximum strength. On the other hand, compared with reference material, silumin offers smaller scatter of results. In quality analysis, it is the non-refutable principle that the narrower is the distribution range, the better is the material, because the most natural and fundamental index of process ability is the probability of manufacturing an element which will not be capable of satisfying the specification. The greater is this probability, the less reliable is the process. In this way one can reach a relationship between the material reliability and its ability of survival. If the reliability cannot be ensured, the estimation of the ability of survival will be of little value. This is illustrated by the estimated values of Weibull modulus and by the indices proposed by the authors and calculated from this modulus. The value of Weibull modulus allowing for the probability of survival of the examined alloys in respect of Rm is for the reference material about eight times smaller that it is for the silumin. On the other hand, the index interrelating Weibull modulus with the assumed value of the examined property and with the variability index (wsk3 - equation 8) is for the silumin almost 40 times higher that it is for the reference material.
The results reported in this article are based on a Research Project 3 T08 B 014 27 financed from the resources of KBN Polish Committee of Scientific Research
4. References
[1] Ashby M. F., Dawid R. H. Jones H.: The Engineering Materials. Part 2. WNT, Warszawa, 1996.
[2] Gierek A., Piątkowski J., Szymszal J.: Effect of technological process on failure-free performance of AlSi17Cu3Mg alloy as a structural material. Arch. Odlewnictwa, nr1, (2/2 ), 2001.
[3] Maliński M., Szymszal J.: Modern mathematical statistics in calculation sheets for medical applications. Wyd. Śląskiej Akademii Medycznej, Katowice, 1999.
200 210 220 230 240 250 260 270 280 290 300 310 320 330
30
25
20
15
10
5
0
Rm [MPa]
Często
ść
206 208 210 212 214 216 218 220 222 224 226 14
12
10 8
6 4
2 0
Rm [MPa]
Często
ść
o y o
200 210 220 230 240 250 260 270 280 290 300 310 320 330 8
7
6
5
4
3
2
1
0
Rm [MPa]
Często
ść
Frequency
Rm AlSiCuMgNi alloy + m odification Reference material
[MPa] M e tal m ould
Mean 215,92 258,60
Weibull modulus 82,58 11,77
Sigma0 217,8 272.3
SD 3,044 27,561
Variability index 0,0141 0,1066
W sk1 27,13 0,43
W sk2 58,576 1,104
Assumed Wsk3 Wsk3