Differences in Reactivation of Tuberculosis
Induced from Anti-TNF Treatments Are Based
on Bioavailability in Granulomatous Tissue
Simeone Marino
1, Dhruv Sud
1,2, Hillarie Plessner
3, Philana Ling Lin
4, John Chan
5,6,7, JoAnne L. Flynn
3,
Denise E. Kirschner
1,2*1Department of Microbiology and Immunology, University of Michigan Medical School, Ann Arbor, Michigan, United States of America,2Department of Biomedical Engineering, College of Engineering, University of Michigan, Ann Arbor, Michigan, United States of America,3Department of Molecular Genetics and Biochemistry, University of Pittsburgh School of Medicine, Pittsburgh, Pennsylvania, United States of America,4Department of Pediatrics, Division of Pediatric Infectious Disease, Children’s Hospital of Pittsburgh, Pittsburgh, Pennsylvania, United States of America,5Department of Medicine, Albert Einstein College of Medicine, New York, New York, United States of America,6Department of Microbiology, Albert Einstein College of Medicine, New York, New York, United States of America,7Department of Immunology, Albert Einstein College of Medicine, New York, New York, United States of America
The immune response to
Mycobacterium tuberculosis
(Mtb) infection is complex. Experimental evidence has revealed
that tumor necrosis factor (TNF) plays a major role in host defense against Mtb in both active and latent phases of
infection. TNF-neutralizing drugs used to treat inflammatory disorders have been reported to increase the risk of
tuberculosis (TB), in accordance with animal studies. The present study takes a computational approach toward
characterizing the role of TNF in protection against the tubercle bacillus in both active and latent infection. We extend
our previous mathematical models to investigate the roles and production of soluble (sTNF) and transmembrane TNF
(tmTNF). We analyze effects of anti-TNF therapy in virtual clinical trials (VCTs) by simulating two of the most commonly
used therapies, anti-TNF antibody and TNF receptor fusion, predicting mechanisms that explain observed differences
in TB reactivation rates. The major findings from this study are that bioavailability of TNF following anti-TNF therapy is
the primary factor for causing reactivation of latent infection and that sTNF—even at very low levels—is essential for
control of infection. Using a mathematical model, it is possible to distinguish mechanisms of action of the anti-TNF
treatments and gain insights into the role of TNF in TB control and pathology. Our study suggests that a
TNF-modulating agent could be developed that could balance the requirement for reduction of inflammation with the
necessity to maintain resistance to infection and microbial diseases. Alternatively, the dose and timing of anti-TNF
therapy could be modified. Anti-TNF therapy will likely lead to numerous incidents of primary TB if used in areas where
exposure is likely.
Citation: Marino S, Sud D, Plessner H, Lin PL, Chan J, et al. (2007) Differences in reactivation of tuberculosis induced from anti-TNF treatments are based on bioavailability in granulomatous tissue. PLoS Comput Biol 3(10): e194. doi:10.1371/journal.pcbi.0030194
Introduction
Control of
Mycobacterium tuberculosis
(Mtb) infection is a
result of a successful immune response that requires priming
and activation of antigen-specific CD4
+
and CD8
+
T
lymphocytes, recruitment of cells to the infection site
(typically the lung), and production of cytokines, some of
whose role is to activate macrophages. This leads to inhibition
or killing of some but not all bacilli. Immunological
structures (granulomas) form in the lung in response to
persistent antigen and cytokine and chemokine signals. In
95% of infected hosts,
M. tuberculosis
(Mtb) persists without
causing symptoms or disease. Latent infection can
subse-quently reactivate to cause active TB. Experimental evidence
has revealed that tumor necrosis factor (TNF) plays a major
role in host defense against Mtb in both the active and
chronic phases of infection [1–4].
TNF action increases the phagocytosis by macrophages and
enhances mycobacterial killing in concert with IFN-
c
[3,5].
TNF is crucial in recruitment of inflammatory cells,
stimulat-ing chemokine production [6] and inducstimulat-ing adhesion
molecules on vascular endothelium [7].
Table S1 summarizes data regarding TNF in Mtb murine
models. TNF is a crucial component of both antibacterial
protection and the inflammatory immune response.
TNF-deficient mice exhibit disorganized granulomas, altered tissue
pathology, high bacterial loads, and reduced survival [2,3].
TNF also possesses tissue-injuring properties that manifest in
clinical settings including inflammation, auto-immune
dis-eases, and transplant rejections [8,9]. In TB patients,
peripheral increases in TNF have been implicated in clinical
worsening [10]. In the absence of TNF signaling, disruption of
granulomatous formation as well as dissolution of
granulo-Editor:Dominik Wodarz, University of California Irvine, United States of America
ReceivedJanuary 6, 2007;AcceptedAugust 21, 2007;PublishedOctober 19, 2007
A previous version of this article appeared as an Early Online Release on August 22, 2007 (doi:10.1371/journal.pcbi.0030194.eor).
Copyright:Ó2007 Marino et al. This is an open-access article distributed under the
terms of the Creative Commons Attribution License, which permits unrestricted use, distribution, and reproduction in any medium, provided the original author and source are credited.
Abbreviations: AERS, Adverse Event Reporting System; LHS, latin hypercube sampling; MA, activated macrophage; MI, infected macrophage; Mtb, Mycobacte-rium tuberculosis;PRC, partial rank correlation; sTNF, soluble tumor necrosis factor; TB, tuberculosis; tmTNF, transmembrane TNF; TNF, tumor necrosis factor, VCT, virtual clinical trial
mas during chronic infection occurred, resulting in death of
the mice [1,4,11].
TNF is initially a transmembrane (tmTNF) protein that
undergoes cleavage by the specific metalloproteinase
TNF-converting enzyme (TACE) to form a soluble trimer [soluble
tumor necrosis factor (sTNF)] [12]. Both forms of TNF
function by binding to one of two receptors, TNFR1
(TNFRp55) and TNFR2 (TNFRp75) [13]. It was reasoned that
transmembrane ligands of TNF superfamily might elicit
bidirectional signals (reverse signaling) [14]. That hypothesis
was supported by data describing potential receptor-like
properties of tmTNF [15]. The majority of reverse signaling
described in lymphocytes is stimulatory [16,17], whereas
monocytes are mainly inhibited in their effector functions
[18–20]. For further details, we review TNF biology (sTNF and
tmTNF, receptors, reverse signaling, and the role of
lympho-toxin) in Text S1. Known effects of sTNF and tmTNF on
macrophages and T cells are summarized in Table 1.
Several biologic inhibitors (antibodies and receptor fusion
molecules) have been developed that interfere with TNF
activity and are used to control inflammation in diseases such
as rheumatoid arthritis [21,22] and Crohn’s disease [23,24].
The importance of TNF in control of TB is highlighted by an
increased susceptibility of these patients to TB reactivation
[25,26]. The incidence of TB in individuals receiving antibody
appears to be higher than in those treated with receptor
fusion molecule [27], suggesting that there are differences in
the mode of action of these agents. Alternatively, the dose
and timing of anti-TNF therapy could be modified.
The present study takes a theoretical approach toward
characterizing the role of TNF in protection against the
tubercle bacillus in both active and latent infection. We
extend our previous models [28–31] to investigate the roles
and production of sTNF versus tmTNF. To explore the effects
of TNF blockade, we study two anti-TNF agents, a
TNF-neutralizing antibody and a soluble p75 TNF receptor fusion
(TNFR2Fc). Using a mathematical model, it is possible to
distinguish mechanisms of action of the anti-TNF treatments
and gain insights into the role of TNF in TB control and
pathology.
Results
We describe results in these different areas of TNF study:
mathematical modeling of typical infection progressions in
humans, mechanisms driving infection outcomes, and
anti-TNF therapies. Deletion and depletion experiments are
discussed in Methods. Unless otherwise specified, all plots
are on a linear-log scale.
Negative control simulations have been performed on the
model [31]. The model simulates both latent infection and
active TB outcomes, depending on parameter values. Cell and
cytokine profiles associated with latent and active TB are
shown in Figures 1 and 2, respectively. As discussed
previously [31], we use bacterial load as a marker of disease
progression, where uncontrolled growth is indicative of active
TB.
Latent TB
Simulations predict that with an inoculum of 25
mycoba-teria [32], latency is achieved (i.e., bacmycoba-terial numbers are
controlled) in fewer than 300 days, under appropriate
immunologic conditions. Latent TB is characterized by low
levels of extracellular bacterial load (
,
50 bacteria per cm
3of
granulomatous tissue), and all intracellular bacteria (Figure
1A) reside within a small number of chronically infected
macrophages (MIs) (approximately 15 MI, with 50
intra-cellular bacteria each). The total population of T cells in
latency (CD4
+
and CD8
+
T cells combined, Figure 1B and
1C) is comparable with numbers found experimentally, with a
ratio of CD4
+
/CD8
+
T cells approximately one, consistent
with experimental observations [33,34]. During latency, TNF
levels (Figure 1E) are on the order of 0.12 pg/mL (limited
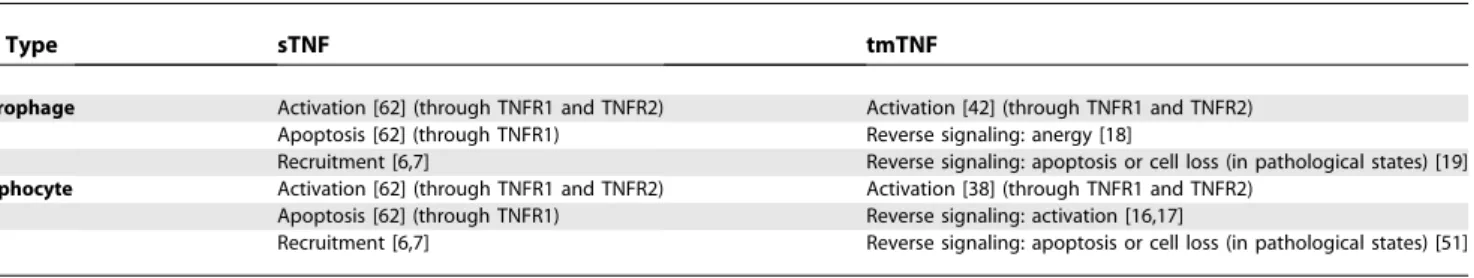
Table 1.
sTNF and tmTNF Effects on Lymphocytes and Monocytes/Macrophages
Cell Type sTNF tmTNF
Macrophage Activation [62] (through TNFR1 and TNFR2) Activation [42] (through TNFR1 and TNFR2) Apoptosis [62] (through TNFR1) Reverse signaling: anergy [18]
Recruitment [6,7] Reverse signaling: apoptosis or cell loss (in pathological states) [19] Lymphocyte Activation [62] (through TNFR1 and TNFR2) Activation [38] (through TNFR1 and TNFR2)
Apoptosis [62] (through TNFR1) Reverse signaling: activation [16,17]
Recruitment [6,7] Reverse signaling: apoptosis or cell loss (in pathological states) [51]
doi:10.1371/journal.pcbi.0030194.t001
Author Summary
inflammation) as levels of MIs and MAs (activated
micro-phages) are relatively low (and these are major TNF
producers). This small amount of TNF is significant, as
neutralizing this concentration of TNF drives the system into
active TB (see the section
‘‘
TNF depletion and anti-TNF
treatments
’’
). This indicates a critical role for even small
amounts of TNF in maintaining latency. Predicted ranges for
IFN-
c
and IL-10 (Figure 1D) all correlate with studies
measuring cytokine levels at the infection site [35–37]. Total
macrophage numbers do not change significantly in the first
year post-infection, and resident macrophages remain
rela-tively constant, while numbers of MIs and MAs remain below
50 (Figure 1F).
Sources of TNF during Latency
The roles played by different cellular sources of TNF
involved in protective immunity remain unclear. During
latency we evaluate and compare production of TNF by
macrophages and lymphocytes (Table S2). The model predicts
that macrophages are the main producers of TNF during the
early phase of infection, and that once latency is achieved
lymphocytes and macrophages produce similar amounts of
TNF. This supports the idea that macrophages are key in
establishing latency via TNF production, while T cell–derived
TNF is essential, but not sufficient, for protection against Mtb
infection, as shown in experimental data in mice [38].
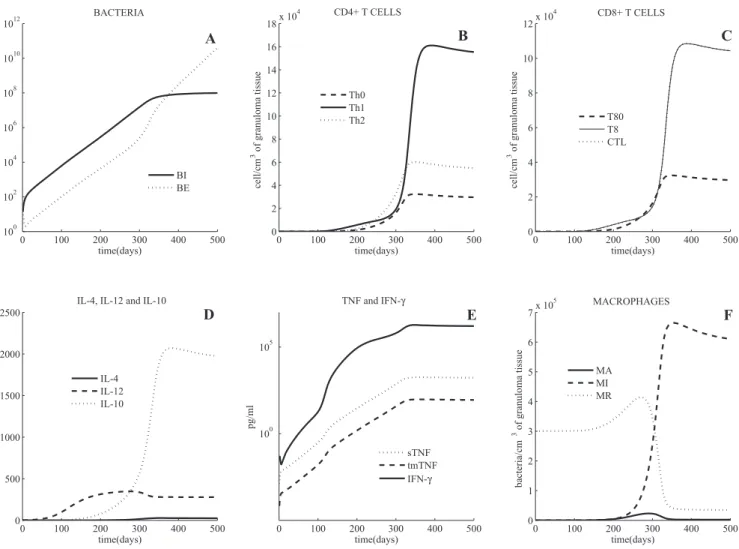
Active TB
As discussed in the Methods section, by choosing different
sets of parameter values, the mathematical model can
simulate active infection. Active TB is characterized by
uncontrolled growth of intracellular and extracellular
bac-teria throughout the simulation (500 days), reaching a total
bacterial load of 10
8per cm
3of granulomatous tissue
approximately at day 300 (Figure 2A). Resident macrophage
numbers drive cytokine dynamics in the first 300 days. When
resident macrophage populations begin to fall (because they
all become infected), a switch in bacterial populations occurs:
extracellular bacteria are continuously increasing due to MIs
bursting while intracellular bacteria reach a saturation level
(determined by the level of available macrophages). High
bacterial load is coupled to very high levels of IFN-
c
(Figure
Figure 1.Mathematical Model Simulation of a Latent State
Shown are intracellular and extracellular bacterial loads (A), CD4+and CD8+T cells (B,C) (linear scale), cytokines (D,E) (linear scale), and macrophages (F). The volumetric unit for cell and bacteria populations is number per cm3of a granulomatous tissue. The unit of measure for cytokine concentrations
is pg/mL of granuloma homogenate.
2D) and TNF (
;
1000 pg/ml, see Figure 2E). Total macrophage
population increases within the first 200 days, and by one
year post-infection most of them are infected (see Figure 2F).
T cell numbers (Figure 2B and 2C) are comparable with
macrophage numbers during active TB (approximately 10
5cells per cm
3of granulomatous tissue). IL-12, IL-10 (Figure
2D), and IL-4 levels (Figure 2 E) are also qualitatively and
quantitatively similar to those observed in murine and NHP
models as well as from limited human studies. For more
details, see [31].
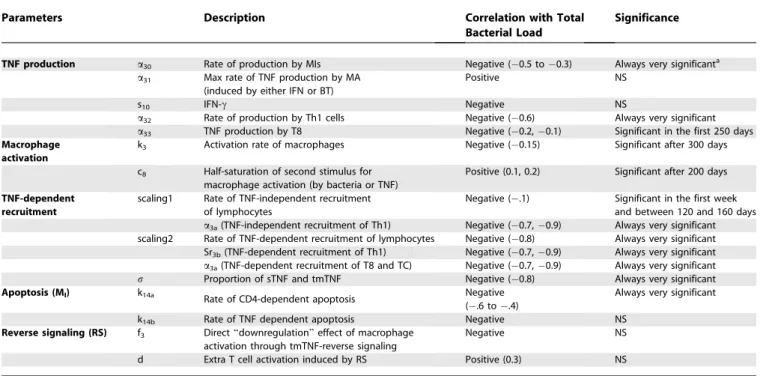
Uncertainty and Sensitivity Analysis
We investigate the importance of specific TNF-dependent
mechanisms that allow for infection control via sensitivity
and uncertainty analyses (see Methods). We observe how
variations in different sets of parameters affect bacterial load.
Table 2 illustrates TNF-dependent factors that, when varied,
promote either lower bacterial levels (from latency) or
increased bacterial load and reactivation of latent TB.
TNF production.
Our sensitivity analysis indicates a critical
role for TNF production by both MIs (
a
30) and Th1 cells (
a
32)
throughout the infection (negative correlation values
0.6 to
0.2,
p
,
0.001, Table 2). TNF production by CD8
+
T cells
(
a
33) is only significant in the first 250 days post-infection,
suggesting that it is important for establishing latency but not
maintaining it (see Table S2 for TNF production per cell type
during latency).
Cell Recruitment and Activation
The model predicts that enhanced recruitment of
lympho-cytes (Th1, T8, and TC) is a desirable strategy toward
establishing latency, as suggested by the strong and very
significant negative correlation of TNF-dependent
recruit-ment parameters (
Sr3b
and
a
3a) with bacterial load throughout
the course of infection. On the other hand, macrophage
activation plays a more important role in maintaining
latency: the correlation between macrophage activation rate
(
k3
) and bacterial load is significant only after latency is
achieved (
,
1 year). TmTNF effects on macrophage (
f
3) and
lymphocyte activation (
d
) are not significant in either
achieving or maintaining latency.
Among all TNF-related mechanisms, the uncertainty and
Figure 2.Mathematical Model Simulation of an Active TB State
Shown are intracellular and extracellular bacterial loads (A), CD4+and CD8+T cells (B,C) (linear scale), cytokines (D) (linear scale) and (E) (linear-log scale), and macrophages (F) (linear scale). See Figure 1 for measure units and abbreviations. The main differences in parameter value choices used to distinguish active TB from latency in this simulation are the following: decreased lymphocyte dependent recruitment, increased macrophage TNF-dependent and inTNF-dependent recruitment, decreased CTL killing (k52), and increased extracellular bacteria growth rate (a20).
sensitivity analyses indicate that lymphocyte recruitment and
macrophage activation are the most influential toward
controlling bacterial levels when compared with
TNF-induced apoptosis (which is not significant, Table 2). This is
consistent with experimental evidence that TNF-induced
apoptosis accounts for only 5%–10% killing of MIs [39,40].
Our virtual deletion and depletion experiments are
consis-tent with TNF gene knockouts and TNF neutralization studies
(Methods), further supporting that TNF is necessary toward
both achieving and maintaining latency.
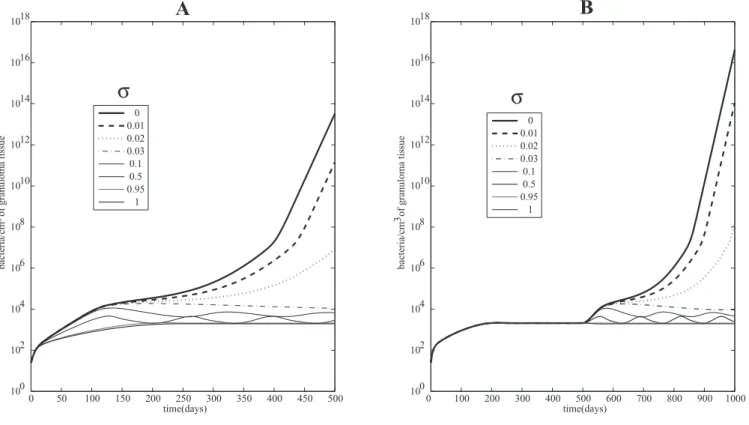
A Crucial Role of sTNF in Achieving and Maintaining
Latency
Little or no data are available to indicate the fraction of
TNF (
F
a) that is cleaved into sTNF in vivo. We introduce a
parameter
r
to indicate the fraction of TNF cleaved. The
remaining (1
r
)
F
arepresents tmTNF (where sTNF
+
tmTNF
¼
r
Fa
+
(1
r
)
Fa
¼
Fa
. Considering the relative
transient expression of tmTNF in vitro [41], we assume that
r
is approximately 95% (i.e., only 5% TNF is transmembrane)
so that the majority of tmTNF is cleaved and released in its
bioactive soluble form. We test variations on levels of
r
(percent sTNF) and report results in two settings in Figure 3.
First we explore different percentages of sTNF (
r
) and look at
the effects on bacteria load, and then we deplete different
levels of
r
after latency has been attained.
Figure 3A shows bacterial load for different percentages
r
cleaved TNF. The system gradually shifts to higher bacterial
loads with decreasing amounts of sTNF. This transition arises
through oscillations that push the system to active TB when
sTNF is almost completely deleted (where sTNF is
,
3% of
total TNF). We obtain a similar dynamic during a depletion
experiment where at day 500 (after latency is attained) we
deplete varying levels of sTNF from the system (Figure 3B).
The system reactivates when almost no sTNF is released. This
suggests sTNF is necessary to control active TB and to
maintain latency, likely because of its crucial role in
lymphocyte and macrophage recruitment, and that tmTNF
is not sufficient to maintain latency in humans, as seen in
mice [42,43]. Figure S3 numerically shows how the stability of
the latency state is dependent on
r
and partially explains why
sTNF is necessary to maintain latency (as shown in Figure 3B).
Anti-TNF Therapies
We use the mathematical model to simulate three virtual
clinical trials (VCT) of anti-TNF treatments (protocols are
described in detail in Tables S3 and S4). The first two VCT are
designed to explore which factors contribute most to
reactivation of latent TB during two types of anti-TNF
treatment. The third VCT explores the effects of exposure to
Mtb after anti-TNF treatment is initiated.
Two classes of biological inhibitors were tested in the VCT:
anti-TNF antibody and TNF receptor fusion (TNFR2Fc). We
define each drug as having a specific ability to neutralize TNF
at the granuloma site; these data are not currently known (i.e.,
the drug neutralizing power). We define
TNF bioavailability
as
the amount of total TNF available for use in the granuloma
during anti-TNF treatment. Since we model TNF
concen-trations in granulomatous tissues, high bioavailability of TNF
during therapy translates into a low neutralizing power of the
drug or low penetration of the drug into granulomatous
tissue.
As shown above (Figure 1), our simulation of the latent TB
state predicts TNF levels at 0.12 pg/mL. This is the same order
Table 2.
Uncertainty and Sensitivity Analyses of the Model for TNF-Related Parameters
Parameters Description Correlation with Total
Bacterial Load
Significance
TNF production a30 Rate of production by MIs Negative (0.5 to0.3) Always very significanta a31 Max rate of TNF production by MA
(induced by either IFN or BT)
Positive NS
s10 IFN-c Negative NS
a32 Rate of production by Th1 cells Negative (0.6) Always very significant a33 TNF production by T8 Negative (0.2,0.1) Significant in the first 250 days
Macrophage activation
k3 Activation rate of macrophages Negative (0.15) Significant after 300 days
c8 Half-saturation of second stimulus for
macrophage activation (by bacteria or TNF)
Positive (0.1, 0.2) Significant after 200 days
TNF-dependent recruitment
scaling1 Rate of TNF-independent recruitment of lymphocytes
Negative (.1) Significant in the first week and between 120 and 160 days
a3a(TNF-independent recruitment of Th1) Negative (0.7,0.9) Always very significant
scaling2 Rate of TNF-dependent recruitment of lymphocytes Negative (0.8) Always very significant Sr3b(TNF-dependent recruitment of Th1) Negative (0.7,0.9) Always very significant a3a(TNF-dependent recruitment of T8 and TC) Negative (0.7,0.9) Always very significant
r Proportion of sTNF and tmTNF Negative (0.8) Always very significant
Apoptosis (MI) k14a Rate of CD4-dependent apoptosis Negative
(.6 to.4)
Always very significant
k14b Rate of TNF dependent apoptosis Negative NS
Reverse signaling (RS) f3 Direct‘‘downregulation’’effect of macrophage
activation through tmTNF-reverse signaling
Negative NS
d Extra T cell activation induced by RS Positive (0.3) NS
as those obtained via our granuloma homogenate data of 0.5
pg/ml derived from a nonhuman primate model (see Text S2).
When performing deletion and depletion experiments, we
determined that only a small percentage of the total latency
TNF was required to maintain latency (see Methods). At levels
of TNF below that minimum, the system always reactivated.
We assume treatment affects TNF bioavailability such that
only a percentage of the latency level is bioavailable. We
define
reactivation threshold
(RT) as a level (percent of TNF in
latency) of bioavailable TNF below which results in
reactiva-tion (see Methods). Thus, during anti-TNF treatment we can
predict whether the bioavailable TNF is pushed below this
threshold, leading to reactivation. If the RT is high, then more
bioavailable TNF is required to maintain latency; if RT is low,
only very low levels of bioavailable TNF are needed to
maintain latency.
Virtual Clinical Trial 1
A series of VCT were simulated assuming different TNF
bioavailability ranges induced by the two different treatments
and a natural biological variation of
r
(percentage of total
TNF cleaved and released as sTNF). Considering the transient
expression of tmTNF in vitro [41], we assume
r
varies
between 50% and 100%. Table 3 illustrates the results in
Table 3.
Virtual Clinical Trial 1 (VCT1)
r: Percent of Total TNF Cleaved
TNF Bioavailability during Treatment: Percent Left of Latency Level
Reactivation per 100 Patients Given Anti-TNF Antibody
Reactivations per 100 Patients Given TNF Receptor Fusion
50%–100% ,20% 100 100
20%–30% 100 83
30%–50% 34 4
.50% None None
Number of reactivations per 100 virtual patients using both TNF receptor fusion and anti-TNF antibody treatments. doi:10.1371/journal.pcbi.0030194.t003
Figure 3.Comparing the Roles of sTNF and tmTNF
(A) Mathematical model simulations of total bacterial load corresponding to different proportionsr(percent sTNF versus tmTNF); all the other
parameters are fixed to parameters yielding a latent state (see Table S6).
(B) Simulated depletion of variable levels of sTNF. Until day 500, the system is in latency andr¼0.95. Then at day 500, the depletion of sTNF is
performed. Different values ofrare shown, whereris the percent cleaved TNF (sTNF). Total bacterial loads are shown corresponding to different
terms of number of reactivations per 100 latently infected
virtual patients.
If TNF bioavailability at the granuloma site is
,
20% of
baseline latency level (at the initiation of therapy at 500 days),
both treatments induce 100% reactivation. In the range
20%–30%, anti-TNF antibody always causes reactivation,
while TNFR2Fc reactivates 83/100 virtual patients. At higher
bioavailability ranges (30%–50%), the differential risk of
reactivation goes down to 34 or 4 per 100 virtual patients for
anti-TNF antibody versus TNFR2Fc, respectively. No
reac-tivation occurs for both treatments if more than 50% of TNF
is bioavailable. The prediction that anti-TNF antibody
treat-ment has a stronger impact on reactivation risk than
TNFR2Fc in the bioavailability range of 20%–50% suggests
that other factors may be playing a role in reactivation in
addition to bioavailability. To explore this, we simulated
another clinical trial.
Virtual Clinical Trial 2
In addition to bioavailability, the percentage of total TNF
cleaved (
r
) may also be an important variable. First, we will
assume that both molecules equally affect TNF
bioavail-ability so we can explore independently the effects of sTNF
versus tmTNF levels. Table 4 shows results for evaluating RT
for different
r
to investigate the role of tmTNF in TB
reactivation during anti-TNF therapy. If we assume that
r
is
not very variable in the population and approximately equal
to 95% (the baseline value that we used to generate our
latency results), and we vary TNF bioavailability in the same
range for both treatments (between 20% and 50%), our
model predictions show that the differential reactivation
risk is 34 per 100 anti-TNF antibody-treated virtual patients
versus 28 per 100 TNFR2Fc-treated virtual patients (Table
4). RTs are not significantly different for this first
experi-ment (25.11% versus 24.19%). However, if
r
is allowed to
vary from 50% up to 100%, as in VCT1, the VCT now
predicts a differential reactivation risk of 46 per 100
anti-TNF antibody-treated virtual patients versus 30 per 100
TNFR2Fc-treated virtual patients (Table 4). RTs are now
significantly different (28.62% versus 25.01%,
p
,
0.001). So,
a lower
r
(more tmTNF and less sTNF) has a negative impact
on maintaining latency during anti-TNF antibody treatment.
To determine other factors that contribute to reactivation
differences between the two therapies, we now fix both TNF
bioavailability and
r
. Since the RTs were not significantly
different between the two treatments when
r
is fixed at 95%,
we isolate the effect of TNF bioavailability by fixing it at 28%.
We chose this value of bioavailability specifically because it
allows us to determine other factors responsible for more
reactivation in the anti-TNF antibody therapy when no
reactivations occur for the TNFR2Fc therapy (Table 4).
Our sensitivity analysis (Table S5) demonstrates that by
varying all 12 parameters in the model that are affected by
anti-TNF antibody treatment, only three contribute
signifi-cantly to the observed reactivation. Cell loss rates of IFN-
c
producing CD8
+
cell (T8 [31]) and MA induced by anti-TNF
antibody therapy positively correlated with total bacterial
load (
l
tmTNF-MAand
l
tmTNF-T8).
The cell loss rate of MI negatively correlated with total
bacterial load (
l
tmTNF-MI). Thus, anti-TNF treatment reduces
the number of MAs and T8 cells and increases bacterial levels,
increasing risk of reactivation. Although anti-TNF antibody
also reduces the number of MIs, this is not sufficient to
maintain latency. This may explain why a higher percentage
of tmTNF has a negative impact on infection containment
during anti-TNF antibody treatment: with more tmTNF,
more MAs and T8 cells are lost from the granuloma.
Duration of treatment also affects risk of reactivation for
both therapies. Table 5 shows simulation results where we
varied simultaneously TNF bioavailability (between 20% and
50%) and
r
(between 50% and 100%), setting different
protocols for treatment duration. There is a significant
difference in average RTs between a 12-month regimen and
18- or 24-month regimen for both treatments. We tested
whether bacterial load at treatment initiation affects
reac-tivation risk. If the total bacterial load is
,
500 CFU, no
reactivation is observed for both treatments. If total bacterial
load is 2–3 fold higher than latency level (
;
3–4e3 CFU), the
system always reactivates for both treatments (unpublished
data).
Virtual Clinical Trial 3
If treatment starts before infection with Mtb occurs, we
assume that drug penetration is not relevant because the
granuloma has not yet formed. We assume instead that a
certain concentration of anti-TNF molecules are present in
the lung where granulomas would begin to form in response
to infection. Average serum concentrations of anti-TNF
molecules are published [44] but no data are available for
lung. It takes 300 days to achieve latency with TNF at 0.12 pg/
Table 4.
Virtual Clinical Trial 2 (VCT2)
TNF Bioavailability during Treatment: Percent Left from Latency Level
r: (Percent sTNF) Anti-TNF Antibody TNF Receptor Fusion Reactivations per 100
Virtual Patients
Reactivation Threshold
Reactivations
per 100 Virtual Patients
Reactivation Threshold
20%–50% 95% 34 25.11% 28 24.19%
50%–100% 46 28.62* 30 25.01%
29% 95% 95 — 0 —
*
Very significant (p,0.001)
Number of reactivations and RTs per 100 virtual patients using both TNF receptor fusion and anti-TNF antibody treatments. Thereactivation threshold(RT) is defined in the Methods section. It represents a threshold where reduction of bioavailable TNF below that percent of latency value leads to reactivation.
mL (see Figure 1). We capture changes in TNF bioavailability
during anti-TNF therapy by dynamically lowering TNF levels
by a constant percentage throughout treatment (Figure S1).
For level of total TNF 50% lower than baseline latency levels,
treatment with either drug leads to disease, following acute
infection, with no significant differences between them
(Figure S2).
Discussion
The major findings from this study are that bioavailability
of TNF following anti-TNF therapy is the primary factor for
causing reactivation of latent infection, that anti-TNF
therapy will likely lead to numerous incidents of primary
TB if used in areas where exposure is likely, and that sTNF—
even at very low levels—is essential for control of infection.
Our model predictions (see Figure 3) recapitulate recent
murine studies that tmTNF is sufficient to provide acute but
not long-term control of Mtb infection [42,43]. We predict
that
.
2% of total TNF needs to be released in soluble form to
control acute infection and maintain latency. Bacterial loads
increase as the percentage
r
of total TNF cleaved is
decreased, i.e., allowing more tmTNF in the system.
We use the model to analyze the effects of anti-TNF
therapy by simulating anti-TNF antibody and TNFR2Fc. The
reported measure unit for a steady state or average
concentration of anti-TNF drugs in serum is on the order
of
l
g/ml. Data on soluble TNFRs concentration in serum are
on the order of ng/ml [45]. We use and predict concentrations
of sTNF within the order of pg/mL based on our granuloma
homogenate data (see Text S2). Given these predicted and
reported concentrations, both treatments can systemically
neutralize most if not all TNF. We can speculate that both
TNFR2Fc and antibody will likely neutralize most if not all
TNF at the granuloma site, if each penetrates granulomatous
tissue equally well. An alternative way to interpret
bioavail-ability is in terms of drug penetration into granulomatous
tissues. However, our studies in murine models suggest that
anti-TNF antibody penetrates or remains in the granuloma at
higher levels than receptor fusion molecules [46]. The
pharmacodynamic differences between these two agents
include increased dissociation rate of TNF from TNFR2Fc
compared with antibody [47]. Whether these differences play
a role inside the granuloma is not known. However, one can
imagine that increased dissociation in the context of high
concentrations of endogenous TNF receptors could lead to
better TNF signaling in the granuloma.
The VCT simulations suggest that TNF bioavailability is the
main factor leading to reactivation by anti-TNF treatments in
latently infected patients. Reactivation always occurs if both
drugs penetrate the granuloma equally well (TNF
bioavail-ability less than 20%). High bacterial load at treatment
initiation increases the likelihood of reactivation. This
suggests that a complete regimen of antibiotic treatment
for Mtb infection prior to anti-TNF treatment could reduce
the risk of reactivation. If TNF bioavailability is equally
affected by the two treatments, differential cell level losses
induced by anti-TNF antibody therapy accounts for higher
reactivation rates: activated CD8
+
T cells and MA loss are not
compensated by the apparently beneficial effect of MI loss.
We speculate that the intracellular bacteria released after MI
death induced by antibody binding to tmTNF (whether
dependent on tmTNF reverse signaling or complement
cascade) can only facilitate bacterial clearance by the host
and does not enhance dissemination. Further, our results
show that the longer patients are exposed to anti-TNF drugs
through longer duration treatment protocols, the risk of
reactivation increases. If infection with Mtb occurs after
treatment is initiated, chances of developing active infection
are very high if we assume reasonable levels of drug
penetration into lungs (TNF bioavailability
,
50%). This is
particularly important if anti-TNF treatments are
imple-mented in regions of the world where infection risk is
elevated. Bacteria grow uncontrolled when both sTNF and
tmTNF are depleted (anti-TNF antibody therapy).
These data suggest that tmTNF plays a key role in
controlling active infection, where tmTNF preserves a subset
of the beneficial mechanisms of TNF while lacking
detri-mental effects. Our predictions and recent experidetri-mental data
[42] support the hypothesis that selective targeting of sTNF
may offer several advantages over complete blockade of TNF
in the treatment of chronic inflammatory diseases.
Current studies in both murine and NHP animal models by
our group are now following up on these predictions. Our
recent data from a mouse model showed that treatment with
anti-TNF Ab in the chronic phase rapidly resulted in
fulminant TB, while treatment with an etanercept-like
molecule (receptor fusion) allowed mice to maintain
control
of the infection [46]. In contrast, following treatment with
either antibody or receptor fusion during initial infection
caused mice to succumb rapidly to the infection. This clearly
Table 5.
Duration of Treatment study for VCT2
TNF Bioavailability during Treatment: Percent Left from Latency Level
r: (Percent sTNF) Duration (Months)
Anti-TNF Antibody TNF Receptor Fusion Reactivations per 100
Virtual Patients
Reactivation Threshold
Reactivations per 100 Virtual Patients
Reactivation Threshold
20%–50% 50%–100% 12 46 28.62% 30 25.01%
18 82 33.21%* 67 30.34%*
24 85 33.2%* 72 30.98%*
Number of reactivations per 100 virtual patients using both TNF receptor fusion and anti-TNF antibody under conditions of VCT2. Thereactivation threshold(RT) is defined in the Methods section.
demonstrated, in a mouse model, that there are differences
between the two TNF neutralizing drugs depending on the
phase of infection [46]. Our studies in NHP model are
ongoing. Finally, this work focuses on reactivation based on
bacteria harbored in the lungs. But data exist suggesting that
bacteria do not reside only in granulomas, but in other places
in the body during latency. For example, recent data by
Neyrolles et al. [48] support the presence of nonreplicating
bacteria in adipose tissue during latent TB infection. In the
future we can consider the role of reseeding of the lungs from
other body sites as a possible feature in reactivation.
Methods
To better understand underlying dynamics of TNF production and function, we build on our mathematical model of Mtb in humans using 16 nonlinear ordinary differential equations. The updated model tracks three macrophage populations (resting, activated, and infected) and multiple T cell (Th0, Th1, Th2, and CD8+T cell subsets) populations [31]. The model also includes five cytokine concen-trations (IFN-c, IL-12, total TNF, IL-10, and IL-4) and two bacterial (intracellular and extracellular) populations with numbers represent-ing temporal dynamics of these populations in the lung (our modeling environment). The biological assumptions and the equa-tions of the updated human Mtb model are outlined and described in the following section.
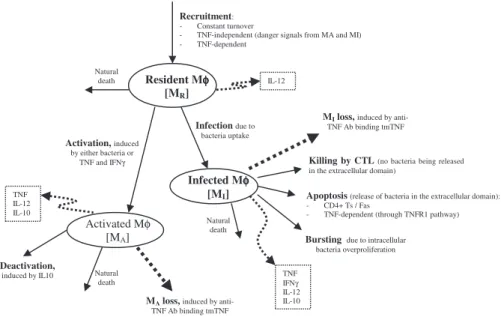
Model equations.The nonlinear ODE model is based on [31] and simulates interactions between two bacterial subpopulations, eight cell populations, and five cytokines. The new terms related to TNF dynamics are represented in bold and are described in the Methods section. Submodel diagrams are illustrated in Figures 4–6. They show macrophage, lymphocyte, and bacteria dynamics, capturing the terms represented for each of our equations. Cytokine production dynamics are superimposed on each diagram.
Macrophage dynamics.The equations describing dynamics for the macrophage subpopulations are given by:
dMR
dt ¼srM+a4AðMA+w2MIÞ+sr4B
rFa
rFa+f8I10+s4b
k2MR BE BE+c9
k3MR
Ic
Ic+f1I4+f3ð1rÞFa+s1
3 BT+bFa BT+bFa+c8
lMRMR
ð1Þ
dMI dt ¼k2MR
BE BE+c9
k17MI B2
I B2
I+ðNMIÞ2 !
k14AMI
TC+w3T1 MI TC+w3T1
MI +c4 0
B B @
1
C C A
k14BMI
rFa
rFa+f9I10+s4B
k52MI
TC T1 T1+cT1
+w1T1
MI
TC T1 T1+cT1
+w1T1
MI
+c52 0
B B B B B B @
1
C C C C C C A
lM
IMIltmTNFMI
ð1rÞFa
ð1rÞFa+stmTNFMI
MI
ð2Þ
dMA dt ¼k3MR
Ic
Ic+f1I4+f3ð1rÞFa+s1
3 BT+bFa BT+bFa+c8
k4MA I10 I10+s8
lMAMAltmTNFMA
ð1rÞFa
ð1rÞFa+stmTNFMA
MA
ð3Þ
Figure 4 shows a descriptive diagram of macrophage dynamics, with the terms captured for each of our equations.
Rate of change of resting macrophages (Equation 1) includes a source term (srM) and a natural death term (-lMRMR). In the course of
infection, additional resting macrophages are recruited in a TNF-dependent fashion at a rate Sr4B, and this process is downregulated by IL-10. We also account for TNF-independent recruitment mechanisms (for both macrophages and lymphocytes) with a term that indirectly represent chemokines secreted primarily by MAs and MIs (a(MA +w MI), 0,w,1): the magnitude of recruitment (a) varies from macrophages to lymphocytes. Resting macrophages at the site of infection can become chronically infected at a maximum rate k2(dependent on the extracellular bacterial load) and activated at rate k3(dependent on two signals from IFN-cand either bacteria or TNF). Note that due to differences in measurement units, TNF is scaled by a factorb. IFN-cinduction is downregulated by IL-4.
MIs (Equation 2) can be cleared by one of several different mechanisms. Given an average maximal intracellular bacterial carrying capacity of N, we assume that one-half of the MIs burst Figure 4.Macrophage Dynamics
when the intracellular bacterial load reaches NMI. This mechanism has a maximal rate k17, and is described by a Hill process. Immune responses also contribute to MI killing by several mechanisms. Both CD8+and CD4+T cells can use the Fas-FasL apoptotic pathway to induce apoptosis in these cells at a maximum rate k14a. The half-saturation constant c4describes the effector-target ratio (Tt:MI) at which this process is half maximal. TNF can also induce apoptosis by binding to the TNFR1 receptor. This process is downregulated by IL-10 and occurs at a rate k14b. Finally, CTL killing by CD8+and CD4+ T cells happens at a rate of k52. Specifically, CD4+ T cells have a limited contribution and this is accounted for by scaling the CD4+T cell numbers (0 ,w1 ,1). CD8+ T cell numbers are scaled by a Michaelis-Menten term accounting for the indirect dependence on CD4+T cells for their killing capability. MAs are generated from the term in Equation 1 and undergo natural death at a rate proportional to their number (-lMAMA). MAs can be deactivated by IL-10 at a rate k4.
T cell dynamics.
dT0
dt ¼a1AðMA+w2MIÞ+sr1B
rFa
rFa+f8I10+s4b2
+a2T0 MA MA+c15
1+d ð1rÞFa ð1rÞFa+stmTNF
k6I12T0 Ic Ic+ðf1I4+f7I10Þ+s1
k7T0 I4 I4+f2Ic+s2
lT0T0
ð4Þ
dT1
dt ¼a3AðMA+w2MIÞ+sr3B
rFa
rFa+f8I10+s4b1
lTc Ic
Ic+c
T1MA+k6I12T0 Ic Ic+ðf1I4+f7I10Þ+s1
lT1T1ltmTNFT1
ð1rÞFa
ð1rÞFa+stmTNFT1
T1
ð5Þ
dT2
dt ¼a3A2ðMA+w2MIÞ+sr3B2
rFa
rFa+f8I10+s4b1
+k7T0 I4 I4+f2Ic+s2
lT2T2
ltmTNFT2
ð1rÞFa
ð1rÞFa+stmTNFT2
T2
ð6Þ
dT80
dt ¼a1AðMA+wMIÞ+a2T80 MA MA+c15
3 1+d ð1rÞFa
ð1rÞFa+stmtnf
+sr1B rFa rFa+f8I10+s4b2
k6T1T80 Ic Icðf1I4+f7I10Þ+s1
lT80T80
ð7Þ
dT8
dt ¼ma3AcðMA+w2MIÞ+m sr3Bc
rFa
rFa+f8I10+s4b1
+mk6I12T80 Ic Ic+ðf1I4+f7I10Þ+s1
lTcc Ic
Ic+cc
T8MA
lT8T8ltmTNFT8
ð1rÞFa
ð1rÞFa+stmTNFT8
T8
ð8Þ
dTC
dt ¼ma3AcðMA+w2MIÞ+m sr3Bc
rFa
rFa+f8I10+s4b1
+mk6I12T80 Ic Ic+ðf1I4+f7I10Þ+s1
lTcc Ic
Ic+cc
TCMAlTcTC
ltmTNFTC
ð1rÞFa
ð1rÞFa+stmTNFTC
TC
ð9Þ
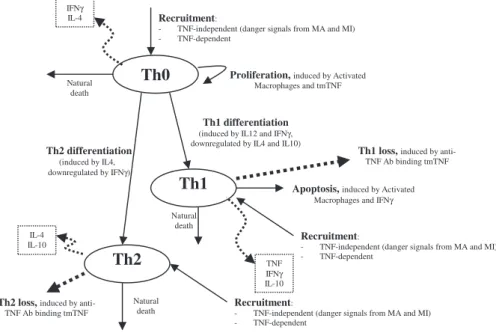
Figure 5 shows a descriptive diagram of CD4+ lymphocyte dynamics, with the terms captured for each of our equations. A similar diagram can capture the dynamics of CD8+ lymphocytes (Equations 7–9).
Similar to resting macrophages, recruitment of T cells occurs in both a TNF-independent and a TNF-dependent manner. The terms are similar, using different rates for the different T cell subsets (a1A, Sr1Bfor Th0 and T80 cells;a3A, Sr3Bfor Th1 and Th2 cells;a3Ac, Sr3Bc for CD8+ T cells, respectively). We assume that CD4+T cells can arrive at the site of infection either as Th0 (majority), or a small fraction may arrive already differentiated intoTh1 or Th2 cells (see Wigginton et al. [28] for a complete discussion).
Upon arriving at the site of infection, Th0 cells (Equation 4) can Figure 5.CD4+T Cell Dynamics
proliferate further in response to signals released by MAs at a ratea2. Th0 cells can also differentiate into Th1 (Equation 5) and Th2 (Equation 6) cells. Th1 differentiation is controlled by IL-12 and IFN-cand opposed by IL-4 and IL-10. Th2 differentiation is induced by IL-4 and inhibited by IFN-c. Th0 cells undergo natural death at a rate (-lT0T0). Th1 cells can be killed due to IFN-cinduced apoptosis in the presence of MAs at a ratelTc. Both Th1 and Th2 cells die naturally at
rateslT1andlT2, respectively. As is the case for CD4+T cells, we assume that CD8+T cells can arrive at the site of infection as T80 (majority) (Equation 7), or a small fraction may arrive already differentiated into effector cells of either T8 (Equation 8) or TC (Equation 9) type. T80 cells are activated due to interaction with Th1 cells and cytokines and have a natural half-life.
CD8+T cells also undergo IFN-cinduced apoptosis at a peak rate lTcc, and die at a rate lTc. Since the T8s (Equation 8) and Tcs
(Equation 9) are functional subsets of the CD8+T cell population (see Introduction), the equations are identical for both. We introduce a parameter m that accounts for possible overlap between T8 and TC subsets. This assumption is studied further in the CD8+ T cell kinetics section of Sud et al. [31].
Cytokine Dynamics.
dFa
dt ¼a30MI+a31MA
Ic+b2BT Ic+b2BT+ðf1I4+f7I10Þ+s10
+a32T1+a33ðTC+T8Þ lFaFa
ð10Þ
dIc
dt ¼sg BT BT+c10
I12 I12+s7
+a5AT1 MA MA+c5B
+a5BT8 MA MA+c5A
+a5cMI+a7T0 I12 I12+f4I10+s4
+a7T80 I12 I12+f4I10+s4
lgIc
ð11Þ
dI12 dt ¼s12
BT BT+c230
+a23MR BT BT+c23
+a8MA s s+I10
li12I12 ð12Þ
dI10 dt ¼d6MA
s6 I10+f6Ic+s6
+a16T1+a17T2+a18ðT8+TcÞ li10I10
ð13Þ
dI4
dt ¼a11T0+a12T2li4I4 ð14Þ
TNF (Equation 10) is produced primarily by MIs at a ratea30. MAs make TNF at a ratea31in response to IFN-cor bacteria and this process is inhibited by IL-10 and IL-4. Other sources of TNF are Th1 cells (ratea32) and CD8+T cells (ratea33) in response to antigen, and TNF has a given half-life.
Th0, Th1, and CD8+ T cells produce IFN-c (Equation 11) in response to antigen presentation by MAs at rates a5A and a5B, respectively. Production by Th0 and T80 cells is further enhanced by IL-12, and inhibited by IL-10. Other sources of IFN-c, such as NK cells, are also believed to play a role in TB infection. Since these are not accounted for in the model, we include an extra source term (sg) dependent on extent of infection and IL-12 level.
Resting macrophages produce IL-12 (Equation 12) in response to infection at a ratea23. MAs also produce IL-12, and this process is downregulated by 10. Dendritic cells are the primary source of IL-12 upon Mtb infection and are accounted for by an infection-dependent source term, s12. Finally, there is a natural half-life for IL-12.
IL-10 (Equation 13) is produced mostly by MAs, and this process is opposed by IFN-cand IL-10 itself at rated6. Other sources such as Th1 cells, Th2 cells, and CD8+T cells produce IL-10 at ratesa16,a17, anda18, respectively. IL-4 is produced by Th0, and Th2 cells produce (Equation 14) at ratesa11anda12, respectively. IL-4 has a given half-life ofli4.
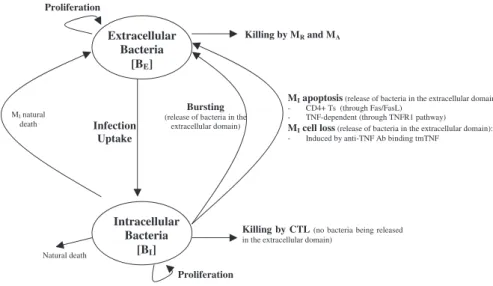
Bacterial dynamics. Figure 6 shows a descriptive diagram of bacteria dynamics, with the terms captured for each of our equations. Intracellular bacteria (Equation 15) grow at a maximal ratea19with logistic Hill kinetics accounting for a maximal carrying capacity of a macrophage. Extracellular bacteria (Equation 16) become intra-cellular when a macrophage becomes chronically infected at an assumed threshold of N/2 bacteria, and hence this represents a gain term for the intracellular bacteria. Bursting of macrophages (k17) adds to the extracellular subpopulation. To account for loss of intracellular bacteria due to various killing mechanisms, we assume each killed MI to hold an ‘‘average’’ number of bacteria, given by NAVG (,¼N). The corresponding gain in extracellular bacteria depends on the mechanism of killing: while Fas-FasL–induced apoptosis (k14a) releases all intracellular bacteria, TNF-induced apoptosis (k14b) eliminates approximately 50% of the bacteria within the macrophage, and this is shown by the Nfracamultiplier in the BE
(extracellular bacteria) equation (Equation 16). CTL activity (k52) kills virtually all the intracellular bacteria, and does not add on to the BE (extracellular bacteria) population. Lastly, we assume that natural death of MIs also releases all intracellular bacteria, and this is modeled as a constant turnover of the bacteria (lIBI) from intra-cellular to extraintra-cellular. Extraintra-cellular bacteria grow at a maximum
rate a20. They are taken up and killed by activated and resting
macrophages at rates k15and k18, respectively. Figure 6.Bacteria Dynamics
dBI
dt ¼a19BI 1 B2
I B2
I+ðNMIÞ2 !
+k2 N 2
MR BE BE+c9
k14aNMI
ðTC+w3T1Þ
MI
ðTC+w3T1Þ
MI +c4
!
k17NMI B2
I B2
I+ðNMIÞ2 !
k14bNMI
rFa
rFa+f8I10+s4b
k52NMI
TCðT1T1+cT1Þ+w1T1
MI
TCðT1T1+cT1Þ+w1T1
MI +c52
0 B B B @ 1 C C C A
ltmTNFMINfracRS
ð1rÞFr
ð1rÞFr+stmTNFMI
MIlIBI
ð15Þ
dBE
dt ¼a20BEk15MABEk18MRBE+k17NMI B2
I B2
I+ðNMIÞ2 ! k2 N 2 MR BE BE+c9
+k14aNðNf raccÞMI
ðTC+w3T1Þ
MI
ðTC+w3T1Þ
MI +c4
!
+k14bNðNf racaÞMI
rFa
rFa+f9I10+s4b
+ltmTNFMINfracRS
ð1rÞFa
ð1rÞFa+stmTNMMI
MI+lIBI
ð16Þ
Representing soluble and transmembrane TNF in the model.sTNF is produced predominantly by cells of the macrophage lineage upon infection or exposure to bacteria or bacterial products [49]. Other cell types producing sTNF include T cells and NK cells [50]. Stimuli for sTNF production also include chemokines or cytokines (CCL3, IL-1) and also cellular stress responses such as hypoxia, oxygen radicals, and temperature shock.
Our previously published models of Mtb infection simulated cell recruitment as a function of MAs and MIs, the main producers of chemokine and sTNF. In our most recent model [31], TNF was explicitly modeled in its soluble form. A TNF-dependent recruitment term for both macrophages and T cells was included, while maintaining previous terms to account for additional recruitment not dependent on TNF [6]. Here we modify the existing model to include tmTNF and its effects (see Table 1). TNF (labeled as Fa)
represents the dynamics of total sTNF and tmTNF in the system. Using the model, we investigate how different percentages of total TNF cleaved (i.e., sTNF) affect infection progression. We updated the model equations to address tmTNF effects on cell activation and apoptosis, based on Table 1. A direct effect of tmTNF in T cell activation (both through TNF receptors and tmTNF reverse signal-ing) is included in the equation for T0 and T80 (bold term):
+a2T0 MA MA+c15
1+d ð1rÞFa
ð1rÞFa+stmTNF
:
The strength of tmTNF effect on T cell activation through TNFR1 and TNFR2 is represented in the model by the coefficientd.
We also add new terms representing apoptosis or cell loss induced by anti-TNF antibody binding to tmTNF on macrophages [19,20] and T cells [51]. The cell-loss terms for both MIs and MAs, as well as lymphocytes, are implemented as follows
ltmTNF
ð1rÞFa
ð1rÞFa+stmTNF
½MA;MIor ef f ector Ts
These terms are present in the mathematical model only during anti-TNF antibody treatment simulations. The fraction of intra-cellular bacteria released in the extraintra-cellular domain due to tmTNF-induced apoptosis of MIs is likely very small [25]. A new term describes it by multiplying the number of MIs that die by a fraction of intracellular bacteria being released.
Under pathological conditions (chronic inflammatory states), the presence of anti-TNF antibodies (and not TNF receptor fusion molecules) and subsequent binding to tmTNF can induce activation of the complement cascade (due to high concentration of Abs) [52] and apoptosis induced by reverse signaling through tmTNF binding [19]. Activation of complement cascade is supported by data on Crohn’s disease, and it might not be a mechanism shared among all the TNF-related pathologies (such as rheumatoid arthritis and ankylosing spondylitis). The likely consequence of triggering the
complement cascade is the release of intracellular bacteria, while apoptosis kills most of the intracellular bacteria [53]. A direct ‘‘downregulation’’effect of macrophage activation through tmTNF reverse signaling (macrophage anergy or LPS resistance) is included in the macrophage activation term (k3) as follows (bold term):
k3MR I
c
Ic+f1I4+f3ð1rÞFa+s1
BT+bFa BT+bFa+c8
:
We do not directly include LTain the model, but we indirectly
account for LTa-dependent recruitment of macrophages and
lymphocytes during anti-TNF therapy (namely TNF receptor fusion protein), since TNF receptor fusion protein binds LTawhile anti-TNF
antibody does not (see Table S3). We differentiate the two treatments by downregulating all TNF-independent recruitment terms during receptor fusion treatment simulations
Computer simulations. Once we derive the model and estimate parameters, we solve the system of 16 nonlinear ordinary differential equations to obtain temporal dynamics for each variable. To this end, we used Matlab version 7.1.0.183 (R14) Service Pack 3 (The Mathworks) platform and its numerical methods together with a computer code using a different solver written by our group.
As discussed previously [28,29,31], we chose total bacterial load as a marker of disease, where bacterial levels can distinguish between two different scenarios: latent infection (steady state, low stable bacterial levels) and active disease (unchecked bacterial growth).
Parameter estimation. Before simulations can be performed, parameters must be estimated from literature sources or by mathematical means. Values for most model parameters are estimated from published experimental data or data generated from our group. Data from human studies and Mtb experiments are favored over mice and other mycobacterial species, respectively. Where no appropriate data is available for a given parameter, we conduct uncertainty analysis to obtain a range within orders of magnitude. A detailed description of techniques used to evaluate model parameters, as well as a listing of parameters already estimated can be found in work previously published by our group [31]. All parameters newly estimated for the purpose of this work are listed in Table S6, together with parameters previously estimated. All parameters have been estimated using approaches similar to those described in Wigginton et al. [28].
Parameter values represent mechanisms in the host–pathogen system, and these were estimated from many different experimental sources. There is great variation that likely exists among them. In previous work [31], we explored wide ranges on these parameter values to determine how the system changes when values change. A group of parameters were identified as being key determinants between the host–pathogen system achieving latency or going to active disease (see Table I and II in [31]). These different infection states are obtained by varying parameter values, as discussed in the next section. The set of parameters that we used to generate the simulation of latency (Figure 1) is given in Table S6. Here, we vary only a small subset of these parameters to obtain an active disease simulation (see legend of Figure 2 for details).
Uncertainty and sensitivity analysis.There is an intrinsic biological and experimental variability in rates measured from in vivo or in vitro studies. Further, some interactions in the Mtb–host system are not currently measurable, particularly at the level of the lung granuloma. This complicates accurate estimation of model parame-ters (baseline values are unknown).
We quantify the importance of each TNF-related mechanism involved directly and indirectly in the infection dynamics using both uncertainty and sensitivity analyses as described previously [31]. The statistical techniques of latin hypercube sampling (LHS) and partial rank correlation (PRC) [54–57] when combined guide our under-standing as to how and to what extent variability in parameter values affects infection outcomes. We employ the LHS method to control effects of uncertainties in our parameter estimation by varying all the TNF-related parameters simultaneously. LHS allows for simultaneous random, evenly distributed sampling of each parameter within a defined range (stratified Monte Carlo technique). The sampling is done by varying each parameter over a wide range (up to a factor of 1,000 above and below reported literature data or mathematical estimates) and performing a large number of computer simulations (n
The PRC method allows us to correlate the variability observed using the LHS method and to determine which parameters are responsible for the variation in outcomes. PRC coefficients (PRCCs) are between1 and 1 and have a standard p-value that indicates significance. A negative PRC coefficient indicates that a decrease in the value of that parameter results in an increase of the bacterial load. A positive PRC coefficient indicates that a decrease in the value of that parameter results in a decrease of the bacterial load. PRC coefficients also evaluate temporal changes in the significance of these parameters as they relate to bacterial load at different times during the infection. Statistical significance of these correlations is assessed by a generalizedt-test (see the‘‘Statistical analysis’’section). For example, the rate of TNF production by Th1 cells (a32) is always very significant and negative (see Table 2): if we lower TNF production by Th1 cells, bacterial load increases.
Virtual deletion and depletion. As a way to validate the mathematical model, we recapitulate experimental approaches such as TNF gene knockouts and TNF neutralization studies. These can be simulated with our mathematical model as virtual deletion and depletion simulations, respectively. Virtual deletions remove an element from the system at day zero while virtual depletions mimic experimental conditions where an element can be depleted or neutralized via antibody treatment at any time during the infection. We can selectively delete or deplete sTNF or transmembrane TNF (tmTNF) by varying the parameterrprior to infection (Figure 3A) or after latency is achieved (i.e., at day 500 post-infection, Figure 3B). Setting r to zero mimics sTNF deletion/depletion, while tmTNF deletion/depletion is obtained by settingrto 1. We restrict our results to virtual TNF deletion/depletion studies to investigate the role of TNF during active and latent TB. Previous deletion and depletion experiments were performed for all of the relevant cells and cytokines in the mathematical model (see [31] for details).
When all the TNF is deleted from the system on the same day that infection is initiated, the system goes to active disease (see Figure 7, TNF-/-). This occurs with low-level cellularity, i.e., macrophage numbers are almost an order of magnitude lower (mainly infected and activated) than when disease occurs in the wild-type scenario (see Figure 2). This is consistent with studies that report diffuse infection, where disease is spread throughout a large lung area, resulting in an overall lower cellular density and widespread tissue damage [2–4,11]. Upon total TNF depletion (performed at day 500 post-infection), the system progresses to a disease state in fewer than 100 days (see Figure 7, TNF depl). Depletion reduces the total number of macrophages to 25% (unpublished data), consistent with recent studies [6]. T cells are
depleted upon TNF removal mainly because they turn over and are not quickly replenished: they then recover due to compensatory recruitment by other TNF-independent mechanisms in response to high bacterial levels. Thus, the depletion simulations suggest that although TNF is present at extremely low levels during latency (;0.12 pg/mL of granuloma homogenate, see Figure 1), this low level is necessary and sufficient for control and maintenance of infection. This finding is further confirmed later in the anti-TNF treatment simulations. Our results also indicate that control of infection is a dynamic, TNF-dependent process involving continual cell turnover, an outcome that is consistently observed across experimental studies [8].
Simulated TNF blockade in tuberculosis infection: Anti-TNF antibody versus TNF receptor fusion. The US Federal Drug Administration monitors the safety of TNF inhibitors through its Adverse Event Reporting System (AERS), a surveillance system to which drug manufacturers are required to submit reports of adverse events and to which health care professionals and consumers voluntarily send adverse event reports. Wallis et al. [27] published a systematic study of granulomatous infections associated with inflix-imab and etanercept contained in AERS, using reports from 1998 (when the two drugs were approved) through the third quarter of 2002. TB is the most frequent disease, reported in;144 per 100,000 patients (infliximab-treated patients) and in;35 per 100,000 patients (etanercept-treated patients). Although the clustering of adverse events reported shortly after initiation of infliximab treatment is consistent with reactivation of latent infection, the number of infected individuals with latent TB is not reported in the AERS database for both treatments. There is a possibility that some TB cases result from infection after therapy is initiated. Anti-TNF antibody treatment (such as with infliximab) targets both sTNF and tmTNF. We also account for additional cell loss due to tmTNF engagement by the drug. TNF receptor fusion treatment (such as with etanercept) targets sTNF and LTa3. We capture the action of these two TNF neutralizing drugs by including an additional loss term in the TNF equation. This term accounts for concentration-dependent loss of TNF as a function of a drug’s half-life, dissociation rate, bioavailability, and treatment regiment. Table S3 shows data for pharmacokinetics (PK), pharmacodynamics (PD), and treatment protocols (doses and administration) for both drugs. Since our modeling approach describes average dynamics within a granulom-atous tissue sample in the lung (see the section‘‘Measure units and modeling space’’for details), we define percentages of neutralized Figure 7.Simulations of Total TNF Deletion and Depletion
Mathematical model simulations of bacterial loads during TNF deletion (TNF/-) and depletion (TNF depl). They-axis represents total bacterial load.
Latency is our wild-type control (see Figure 1). Note,r¼0.95 for these simulations.