www.nonlin-processes-geophys.net/16/393/2009/ © Author(s) 2009. This work is distributed under
the Creative Commons Attribution 3.0 License.
in Geophysics
Deep bore well water level fluctuations in the Koyna region, India:
the presence of a low order dynamical system in a seismically
active environment
D. V. Ramana1, A. Chelani2, R. K. Chadha1, and R. N. Singh1
1National Geophysical Research Institute, (CSIR), Uppal road, Hyderabad, India 2National Environmental Engineering Research Institute, (CSIR), Nagpur, India
Received: 2 July 2008 – Revised: 5 November 2008 – Accepted: 6 November 2008 – Published: 11 May 2009
Abstract. Water level fluctuations in deep bore wells in the vicinity of seismically active Koyna region in western India provides an opportunity to understand the causative mech-anism underlying reservoir-triggered earthquakes. As the crustal porous rocks behave nonlinearly, their characteristics can be obtained by analysing water level fluctuations, which reflect an integrated response of the medium. A Fractal di-mension is one such measure of nonlinear characteristics of porous rock as observed in water level data from the Koyna region. It is inferred in our study that a low nonlinear dynam-ical system with three variables can predict the water level fluctuations in bore wells.
1 Introduction
Water table fluctuations in the upper crust represent an inte-grated response of the medium in a region, induced due to prevailing stresses. Thus, any variation in the water table be-fore, during, or after an earthquake offers important clues in understanding the genesis of earthquakes. The piezometric head in a well contains signals of boundary stresses active around the zone of influence of the well, body forces ac-tive within this zone besides the hydrological properties of the affective porous media, such as porosity and permeabil-ity, physical and chemical properties of matrix and fluids, etc. The well influence zone, thus, needs to be treated as a complex multiphase and multi-component evolving media. It would be highly simplifying to assume such a media as linear
Correspondence to:D. V. Ramana
poroelastic, a frequent assumption underlying many recent studies on interpretation of water levels in wells (Grecksch et al., 1999; Chadha et al., 2005). The water level fluctua-tions due to Spitak Earthquake (Gavrilenko et al., 2000), and the hydrological response due to earthquakes in central Japan (Matsumoto et al., 2003a, b) have been earlier studied. In this paper, we made an attempt to study the nature of the media in the Koyna region by applying non-linear analysis of the water level variations observed due to a local earthquake in the region. We performed a simple test to know whether the dimension of this water level time series is fractal and what is the nature of the underlying dynamical system.
2 Seismological and geological set up of the Koyna region
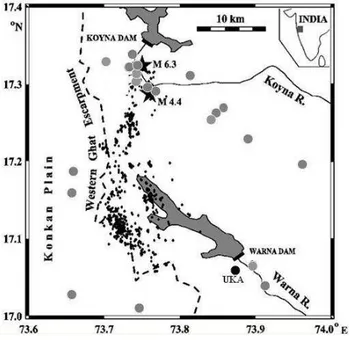
Fig. 1. Map showing Koyna-Warna region in western India. The 21 bore wells drilled in the region are shown in bold circles. Small dots are the epicenters of the earthquakes recorded for one year in the seismically active Koyna region.
such activity over such a long period. This would mean that, other than reservoir loading and unloading, there are other factors influencing the triggering phenomenon. These factors could be categorised in terms of deeper sources of inducing stresses or changes in the constitution of the media. This re-gion lies in the Deccan Traps rocks of 67.4 Ma (Duncan and Pyle, 1988) comprising of several sequences of lava flows. The thickness of the Deccan Traps varies from 1.5 km in the Koyna region to less than 100 m in the peninsular shield in central India (Kailasam et al., 1976). The massive, compact lava sequences have low permeability but there is signifi-cant migration of water through faults, fractures, columnar jointing or through vesicles. Several lineaments have been mapped from Landsat satellite imageries in the region; two NNE-SSW faults are delineated from Koyna in the north to Warna in the south. Cretaceous sediments with a basement complex of Proterozoic times underlie the Deccan trap rocks. The constitutive relationship for such inhomogeneous and fractured materials would thus be quite complex. Water level fluctuations will have signatures of this complexity.
In our work, we analysed the water level variations in a bore well drilled in the region, as this indicator of tectonics will respond to porous structures of the region. Thus, one would expect its value to lie within 2 and 3. This has been borne out by the work reported in sequel.
dam and the well is nearly 1 km down stream. Battery pow-ered pressure transducers (OTT-Hydrometrie, 1992) were in-stalled in these bore wells. These transducers read the hy-draulic pressure of the water column above the sensor ele-ment with a resolution of±1 mm at a sample rate of 15 min. As changes in rock stresses occur, these are partly transferred into pore pressure. Changes in pore pressure are transferred into changes in the depth of the ground water level as seen in the observation well. The UKA well data show very good re-sponse to earth tides. Signal-to-noise ratio of the largest tidal constituent M2 are above 50 for most recordings, with peak-to-peak tidal amplitudes of up to 24 cm. Presence of tidal sig-nals in UKA wells indicate that it is connected to a confined, that is, hydraulically locked and fully water-saturated aquifer. Accordingly, the well-aquifer system is capable of detecting weak pore pressure anomalies caused by crustal strain of the order of nanostrain (Gupta et al., 2000).
4 Time series analysis methodology
The correlation dimension describes the complexity of the system by providing the information about the dimension of the attractor. It may be related to the minimum number of variables describing the dynamic system (Sugihara and May, 1990). Several methods have been given in the liter-ature to compute the correlation dimension of the time series data (Grassberger and Procaccia, 1983; Theiler, 1987). The most commonly used algorithm of Grassberger and Procac-cia (1983) is used in our study to compute the correlation dimension of water table variations. The algorithm is based on the phase space reconstruction of the time series. Ac-cording to the Takens embedding theorem (Takens, 1981), anm-dimensional phase space can be reconstructed from the single available time seriesxi of water table variations as, Xi =(xi, xi+τ, xi+2τ,− − −−, xi+(m−1)τ) (1) whereτ and mare the time delay and embedding dimen-sion, respectively. The above delay coordinate embedding provides a one-to-one image of the original system for suf-ficiently chosen m(Takens, 1981). For an m-dimensional phase space, the correlation dimension is obtained by the correlation integralC(r) denoting the fraction of the pairs of vectors with the distance smaller than a chosen radiusr as,
C(r)= lim n→ ∞
2 n2−n
n X i6=j
H r−Xi −Xj
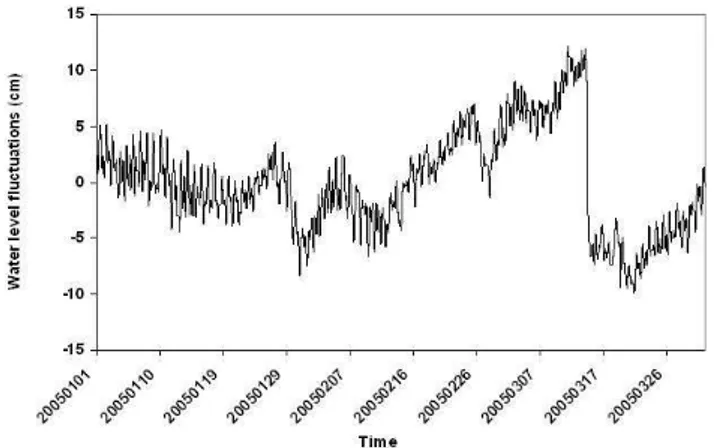
Fig. 2. Water level fluctuations with time (during January–March 2005 at Ukalu after removing the tidal effects).
whereH (x)is the Heviside function defined asH (x)=1 for x>0 andH (x)=0 forx≤0, vectors Xi and Xj can be ob-tained using Eq. (1),||.||denotes the Euclidean distance be-tween the two vectors,nis the number of data points andr is the radius of the sphere centered onXi. It has been shown that for sufficiently small values ofrand in the limit of infi-nite amount of data,C(r)follows a power law asC(r)∼rD, whereDis the correlation exponent.Dis generally obtained from the slope of the graph of logC(r)against logrover a sufficient range of small inter distances and over the partic-ular scaling region ofr. The presence of chaos in the sys-tem can be inferred by plotting the correlation exponentD against the respectivem. If it saturates to some finite value, the system generally considers being governed by determin-istic dynamics. The saturation value of the correlation expo-nent is the correlation dimension of the attractor of the time series. If the saturation occurs at the small value of correla-tion exponent, then it is considered that the process generat-ing the time series is governed by low-dimensional dynam-ics. The increasing correlation exponent without any satu-ration indicates that the process generating the time series is stochastic.
The computation of correlation exponent is influenced by the selection of the time delayτ. It should not be too large as the system may lose memory of its initial state. For small values ofτ, the resulting phase space would be highly depen-dent and the new information about the evolution of the sys-tem cannot be produced (Frazer and Swinney, 1986). Hence, choice ofτ should provide low correlation between adjacent points in the embedded phase space. The computation of mutual information betweenxi andxi+τ is suggested to es-timate the reasonableτ (Frazer and Swinney, 1986), which can be given as,
I (τ ) = X i,i+τ
p(xi,xi+τ) ln
p(xi,xi+τ) p(xi)p(xi+τ)
(3)
Fig. 3.Mutual information function for water level fluctuations time series.
wherep(xi)andp(xi+τ)are the probabilities to find a time series value in theith and i+τth interval, respectively, and p(xi, xi+τ)is the joint probability that an observationxifalls into theith andxi+τ into thei+τth interval. These probabil-ities can be obtained by plotting the histogram of the data. After obtaining the mutual information function, the usual practice is to plot this function against varyingτ. The reason-able value ofτ can be selected by locating the time at which the first minimum in the mutual information function occurs. The details can be found in Frazer and Swinney (1986).
5 Results and discussions
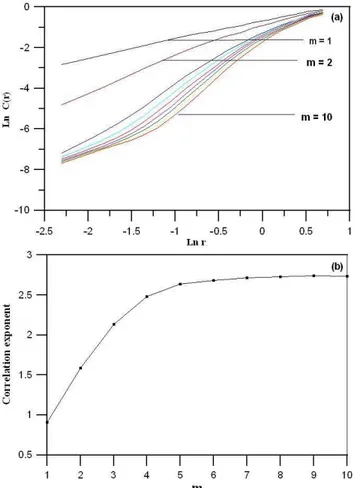
Fig. 4. (a)Correlation integralCvs.rfor the different values ofm.
(b)Correlation dimension of the water level fluctuation time series.
the correlation dimension estimation could be attempted for preliminary investigation of character of chaos in the hydro-logical data. To compute the correlation dimension, the delay time was computed using the mutual information function for different lags (Fig. 3) and the lag time, where the first minimum in the mutual information function occurs, can be considered as the choice of optimalτ. It is observed that the first minimum occurred at lag 24. The correlation integral is computed against differentrandmvalues, as discussed ear-lier. Fig. 4a shows the relationship between some values of log(r)and logC(r)for variousmranging from 1 to 10. The slopes are computed and then plotted in Fig. 4b as correlation exponent against variousm. It is observed that correlation exponent increases withmand at a certainm(∼6) it gets sat-urated. The saturation value of correlation exponent, called correlation dimension, is approximately 2.7. To describe the dynamics of the water table variations, the minimum number of required variables is 3. The number of variables sufficient to embed the phase space of the attractor, in case of water table variations, is 6. The low and non-integer dimension shows the presence of low dimensional chaos in water table variations. Costain and Bollinger (1996) have inferred fractal
being 2.7 implies that the underlying dynamics of the water level fluctuation is non-linear. These values would give clues for construction of non-linear dynamical systems to explain and predict water table fluctuations. Thus we need a low di-mensional nonlinear dynamical system with three variables to describe and predict the water level fluctuations.
6 Conclusions
The water levels in the wells in porous crustal rocks of Koyna region respond to changes in the prevailing stress/strain regime. The present analysis of the water level data showed that the fractal dimension of the underlying nonlinear sys-tem in 2.7 indicating that a minimum number of variables describing the system would be 3. The tectonic system is shown to behave as a low dimensional non-linear dynamical system to construct a prediction model for water level varia-tion in bore wells in this region.
Acknowledgement. The authors are thankful to the Director, National Geophysical Research Institute (CSIR), Hyderabad for his keen interest and permission to publish this work. RNS is grateful to CSIR for awarding of an Emeritus Scientist Scheme.
Edited by: G. Zoeller
Reviewed by: one anonymous Referee
References
Chadha, R. K.,Srivastava, K., and Kuempel, H. J.: Earthquake re-lated changes in well water level and their relation to a static de-formation model for the seismically active Koyna-Warna region, India, edited by: Rummel, F., Rock Mechanics with emphasis on stress, Oxford &IBH Publishing Co, New Delhi, 135–150, 2005. Costain, J. K. and Bollinger, G. A.: Climatic changes, streamflow, and long-term forecasting of intraplate seismicity, J. Geodynam-ics, 22(1/2), 97–117, 1996.
Duncan, R. A. and Pyle, D. G.: Rapid eruption of Deccan flood basalts at the Cretaceous/Tertiary boundary, Nature, 333, 841– 843, 1988.
Fraser, A. M. and Swinney, H. L.: Independent coordinates for strange attractors from mutual information, Phys. Rev. A., 33, 1134–1140, 1986.
Grassberger, P. and Procaccia, I.: Measuring strangeness of strange attractors, Physica D. 9, 189–208, 1983.
Grecksch, G., Roth, F., and Kuempel, H. J.: Coseismic well level changes due to the 1992 Roermond earthquake compared to static deformation of half space solutions, Geophys. J. Int., 138, 470–478, 1999.
Gupta, H. K., Radhakrishna, I., Chadha, R. K., Kuempel, H. J., and Grecksch, G.: Pore pressure studies initiated in area of reservoir-induced earthquakes in India, EOS, Trans. Am. Geophys. Un., 81(14), 145–151, 2000.
Gupta, H. K.: A review of recent studies of triggered earthquakes by artificial water reservoirs with special emphasis on earthquakes in Koyna, India, Earth Sci. Rev., 58, 279–310, 2002.
Kailasam, L. N., Reddy, A. G. B., Joga, M. V., Rao, Y. K., Satya-murthy, Y. K., and Murthy, B. P. R.: Deep electrical resistivity soundings in the Deccan Trap region, Curr. Sci., 45, 9–13, 1976. Matsumoto, N., Kitagawa, G., and Roeloffs, E. A.: Hydrological response to earthquakes in the Haibara well, central Japan – I. Groundwater level changes revealed using state space decompo-sition of atmospheric pressure, rainfall and tidal responses, Geo-phys. J. Int., 155, 885–898, 2003a.
Matsumoto, N. and Roeloffs, E.: A Hydrological response to earth-quakes in the Haibara well, central Japan – II. Possible mecha-nism inferred from time-varying hydraulic properties, Geophys. J. Int., 155, 899–913, 2003b.
OTT – Hydeometrie, ORPHEUS Pressure probe with integrated data collector, Operation Instructions, Ref. No. 55, 410.000 B.E., 37 pp., Kempten, 1992.
Pandey, A. and Chadha, R. K.: Surface loading and triggered earth-quakes in the Koyna-Warna region, Western India, Phys. Earth Planet. Int., 139, 207–223, 2003.
Sivakumar, B.: Chaos theory in hydrology: Important issues and interpretations, J. Hydrol., 227, 1–20, 2000.
Sivakumar, B.,Phoon, K. K., Liong, S. Y., and Liaw, C. Y.: A sys-tematic approach to noise reduction in observed chaotic time se-ries, J. Hydrol., 219(3–4), 103–135, 1999c.
Sugihara, G. and May, R. M.: Nonlinear forecasting as a way of dis-tinguishing chaos from measurement error in time series, Nature, 344, 734–741, 1990.
Takens, F.: Detecting strange attractors in turbulence, in: Dynami-cal Systems and Turbulence, edited by: Rand, D. A. and Young, L. S.: Lecture Notes in Mathematics, 898, Springer, Berlin, 366– 381, 1981.