doi:10.5194/nhess-12-813-2012
© Author(s) 2012. CC Attribution 3.0 License.
and Earth
System Sciences
The relation between seismicity and water level changes in the
Koyna–Warna region, India
J. Pavan Kumar1, D. V. Ramana1, R. K. Chadha1, C. Singh2, and M. Shekar1
1National Geophysical Research Institute, Council of Scientific and Industrial Research, Hyderabad 500007, India 2Department of Geology and Geophysics, Indian Institute of Technology Kharagpur, West Bengal 721302, India
Correspondence to:J. Pavan Kumar ([email protected])
Received: 19 July 2011 – Revised: 17 January 2012 – Accepted: 18 January 2012 – Published: 30 March 2012
Abstract. The analysis of the cross-correlation between
the seismicity and the daily water level changes in both the Koyna and Warna (India) reservoirs is studied. The time lag between both datasets is calculated and is applied to estimate the hydraulic diffusivity. The range of the hydraulic diffusiv-ity estimated between 0.1 m2s−1and 10 m2s−1.
1 Introduction
Induced seismicity has been observed in a man-made reser-voir. Previous researchers (Simpson et al., 1988; Roeloffs, 1988) suggested that the major bursts in seismicity at the reservoir fare of two types, (1) rapid response, i.e., the seis-micity immediately follows reservoir impoundment as a di-rect effect of loading, and (2) delayed response, i.e., seismic-ity can also occur a long time after impoundment. In this last case, the seismicity can be correlated with the water level or with the rapid increase in the water level. Type 1 seismicity is dominated by the elastic response to the reservoir load, while type 2 is dominated by the pore pressure diffusion process. There are substantial differences in the temporal and spatial characteristics of the response of the crust to these processes and it should be possible to identify the dominant mechanism in some cases, through a comparison of changes in seismicity with the water level in the reservoir (Simpson et al., 1988). The examples for type 1 are at Manic-3 (Leblanc and Anglin, 1978), Monticello (Zoback and Hickman, 1982) and Nurek (Simpson and Negmatullaev, 1981) and type 2 are at Oroville (Toppozada and Morrison, 1982; Gupta and Rastogi, 1976), and Aswan (Kebeasy et al., 1987). The reservoir has often gone through a number of apparently similar annual cycles in water level change without any increased seismicity be-fore the dominant seismicity occurs. Loading is expected to
induce seismicity in a tensional stress regime (by adding to the tensional field), whereas unloading will have the same effect in a compressional stress regime. Gupta (1983) sug-gested that earthquakes of magnitude M≥5 are expected when the water loading rate exceeds 40 ft per week. On the other hand, Simpson and Negmatullaev (1978) observed in the Nurek Dam area, southern former USSR, an increase in seismic activity with the lowering of water levels in the reser-voir.
Continuous reservoir triggered seismicity has been ob-served since 1963 in the Koyna–Warna region, India after the impoundment of the Koyna reservoir in 1961 and Warna reservoir in 1985. The mechanism of the reservoir induced seismicity in this region was studied by Gupta (2002) and it is due to the diffusion of pore pressure from the reservoirs. The stress memory i.e., in terms of exceeding the previous water level maxima, was found to be the most important fac-tor for the occurrence of high seismicity in the region (Simp-son and Negmatullaev, 1981; Gupta, 1983). The reservoir triggered earthquakes have special features like highbvalue, increase of seismicity with an increase in water level (Gupta et al., 1972a, b). Thebvalue is calculated using Guttenberg-Richter relationship.
logN=a−bM (1)
whereN is the number of earthquakes,M is magnitude,a
Fig. 1. Location of the Koyna–Warna region. Stars denote the location of the earthquakes of magnitude greater than 5.
earthquakes which would have occurred later in time are trig-gered. The empirical correlation between seismicity, rainfall and rivers has been made (Kafri and Shapira, 1990). Such observations by early workers can be interpreted to suggest increases in fluid pressure are transmitted downward into a crystalline permeable upper crust where they trigger earth-quakes. The best correlations between the pore pressure diffusion and seismicity are those associated with reservoir induced seismicity. Talwani and Acree (1984/1995) anal-ysed the cases of induced seismicity, which are interpreted as dominated by the pore pressure diffusion and found the hydraulic diffusivity is usually in the range of 0.5 m2s−1to 5.0 m2s−1. Recently the vertical diffusivity of the Koyna has been given by Telesca (2010) bases on the analysis of the cross correlation between seismicity and the water level in the Koyna reservoir as 0.2 m2s−1. In this work, the cross-correlation between the water level time series with the earth-quake activity in Koyna and Warna reservoirs have been stud-ied and on the bases of the correlation coefficient the range of the hydraulic diffusivity is calculated.
Fig. 2. (a)The Koyna reservoir water level from 1967 to 2008.
(b)The Warna reservoir water level from 1985 to 2008.
2 Data analysis
Earthquakes in the Koyna–Warna region in India are con-fined to an epicentre region of about 30×20 km2 (Gupta, 2002). Figure 1 shows the location of the Koyna–Warna re-gion and also the location of the epicentres of the earthquakes of a magnitude greater than 5 (M >5).
The water levels from the time of impoundment, 1967 in Koyna reservoir and 1985 in Warna reservoir, are shown in Fig. 2. From this Fig. 2, it is clear that the water-level varia-tions in the reservoirs show the annual cycle of loading and unloading. The Koyna reservoir water-level data and the seis-micity of this region from 1997 to 2008 have been plotted in Fig. 3.
The correlation between propagation of pore pressure front and depths, and the occurrence of earthquakes of mag-nitudes exceeding 4.5, suggests that the pore pressure diffu-sion is playing a key role in controlling the occurrence of earthquakes associated with Koyna and Warna (Pandey and Chadha, 2003; Talwani, 2000).
610 620 630 640 650 660 670 19 9701 01 19 9801 01 19 9901 01 20 0001 01 20 00 12 31 20 0112 31 20 0212 31 20 0312 31 20 0412 30 20 0512 30 20 0612 30 20 07 12 30 20 0812 29 W a te r l e v e l (m) 0 10 20 30 40 50 60 N o. of E a rt hqua k e s
Fig. 3. The Koyna reservoir water levels and the seismicity of the
region from 1997 to 2008.
Fig. 4. (a)The maximum correlation coefficient for different years.
(b)The time lag for different years. (c)The diffusivity values for different years.(d)The number of events for different years.
To compare the correlation coefficients between water level and seismicity in Konya reservoir and in Warna reser-voir, these quantities are also calculated. The results taken from recent arbitrary datasets i.e., from 2000 to 2008 reser-voir water level datasets and their correlation coefficients with the seismicity in Konya and in Warna reservoirs are shown in Table 2. From Table 2 it is seen that the corre-lation coefficient between the seismicity and the water level data in Warna reservoir is either equal or greater than the corresponding correlation coefficient in the Konya reservoir. These results show that the seismicity in the recent year is closer to Warna than Koyna reservoir i.e., Warna reservoir is more dominating than Koyna reservoir. The temporal mi-gration of seismicity from Koyna to Warna in the region is discussed by Rao and Singh (2008) and these results also support the active role of Warna reservoir of recent years.
Fig. 5. Cross correlation between Koyna reservoir water level and
the seismicity of the region for(a)1997 (b) 2001(c) 2004 and
(d)2006.
Table 1.The correlation coefficient, time lag (for Koyna reservoir
and Warna reservoir with the seismicity of the region).
Year Koyna-coef. Lag Warna-coef. Lag
2000 0.14 3 0.15 3
2002 0.06 212 0.06 223
2004 0.09 112 0.09 110
2006 0.11 133 0.24 88
2008 0.15 13 0.25 5
Rao and Singh (2008) already discussed the temporal mi-gration of the seismicity; therefore, we analyse the correla-tion coefficient for both regions separately. The region is divided into two parts by the line at 17.3◦N. Koyna region is above and Warna region below and we calculated the corre-lation coefficients of Koyna seismicity with the water level of Koyna reservoir and of Warna seismicity with the water level of Warna reservoir. As an example, the correlation coeffi-cient in the year 2008 and the time lag for both cases are calculated to be 0.14, 0.20 and 13 days, 45 days, respec-tively. The results reveal that the correlation coefficient for the Warna region is higher than the Koyna region, indicating that Warna reservoir is more dominating than Koyna reser-voir. In fact migration of the seismicity towards the Warna region occurred.
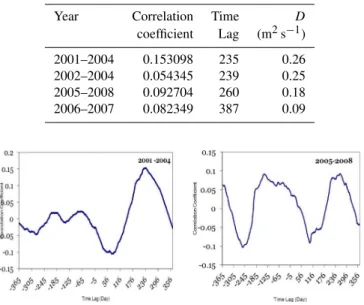
Table 2. The correlation coefficient, time lag and hydraulic diffu-sivity in different time intervals (years).
Year Correlation Time D
coefficient Lag (m2s−1) 2001–2004 0.153098 235 0.26 2002–2004 0.054345 239 0.25 2005–2008 0.092704 260 0.18 2006–2007 0.082349 387 0.09
Fig. 6.Cross correlation between the reservoir water level and the
seismicity of the region(a)2001–2004(b)2005–2008.
coefficient and the time lag is shown in Table 2. To see the consistency in the correlation coefficient, we also calculated the correlation coefficient and time lag for two more datasets (2006–2007) and (2002–2004), respectively. The maximum cross correlation coefficient and the time lag is shown in Ta-ble 2.
The variation in the hydraulic diffusivity of the region with time is calculated based on the time lag of each year. The diffusivityD obtained by Saar and Manga (2003) with the assumption that the periodic term is zero during the failure time in the Diffusion equation is
D= h
2
2ωt2 (2)
wherehis the mean depth of the seismic events,ωis 2π/T
whereT is 1 yr andtis time the lag. The diffusivityDof the Koyna region is given by Telesca (2010) as 0.2±0.1 by us-ing the time lag of 223 days obtained from the 2001–2004 datasets of Koyna reservoir water-level data. The present work shows the large variation of the diffusivity value D. The numerical results of the diffusivity is calculated for all the time intervals and shown in figure which shows a large range of the diffusivity. For the datasets from 3 to 4 yr the diffusivity value is mostly low and ranges from 0.1 m2s−1 to 1.0 m2s−1. But for one year sets, the diffusivity values range from 1 m2s−1to 10 m2s−1. From most of the cases, we observed that all calculated correlation coefficient values shows 95 % significance. The total from all the results ob-tained from these studies, it is concluded that the variation in the diffusivity value is very high and the range is from
Fig. 7. The maximum correlation coefficients for Koyna and Warna
at different time periods.
0.1–10 m2s−1. These values for diffusivity are within the characteristics range (0.1 to 10 m2s−1) for the seismic hy-draulic diffusivity found by Talwani and Acree (1985).
3 Conclusions
The analysis of the water levels in both reservoirs and the seismicity is shown and the cross correlation between the reservoir water levels and the seismicity suggest different values of time lags. We have observed hydraulic diffusiv-ity (D) as 0.1 m2s−1to 10 m2s−1for the region. The results indicate the active role of Warna reservoir in recent day’s seismic activity.
Acknowledgements. The authors are grateful to the Director, National Geophysical Research Institute, for his kind permission to pursue the research.
Edited by: M. E. Contadakis
Reviewed by: two anonymous referees
References
Gupta, H. K.: Induced seismicity hazard mitigation through water level manipulation at Koyna, India: a suggestion, Bull. Seismol. Soc. Am., 73, 679–682, 1983.
Gupta, H. K.: A review of recent studies of triggered earthquakes by artificial water reservoirs with special emphasis on earthquakes in Koyna, India. Earth Sci. Rev., 58, 279–310, 2002.
Gupta, H. K. and Rastogi, B. K.: Dams and Earthquakes, Elsevier, Amsterdam, 229 pp., 1976.
Gupta, H. K., Rastogi, B. K., and Narain, H.: Common features of the reservoir-associated seismic activities, Bull. Seismol. Soc. Am., 62, 481–492, 1972a.
Gupta, H. K., Rastogi, B. K., and Narain, H.: Some discrimina-tory characteristics of earthquakes near the Kariba, Kremasta, and Koyna artificial lakes, Bull. Seismol. Soc. Am., 62, 493–507, 1972b.
Kebeasy, R. M., Maamoun, M., Ibrahim, E., Megahed, A., Simpson, D. W., and Leith, W. S.: Earthquake studies at Aswan reservoir, J. Geodynam., 7, 173–193, 1987.
Leblanc, G. and Anglin, F.: Induced seismicity at the Manic 3 Reservoir, Quebec, Bull. Seismol. Soc. Am., 68, 1469–1485, 1978.
Pandey, A. P. and Chadha, R. K.: Surface loading and triggered earthquakes in the Koyna-Warna region, western India, Phys. Earth Planet. Int., 139, 207–223, 2003.
Rao, B. R. and Singh, C.: Temporal migration of earthquakes in Koyna–Warna (India) region by pore-fluid diffusion, J. Seismol., 12, 547–556, 2008.
Roeloffs, E. A.: Fault stability changes induced beneath a reservoir with cyclic variations in water level, J. Geophys. Res., 83, 2107– 2124, 1988.
Saar, M. O. and Manga, M.: Seismicity induced by seasonal groundwater recharge at Mt. Hood, Oregon, Earth Planet. Sci. Lett., 214, 605–618, 2003.
Simpson, D. W.: Triggered earthquakes, Ann. Rev. Earth Planet. Sci., 14, 21–42, 1986.
Simpson, D. W. and Negmatullaev, S. Kh.: Induced seismicity stud-ies in Soviet central Asia, Earthq. Inf. Bull., 10, 208–213, 1978.
Simpson, D. W. and Negmatullaev, S. K.: Induced seismicity at Nurek Reservoir, Tadjikistan, USSR, Bull. Seismol. Soc. Am., 71, 1561–1586, 1981.
Simpson, D. W., Leith, W. S., and Scholz, C. H.: Two types of reservoir induced seismicity, Bull. Seism. Soc. Am., 78, 2025– 2040, 1988.
Talwani, P.: Seismogenic properties of the crust inferred from recent studies of reservoir-induced seismicity – Application to Koyna, Curr. Sci. India, 79, 1327–1333, 2000.
Talwani, P. and Acree, S.: Pore pressure and the mechanism of reservoir induced seismicity, Pure Appl. Geophys., 122, 947– 965, 1984/1985.
Telesca, L.: Analysis of the cross correlation between seismicity and water level in the Koyna area of India, Bull. Seism. Soc. Am., 100, 2317–2321, 2010.
Toppozada, T. R. and Morrison, P. W.: Earthquakes and lake levels at Oroville, California, Calif. Geol., 35, 115–118, 1982. Zoback, M. D. and Hickman, S.: In situ study of the physical