The BrAzIlIAN BIodIeSel ProGrAm ANd fAmIly fArmerS: WhAT
IS The SocIAl INcluSIoN reAlITy IN The BrAzIlIAN SAvANNAh?
1marcus vinicius Alves finco2, Werner doppler3
INTroducTIoN
Global concern for the depredation and exhaustion of natural resources has led governments and scientists around the world to identify alternatives and solutions to the problem. Since the beginning of the 21st century, an international debate has taken
shape, which is currently discussed at 10 out of 10 meetings on sustainable development around the world: biofuels pros and cons (dubois 2008, fAo 2008a, fAo 2008c). from a socio-economic point of view, biofuels1 can positively impact rural
1 Biofuel essentially refers to liquid fuels derived from agricultural crops, used for
transport and energy generation (fAo 2008b).
ABSTRACT
RESUMO
development and diversify the utilization of the local environment, for example, enhancing rural space multi-functionality, where farms are used not only for crop production, but also for eco and rural tourism, and, of course, generating strategies that reduce and alleviate poverty, the so-called ‘pro-poor’ strategies (uN energy 2007, fAo 2008b).
Based on that, in 2004, the Brazilian government launched a national biodiesel program - PNPB (Brasil 2005), which was designed based on a scenario of high oil prices, a growing demand for fuels from renewable sources, and the country’s comparative advantage in natural resources (Nass
1. Trabalho recebido em jun./2010 e aceito para publicação em nov./2010 (n° registro: PAT 10096/ doI: 10.5216/pat.v40i4.10096). 2. universidade federal do Tocantins, departamento de Administração, Palmas, To, Brazil.
E-mail: [email protected].
3. University of Hohenheim, Institute of Agricultural Economics, Stuttgart, Germany. E-mail: [email protected].
Biofuel production has been greatly discussed in Brazil. In 2004, some debates led the country to develop new policies and implement the National Biodiesel use and Production Program (PNPB), with the intent to increase the share of renewable energy and foster rural development. In this context, the present study aims to assess the linkages between family farmers living standard and the adoption of oil seed activity in the Tocantins State, in a region of transition between the Cerrado (Brazilian savannah) and the Amazon rain forest. ranges of socio-economic indicators were collected among smallholders who cultivate Jatropha curcas and Ricinus communis. A factor analysis based on living standard criteria and a non-linear probit model were applied to assess the inclusion of poor rural families in the biodiesel chain. Preliminary results point towards a positive relation between the family degree of deprivation and adoption of oil seed activity, for the Ricinus communis production, and a negative relation, for the Jatropha curcas production.
Key-WordS: Brazilian biodiesel program; family farmers; social inclusion; Cerrado.
o ProGrAmA BrASIleIro de BIodIeSel e oS AGrIculToreS fAmIlIAreS: QuAl é A reAlIdAde dA
INcluSão SocIAl No cerrAdo?
A produção de biocombustíveis tem sido fortemente discutida no Brasil, levando o País a desenvolver políticas e implementar, no ano de 2004, o Programa Nacional de Produção
e Uso de Biodiesel (PNPB), a im de aumentar a participação de
energias renováveis, bem como fomentar o desenvolvimento rural. Neste contexto, o presente estudo busca avaliar a relação entre a condição de vida dos agricultores e a adoção do cultivo de oleaginosas no estado do Tocantins, em uma região de transição entre o cerrado e a floresta Amazônica. uma gama de indicadores socioeconômicos foram coletados entre os agricultores que cultivam pinhão manso e mamona. Análise fatorial baseada na condição de vida dos agricultores e um modelo não-linear probit foram utilizados para avaliar a inclusão de famílias rurais pobres na cadeia do biodiesel. os resultados preliminares mostram uma relação positiva entre o nível de privação da família e a adoção do cultivo de oleaginosas, no caso da produção de Ricinus communis, e uma relação negativa, no caso da produção de Jatropha curcas.
et al. 2007). The PNPB is an interdepartmental program of the Brazilian government, with goals such as implementing the production and use of biodiesel, while focusing on social inclusion and regional development2. moreover, the PNPB has several speciic objectives: i) implement a sustainable
program, promoting social inclusion; ii) guarantee competitive prices, quality and supply; and iii) produce biodiesel from different vegetable oil species3.
five years after the PNPB implementation, data released by the National oil, Natural Gas and Biofuels Agency (ANP) demonstrated that biodiesel, in Brazil, at the macro level, is being produced mainly from soybean and animal fat (roughly 80% and 15%, respectively), which are, in most cases, produced by large-scale farmers (ANP 2010). The PNPB impacts, at a micro level, however, are uncertain, especially regarding the effectiveness of implementing social inclusion, i.e. there is uncertainty about whether poor rural families are being included in the national biodiesel chain. Social inclusion is a process that aims to offer opportunities to access goods and services to the most excluded people within a system and , therefore, beneit all and not only those in better off conditions (Pierson 2002, Silver & miller 2002) [emphasis added].
The impact on farmers will be contingent on a range of factors like the market structure, type of contracts, and protection against risks, for instance. This is another area that has not been addressed in the current literature (rajagopal & zilberman 2007). In this context, the present study aims to analyze the relationship and linkages between poor rural families and the adoption of small-scale oil seed production, from two different farming systems, in northern Brazil, therefore assessing whether the PNPB’s ‘pro-poor’ strategy is effective or not. The research will support the regional and national governments in improving the PNPB and social inclusion targets. moreover,
2 According to Abramoway & magalhães (2007) and Garcez & vianna (2009),
the biodiesel policy has the clear objective of promoting the social inclusion of family farming. This is a very commendable and much needed proposition,
speciically in Brazil, a country that has one of the worst land distribution rates
in the American continent and great disparities between the wealth of large, industrial-scale farming versus family-based counterparts.
3 The PNPB has also a differential to other biodiesel programs created during the
1980s, in Brazil, such as the national vegetable oils program to energy production (Pró-Óleo) and the vegetable oils program (oveG). Apart from the production and use of biodiesel in the country, the PNPB focuses mainly on social inclusion and also takes into account the environmental aspects of biodiesel production. due to the importance of the social inclusion target, the national government
established a range of different instruments aiming at fulilling this target, such as iscal exemptions, inancial subsidies, and speciic credit lines to biodiesel
companies.
the results presented can play an important role in integrating efforts to consolidate a new economic alternative for the small-scale farmers in the country.
mATerIAl ANd meThodS
The research was carried out in the Tocantins State, located in northern Brazil, a region known as the Brazilian legal Amazon. The State is situated in a transition area, containing climate and vegetation patterns from both the Amazon rain forest (15% of the territory) and the Cerrado (85% of the territory). This transition area, so-called ecotone zone, is home to traditional communities (family farmers and indigenous, as well as quilombolas4) and
comprises rich biodiversity, which is responsible for numerous environmental services. for this
reason, scientiic studies and research in the area are
extremely important, since they are often focused on understanding the different farming systems, their connections to the local economy, and the very diverse environment. Based on that, and in order to obtain the appropriate information, a macro study region was selected, in the south-west part of the Tocantins State (figure 1).
In addition, two sub-study regions were selected within the macro study region. each sub-study region comprises smallholders who produce certain type of oil seed, as well as have contracts with one of the biodiesel companies established in the State. Therefore, the two sub-study regions have
been deined and focused on the different types of
vegetable oil species. So, the sub-study regions are:
1. Jatropha curcas sub-study region: comprised
by an area from the city of Paraíso do Tocantins up to the city of caseara, both situated in western Tocantins.
4 descendants of African slaves.
This region is characterized by smallholders under contract with one of the biodiesel companies. All smallholders live in rural settlements created by the national government, through the National Agrarian reform Program;
2. Ricinus communis sub-study region:
comprised by an area from the city of Porto Nacional up to the city of formoso do Araguaia, in the south-west of the State. This region is characterized by smallholders under contract with the other biodiesel company. All smallholders live in rural settlements created by the national government, through the National Agrarian reform Program.
The foundation for the database was formed through a comprehensive survey, which was carried out between April and September 2008, in two
sub-study regions, within the Tocantins State. Speciic
questionnaires5 were applied to smallholders, who
were randomly selected. The smallholders selection followed statistical procedures and the sample can be considered representative, since it comprises more than 90% of small-scale oil seed producers, in the region in question, at the time the research was carried out.
Aiming at better understanding the linkages between the farmers’ living standard and the oil seed activity adoption and, therefore, checking the effectiveness of the PNPB’s ‘pro-poor’ strategy, the factor analysis was chosen, and a non-linear probit
model was used to demonstrate this relationship with more accuracy6. The factor analysis was
selected because it enables one to construct a multi-dimensional poverty index, based on the living standard criteria approach, that is used to assess farming systems (doppler 1993). A major advantage of using a multi-dimensional measure of poverty, instead of a traditional one (poverty line), is that it does not only take account of the material situation of individuals, but it also captures their general living conditions.
In the traditional approach, poverty is often measured by a poverty line, i.e. all individuals whose income does not exceed a certain level of income are stated to be poor (Betti & verma 1999, costa 2002, deutsch & Silber 2005). This approach has clear merits, taking not just the relative number of poors, but both their absolute and relative deprivation.
5 The speciic questionnaires comprise economic, inancial, social, environmental,
cultural, and other aspects of the farmers’ living standard.
6 for this purpose, the software STATA was used to support the factor, as well as
the econometric analysis.
Nevertheless, it fails to capture a number of features, which may be relevant in thoroughly understanding poverty.
The relationship between rural poverty and environment and social issues is analyzed from different points of view and approaches by several scientists. however, some of those approaches do not put into account the diversity of factors that are intrinsic to the rural poverty conditions, resulting
in general conclusions (and not speciic) about the
relationship. however, there are some studies that express the different dynamics of the rural poverty condition, aiming at enlarging the knowledge that this relationship does not follow one single direction, but might be characterized by several aspects, depending upon the context in which it is embedded (Broad 1994, reardon & vosti 1995, Prakash 1997).
In this context, the factor analysis can be considered a suitable approach, for one strong reason: it allows the construction of a multi-dimensional index, without a sharp division between poor and non-poor populations. In addition, factor analysis is a broad analysis, including a range of indicators for living standards, while also adopting mathematical tools that can represent the complex character and nuances of the multi-dimensional phenomenon.
The factor analysis7
factor analysis is an interdependence technique,
whose primary purpose is to deine the underlying
structure among the variables in the analysis, and thus provide the tools to assess the structure of interrelationships (correlations) among a large
number of variables, by deining sets of variables that
are highly interrelated, known as factors. Therefore,
the general aim of factor analysis is to ind a way to
summarize (condense) the information contained in a number of original variables into a smaller set of new composite dimensions or factors with a minimum loss of information. The factor analysis is then an indicator reduction procedure and a statistical tool used to identify a small number of factors, which
relects complex relationships between these set of
variables.
Thus, in the factor analysis, factors are
7 This section is based on Kim & mueller (1978), Jaccard (1997), and hair et al.
estimated as linear combinations between the variables and follow the model described in the equation
where wij represents the factor coeficients, xi are the observed variables, and p is the number of variables, and, therefore, the factor analysis is based on the
correlation between the variables. Then, the irst
step is to check the correlation degree between these variables, which cannot be too small, since it turns the factor analysis non-feasible (if the correlations are too small, probably there is no dimensional structure
in the data). For this purpose, there are some speciic
tests to verify the model adequacy, such as the Bartlett test and the Kaiser-meyer-olkin test (Kmo)8. After the adequacy veriication, the establishment of the
number and factor extraction is done. In the present study, the component analysis or the principal component analysis (PcA) is used.
The next step is to interpret the factors. When the interpretation is not possible, due to lack of a logical structure, the factors rotation is done. This procedure rearranges the factors matrix, without modifying the total explained variance, aiming at
inding a simple and understandable structure. Then,
the calculation of factors is carried out. It is important to state that the new variables (i.e. the factors) do not present any lack of information embedded in the original variables. Thus, the calculation is done, as demonstrated in the equation
where xik is the standardized value of the variable i
to the observation k, and wij is the factor coeficient
associated to the variable i and factor j. one should expect that as poverty is a multidimensional phenomenon, the factors, which are a linear
combination of the variables, might relect different
expressions of poverty. Aiming at assessing the dimensions expressed by the factors, a linearization of the scores is done, since the scores are calculated based on standardized variables, and thus might take negative values, which can hinder the factors
8 ,
where rijis the coeficient of simple correlation between the variables xi and xj, and aij is the partial correlation between the variables xi and xj. If Kmo value is
close to one, factor analysis should be applied.
assessment. The linearization is expressed by the equation:
where fij is the linear factor score, and fmin and fmax
are, respectively, the minimum and the maximum observed values to the factor scores associated to the indicators, guaranteeing, therefore, that all factor scores lie in the range [0,1].
Variables deinition
Several approaches have been adopted in
the ield of poverty research, in different regions
and contexts, and comprise both quantitative and qualitative aspects. The poverty condition has
been deined broadly as a phenomenon of multiple
dimensions with economic, cultural, and social
aspects, and it is characterized by: a) insuficient
income; b) limited access to basic needs; and c) social exclusion and discrimination, due to ethnic or gender origin (echeverria 2000). The measurement of poverty through indicators that have only one dimension, such as income, can lead to discrepancies in the interpretation of a broader phenomenon.
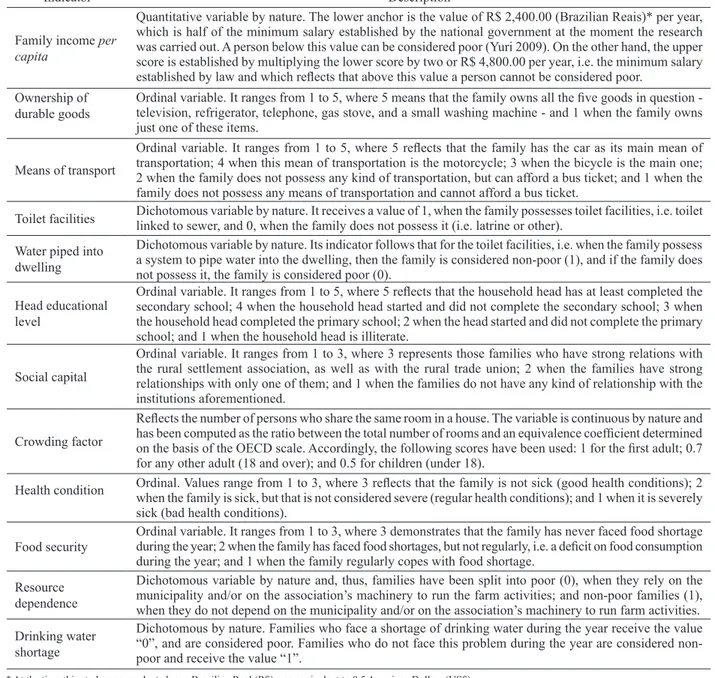
Therefore, to obtain more accurate analyses of the linkages between farmers’ living standard (degree of poverty) and oil seed activity adoption, social, as well as economic indicators, were taken into account. Therefore, variables related to economic and social aspects of households were selected to better demonstrate the multi-dimensional situation of rural poverty, in both sub-study regions in question. The variables selected are shown in Table 1.
To check whether the proposed model was adequate, a correlation matrix analysis among the twelve indicators was done. The results point towards a low correlation, on average, despite the fact that
most of them are signiicant. In this context, aiming
at testing the model adequacy with more accuracy, the Kaiser-meyer-olkin (Kmo) was applied and
shows the igure of 0.64 (low to medium adequacy),
and satisfactory, regarding the exploratory nature of the present study.
After the correlation matrix and the result from the Kmo, as well as the Bartlett’s test, the factor analysis was adopted and factor extractions were done. The initial number of factors should follow some considerations, such as application of the latent root criterion of retaining factors with eigen values greater than 1.0. In addition, the Scree test, derived by plotting the latent roots against the number of factors in order of extraction, was also used to evaluate the cutoff point.
The indicators follow an increase degree of
living standard, i.e. high values relect better living
standard conditions. Based on this, the factor analysis was applied to reduce the number of variables towards a small number of factors which, for their
turn, relect the original variables. The point at which the curve irst begins to straighten out is considered
to indicate the maximum number of factors to be extracted. Therefore, four different factors could be
identiied, which are responsible for roughly 55%
of the total data variance. In addition, the Scree Table 1. living standard indicators.
Indicator description
family income per capita
Quantitative variable by nature. The lower anchor is the value of r$ 2,400.00 (Brazilian reais)* per year, which is half of the minimum salary established by the national government at the moment the research was carried out. A person below this value can be considered poor (yuri 2009). on the other hand, the upper score is established by multiplying the lower score by two or r$ 4,800.00 per year, i.e. the minimum salary
established by law and which relects that above this value a person cannot be considered poor.
ownership of durable goods
Ordinal variable. It ranges from 1 to 5, where 5 means that the family owns all the ive goods in question -
television, refrigerator, telephone, gas stove, and a small washing machine - and 1 when the family owns just one of these items.
means of transport
Ordinal variable. It ranges from 1 to 5, where 5 relects that the family has the car as its main mean of
transportation; 4 when this mean of transportation is the motorcycle; 3 when the bicycle is the main one; 2 when the family does not possess any kind of transportation, but can afford a bus ticket; and 1 when the family does not possess any means of transportation and cannot afford a bus ticket.
Toilet facilities dichotomous variable by nature. It receives a value of 1, when the family possesses toilet facilities, i.e. toilet linked to sewer, and 0, when the family does not possess it (i.e. latrine or other).
Water piped into dwelling
dichotomous variable by nature. Its indicator follows that for the toilet facilities, i.e. when the family possess a system to pipe water into the dwelling, then the family is considered non-poor (1), and if the family does not possess it, the family is considered poor (0).
head educational level
Ordinal variable. It ranges from 1 to 5, where 5 relects that the household head has at least completed the
secondary school; 4 when the household head started and did not complete the secondary school; 3 when the household head completed the primary school; 2 when the head started and did not complete the primary school; and 1 when the household head is illiterate.
Social capital
ordinal variable. It ranges from 1 to 3, where 3 represents those families who have strong relations with the rural settlement association, as well as with the rural trade union; 2 when the families have strong relationships with only one of them; and 1 when the families do not have any kind of relationship with the institutions aforementioned.
crowding factor
Relects the number of persons who share the same room in a house. The variable is continuous by nature and has been computed as the ratio between the total number of rooms and an equivalence coeficient determined on the basis of the OECD scale. Accordingly, the following scores have been used: 1 for the irst adult; 0.7
for any other adult (18 and over); and 0.5 for children (under 18).
health condition Ordinal. Values range from 1 to 3, where 3 relects that the family is not sick (good health conditions); 2 when the family is sick, but that is not considered severe (regular health conditions); and 1 when it is severely sick (bad health conditions).
food security
ordinal variable. It ranges from 1 to 3, where 3 demonstrates that the family has never faced food shortage
during the year; 2 when the family has faced food shortages, but not regularly, i.e. a deicit on food consumption
during the year; and 1 when the family regularly copes with food shortage. resource
dependence
dichotomous variable by nature and, thus, families have been split into poor (0), when they rely on the municipality and/or on the association’s machinery to run the farm activities; and non-poor families (1), when they do not depend on the municipality and/or on the association’s machinery to run farm activities. drinking water
shortage
dichotomous by nature. families who face a shortage of drinking water during the year receive the value “0”, and are considered poor. families who do not face this problem during the year are considered non-poor and receive the value “1”.
plot, based on eigen values, was estimated and also
relected four different factors.
reSulTS ANd dIScuSSIoN
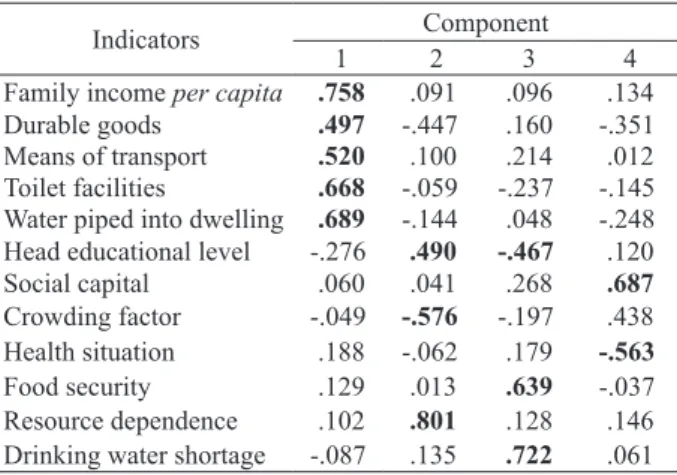
After the factors extraction, the orthogonal rotation based on the varimax method was applied, aiming at turning the factors into more understandable results. The varimax method aims to simplify the columns of the matrix factor. Thus, the maximum
possible simpliication is reached if there are only
1 and 0 values in the columns, i.e. the method maximizes the sum of variances of matrix factor’s required loadings, aiming at obtaining an orthogonal rotation of factors. The rotated matrix is presented in Table 2.
factor loadings from ±0.30 to ± 0.40 usually are considered adequate to meet the minimal level for structure interpretation. however, as the present study’s sample lays around 100 units (smallholders), the range considered adequate was above ±0.45. To interpret the factors, it is necessary to pay attention
to the higher igures presented in Table 2, since higher igures represent higher weights on factor
composition. In this context, the factor 1 seems to
relect capital security, once it is represented by
family income per capita, ownership of durable goods, means of transport, and presence of toilet linked to sewer, as well as presence of water piped into dwelling.
The factor 2 seems to relect a dependence
on external resources, and comprises the indicators resource dependence, crowding factor, and head
educational level. The factor 3 reflects natural resources insecurity, since it is linked to the variables food security and drinking water shortage. Both variables have positive signs and move together in the same direction, while the head educational level appears as a cross-loading factor, i.e. when a variable
is found to have more than one signiicant loading.
As this variable has the higher weight in factor 2, its value was not considered in factor 3. And last but
not least, the factor 4 seems to relect social security.
here the factor is linked to the variable social capital, as well as to health condition. Both variables are negatively correlated.
An option for creating a smaller set of variables to replace the original one is the computation of factor scores9, which are composite measures of
each factor computed for each subject. So, the factor scores are estimated and then a process of linearization is done, aiming at avoiding negative factor scores values, and thus guaranteeing that all scores lie in the range [0,1].
After the linearization, a non-linear probit
model was applied to estimate the relationship between the living standard factors and the adoption of oil seeds activity by small-scale farmers, in both sub-study regions (Greene 2008, hill et al. 2008). In this context, two regressions were estimated: one for the Ricinus communis region, and one for the
Jatropha curcas region. The analysis per sub-study
region is necessary, since the smallholders are located in different areas, produce different oil seeds, and have contracts with different biodiesel companies10.
Therefore, the weights for each indicator of deprivation were calculated per sub-study region, taking into account the peculiarities and nuances, and, therefore, the relative importance of each indicator of deprivation in each region.
The probit model formulated was:
Yj= α + β0 factor1j + β1 factor2j + β2 factor3j +
+ β3 factor4j + μj ( j = 1, ..., n),
where the dependent variable Y refers to the adoption of oil seeds (Y = 1) or otherwise (Y = 0), α and β are
the parameters of the equation, μ is the stochastic
term, and the factors (1 to 4) are the explanatory variables. hence, when the signs of the estimated coefficients from the models are positive, the relationship between living standard and adoption of
9 other options are: i) selecting surrogates; and ii) creating summated scales. 10 A one-year contract, for the Ricinus communis producers, and a ten-year
contract, for the Jatropha curcas producers.
Indicators component
1 2 3 4
family income per capita .758 .091 .096 .134 durable goods .497 -.447 .160 -.351 means of transport .520 .100 .214 .012 Toilet facilities .668 -.059 -.237 -.145 Water piped into dwelling .689 -.144 .048 -.248 head educational level -.276 .490 -.467 .120 Social capital .060 .041 .268 .687 crowding factor -.049 -.576 -.197 .438 health situation .188 -.062 .179 -.563 food security .129 .013 .639 -.037 resource dependence .102 .801 .128 .146 drinking water shortage -.087 .135 .722 .061
Notes: Bold values relect factor loading above 0.45. Extraction Method: Principal
oil seed activity is direct, i.e. the probability of poor families adopting oil seed activity is smaller than that of their non-poor counterparts, and, therefore, the ‘pro-poor’ strategy is not being effective. By contrast,
when the coeficient is negative, the relation is the
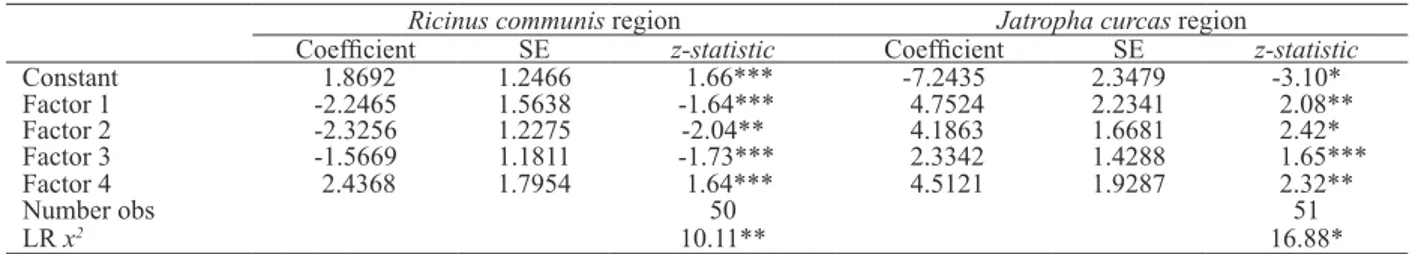
inverse, i.e. poor families have a higher probability of adopting oil seed activity and thus the social inclusion advocated by the PNPB is taking place. Based on this, the results of the probit model can be seen in Table 3.
According to the results of the probit model,
one can observe that all coeficients are signiicant,
either at the 1%, 5%, or 10% level. Also the likelihood
ratio Chi-Square is signiicant at the 1% and 5%
levels. regarding the signs of the coefficients,
positive signs relect a direct relationship between
better living standards and the adoption of oil seed activity. In this context, in the Ricinus communis region, for instance, the sign of the coeficients are
negative (except for factor 4), i.e. a poor family has, on average, a higher probability of adopting the oil seed activity than a non-poor family. This outcome shows that, in this region, the social inclusion advocated by the PNPB is occurring, in other words, poor families are being included in the Brazilian biodiesel chain.
however, when one looks to the other region, the Jatropha curcas region, the signs of the
coeficients are positive, showing that the better
the living standards of families, on average, the higher the probability to adopt the oil seed activity, when compared to those who are considered poor. Therefore, the results suggest that social inclusion is not occurring, once the poor families are not taking part in the biodiesel production process, and thus, in this case, the effectiveness of the PNPB’s ‘pro-poor’ strategy is doubtful.
The changes in the predicted probability for the factors were also estimated and show that, for
the Ricinus communis producers, a movement from
0 (worse living standard) to 1 (better living standard) changes the probability of factor 1 to 49%, 60% for factor 2, and 41% for factor 3, i.e. a movement towards a better living standard condition decreases the probability of adoption of oil seed activity in these percentages (except for factor 4, whose
coeficient is positive). However, for the Jatropha
curcas producers, a movement from 0 (worse living
standard) to 1 (better living standard) changes the probability of factor 1 to 71%, 76% for factor 2, 53% for factor 3, and 81% for factor 4, i.e. a movement towards better living standard conditions increases, on average, the probability of adopting the oil seed activity in these percentages.
one possible explanation for the results from
the probit model relies on the short horizon outlook
and risk aversion embedded in the poverty condition. The bad living standards, for example, the weak access to goods and services, and, therefore, the high vulnerability to disasters (natural and man-made), make the poor uncertain and insecure about the future. In addition, the risk aversion began from the limited assets available and the low educational level of family members. This put poor rural families into a precarious economic balance, where families prefer short-term activities rather than medium to long-term projects (reardon & vosti 1995).
This seems to be what happens to the Ricinus
communis oil seed production. Ricinus is an annual
crop and its production is based on a one-year contract with the biodiesel company, which allows farmers to quit the activity in the following year, in case of bad harvest and low productivity of the feedstock. however, this is not the case of the Jatropha curcas
oil seed. Jatropha is a perennial crop and its activity is based on a ten-year contract with the biodiesel company. The oil seed becomes economically
proitable after the fourth year, and, thus, requires a
Notes: SE = standard error; *Signiicance level of 0.01; ** Signiicance level of 0.05, *** Signiicance level of 0.10.
Ricinus communis region Jatropha curcas region
Coeficient Se z-statistic Coeficient Se z-statistic
constant 1.8692 1.2466 1.66*** -7.2435 2.3479 -3.10*
factor 1 -2.2465 1.5638 -1.64*** 4.7524 2.2341 2.08**
factor 2 -2.3256 1.2275 -2.04** 4.1863 1.6681 2.42*
factor 3 -1.5669 1.1811 -1.73*** 2.3342 1.4288 1.65***
factor 4 2.4368 1.7954 1.64*** 4.5121 1.9287 2.32**
Number obs 50 51
lr x2 10.11** 16.88*
diversiied portfolio from the farmers’ perspective.
Therefore, the long-term horizon, concerning the
Jatropha production, seems to be more attractive to
the farmers in the mentioned region, which present, on average, a broad spectrum of capital assets. It is important to say that there is no different treatment by local and national governments, considering the two sub-study regions, i.e. the basic infrastructure conditions, such as roads and energy, are similar in both regions.
In summary, apart from the fact that the Brazilian biodiesel use and production program (PNPB) possesses the laudable objectives of promoting social inclusion and regional development, the results presented hitherto demonstrate and suggest
that a lack in speciic policy mechanisms has resulted in the non-fulillment of one of its main targets:
inclusion of marginalized people in the biodiesel chain. Based on this, it is imperative to say that the involvement of local agents seems to be a sine
qua non condition to overcome the shortcomings in
policy mechanisms, by aiming to minimize gaps in the national biodiesel policy and, therefore, reach the social inclusion and the sustainable development advocated by the PNPB.
fINAl remArKS
The study presents an example of application of a multi-dimensional measurement of poverty, by using factor analysis. The empirical results obtained for the Tocantins State, located in northern Brazil, show that the use of several indicators not only helps to draw a more comprehensive and complete picture of living standard, but also gives an image of rural poverty that is closer to what is perceived by just observing reality. Nevertheless, for many reasons, the results depend strongly on the choice of indicators for this kind of analysis, so it would be worth selecting and defining an appropriate set of indicators to include the data, covering all the relevant areas, for a broader analysis of living conditions.
The debate about bioenergy and social inclusion is currently considered a hot topic and the study reveals the dynamicity of the linkages between two multi-dimensional phenomena. The ambiguity of this relationship, highlighted by the results of the factor analysis and the probit model, illustrates that the Brazilian biodiesel use and production program (PNPB), target of social inclusion, cannot yet be seen
as successful. In one sub-study region, for instance, it is clear that the poor families are being included in the Brazilian biodiesel chain, but, in the other sub-study region, the poor families continue to be marginalized, without access to this new economic alternative.
The regional development of one of the poorest regions of the country (northern Brazil) needs special attention. The reality of family farming in northern Brazil follows the diversity of the country, and, thus, it is completely different from other regions. These differences, along with the natural endemic characteristics of the region, make the development of the Tocantins State a challenge, especially when it includes the biodiesel and oilseed production by family farmers. only a more critical look at regional differences will allow the PNPB to meet its goals of
social inclusion and income generation in the ield,
in the context of sustainable development. Based on this, we strongly suggest that other studies be carried out, aiming at better understanding the reasons behind the inclusion and non-inclusion of farmers in the biodiesel chain.
This study is unprecedented in the northern region of Brazil and its results are extremely important in helping to obtain an appropriate method for regional and national governments to subsidize clean energy production, in order to bring the real
beneits provided by the program to those who should
actually be assisted in achieving social inclusion: the family farmers. Although the present research focuses on the Tocantins State, small-scale oil seed production can now be better gauged in other parts of the Brazilian legal Amazon, because our study highlights one of the most discussed topics in the bioenergy debate: oil seed production and its linkages with farmers’ living standard. As the present study
focuses only at family level, in a speciic region, we
also suggest that further studies should be focused on the biodiesel production, on both regional and national levels, in order to attain a broader idea of the biodiesel production in Brazil.
refereNceS
ABrAmoWAy, r.; mAGAlhãeS, r. The access
of family farmers to biodiesel markets: partnerships
AGÊNcIA NAcIoNAl do PeTrÓleo, GÁS NATurAl e BIocomBuSTÍveIS (ANP). Biodiesel statistics. 2010. Available at: <http://www.anp.gov.br/>.
Acess on: 10 mar. 2010.
BeTTI, G.; vermA, v. K. Measuring the degree of
poverty in a dynamic and comparative context: a
multi-dimensional approach using fuzzy set theory. In: ISlAmIc couNTrIeS coNfereNce oN STATISTIcAl ScIeNceS, 6., 1999, lahore. Proceedings… lahore: Punjab university, 1999. p. 289-301.
BrASIl. Governo federal. Programa nacional de produção e uso de biodiesel (PNPB). 2005. Available at: <http://www.biodiesel.gov.br/programa.html>. Acess on: 23 Nov. 2009.
BroAd, r. The poor and the environment: friends or foes? World Development, Quebec, v. 22, n. 6, p. 811-22, 1994.
coSTA, m. A multidimensional approach of the
measurement of poverty: IrISS working paper series
n. 2002-05. 2002. Available at: <http://iriss.ceps.lu/ documents/irisswp28.pdf>. Acess on: 26 Oct. 2009. deuTSch, J.; SIlBer, J. Measuring multidimensional poverty: an empirical comparison of various approaches.
Review of Income and Wealth, malden, v. 51, n. 1, p. 145-174, 2005.
doPPler, W. contribution of the farming systems approach to regional food security and rural infrastructure.
In: ThImm, h. u. et al. (eds.). Regional food security and rural infrastructure. münster: verlag, 1993.
duBoIS, o. How good enough biofuel governance
can help rural livelihoods: making sure that biofuel
development works for small farmers and communities.
rome: fAo, 2008.
echeverrIA, r. G. opciones para reducir la pobreza rural en América latina y el caribe. Revista de la CEPAL, Santiago, n. 70, p. 147-160, 2000.
food ANd AGrIculTure orGANIzATIoN of The uNITed NATIoNS (fAo). Bioenergy, food security and sustainability:towards an international framework. 2008a. Available at: <http://www.fao.org/fileadmin/ user_upload/foodclimate/HLCdocs/HLC08-inf-3-E.pdf>. Acess on: 26 oct. 2009.
food ANd AGrIculTure orGANIzATIoN of The uNITed NATIoNS (fAo). Climate change, bioenergy and food security: civil society and private sector perspectives. 2008b. Available at: <http://www.fao. org/ileadmin/user_upload/foodclimate/HLCdocs/HLC08-inf-6-E.pdf>. Acess on: 26 Oct. 2009.
food ANd AGrIculTure orGANIzATIoN of The uNITed NATIoNS (fAo). Climate change, bioenergy and food security:options for decision makers identiied by expert meetings. 2008c. Available at: <http://www.fao. org/ileadmin/user_upload/foodclimate/HLCdocs/HLC08-inf-5-E.pdf>. Acess on: 26 Oct. 2009.
GArcez, c. A. G.; vIANNA, J. N. S. Brazilian biodiesel policy: social and environmental considerations. Energy, Aalborg, v. 34, n. 5, p. 645-654, 2009.
GreeNe, W. h. Econometric analysis. 6. ed. New Jersey: Prentice hall, 2008.
hAIr, J. f. et al. Multivariate data analysis. 6. ed. New Jersey: Prentice hall, 2006.
hIll, r. c.; GrIffIThS, W. e.; lIm, G. c. Principles of econometrics. 3. ed. danvers: John Wiley and Sons, 2008. JAccArd, J. Interaction effects in factorial analysis of variance:quantitative applications in the social sciences. Thousand oaks: Sage, 1997.
KIm, J. o.; mueller, c. Factor analysis: statistical methods and practical issues. Newbury Park: Sage, 1978. mATToS, J. e.; WAQuIl, P. d. Pobreza rural no Rio Grande do Sul: comparando abordagens. 2005. Available at: <http://www.fee.tche.br/3eeg/Artigos/m03t04.pdf>. Acess on: 12 oct. 2009.
NASS, l.; PereIrA, P.; ellIS, d. Biofuels in Brazil: an overview. Crop Science, madison, v. 47, n. 6, p. 2228-2237, 2007.
PIerSoN, J. Tackling social exclusion: social work skills series. New york: routledge, 2002.
PrAKASh, S. Poverty and environment linkages in mountains and uplands: relections on the ‘poverty trap’
thesis. 1997. Available at: <http://www.prem-online.org/ archive/17/doc/creed12e.pdf>. Acess on: 13 Sep. 2009.
rAJAGoPAl, d.; zIlBermAN, d. Review of
environmental, economic and policy aspects of biofuels.
2007. Available at: <http://www-wds.worldbank.org/ external/default/WdScontentServer/IW3P/IB/2007/09/0 4/000158349_20070904162607/rendered/Pdf/wps4341. pdf>. Acess on: 26 Oct. 2009.
reArdoN, T.; voSTI, S. links between rural poverty and the environment in developing countries: asset categories and investment poverty. World Development, Quebec, v. 23, n. 9, p. 1495-1506, 1995.
SIlver, h.; mIller, m. Social exclusion: the european approach to social disadvantage. 2002. Available at: <http://www.ag.ohio-state.edu/~hcrd/people/staff/ Social%20exclusion%20The%20european%20approach. pdf>. Acess on: 15 Mar. 2010.
uN eNerGy. Sustainable bioenergy: a framework for decision makers. 2007. Available at: <http://www.fao. org/docrep/010/a1094e/a1094e00.htm>. Acess on: 26 oct. 2009.