Ischemic Core in Patients with Acute
Ischemic Stroke
Ralph R. E. G. Geuskens1*, Jordi Borst2, Marit Lucas1, A. M. Merel Boers1, Olvert A. Berkhemer2, Yvo B. W. E. M. Roos3, Marianne A. A. van Walderveen4, Sjoerd F.
M. Jenniskens5, Wim H. van Zwam6, Diederik W. J. Dippel7, Charles B. L. M. Majoie2, Henk A. Marquering1,2, MR CLEAN trial investigators(www.mrclean-trial.org)
1Dept. of Biomedical Engineering and Physics, Academic Medical Center, Amsterdam, The Netherlands, 2Dept. of Radiology, Academic Medical Center, Amsterdam, The Netherlands,3Dept. of Neurology, Academic Medical Center, Amsterdam, The Netherlands,4Dept. of Radiology, Leiden University Medical Center, Leiden, The Netherlands,5Dept. of Radiology, Radboud University Medical Center, Nijmegen, The Netherlands,6Dept. of Radiology, Maastricht University Medical Center+, Maastricht, The Netherlands, 7Dept. of Neurology, Erasmus Medical Center, Rotterdam, The Netherlands
¶ Membership of the MR CLEAN trial is provided in the Acknowledgments.
Abstract
Background
CT perfusion (CTP) is used to estimate the extent of ischemic core and penumbra in patients with acute ischemic stroke. CTP reliability, however, is limited. This study aims to identify regions misclassified as ischemic core on CTP, using infarct on follow-up noncon-trast CT. We aim to assess differences in volumetric and perfusion characteristics in these regions compared to areas that ended up as infarct on follow-up.
Materials and Methods
This study included 35 patients with>100 mm brain coverage CTP. CTP processing was performed using Philips software (IntelliSpace 7.0). Final infarct was automatically seg-mented on follow-up noncontrast CT and used as reference. CTP and follow-up noncontrast CT image data were registered. This allowed classification of ischemic lesion agreement (core on CTP: rMTT145%, aCBV<2.0 ml/100g and infarct on follow-up noncontrast CT) and misclassified ischemic core (core on CTP, not identified on follow-up noncontrast CT) regions. False discovery ratio (FDR), defined as misclassified ischemic core volume divided by total CTP ischemic core volume, was calculated. Absolute and relative CTP parameters (CBV, CBF, and MTT) were calculated for both misclassified CTP ischemic core and ische-mic lesion agreement regions and compared using paired rank-sum tests.
Results
Median total CTP ischemic core volume was 49.7ml (IQR:29.9ml-132ml); median misclassi-fied ischemic core volume was 30.4ml (IQR:20.9ml-77.0ml). Median FDR between patients a11111
OPEN ACCESS
Citation:Geuskens RREG, Borst J, Lucas M, Boers AMM, Berkhemer OA, Roos YBWEM, et al. (2015) Characteristics of Misclassified CT Perfusion Ischemic Core in Patients with Acute Ischemic Stroke. PLoS ONE 10(11): e0141571. doi:10.1371/ journal.pone.0141571
Editor:Johannes Boltze, Fraunhofer Research Institution of Marine Biotechnology, GERMANY
Received:June 5, 2015
Accepted:October 9, 2015
Published:November 4, 2015
Copyright:© 2015 Geuskens et al. This is an open access article distributed under the terms of the Creative Commons Attribution License, which permits unrestricted use, distribution, and reproduction in any medium, provided the original author and source are credited.
Data Availability Statement:All relevant data are within the paper.
was 62% (IQR:49%-80%). Median relative mean transit time was 243% (IQR:198%-289%) and 342% (IQR:249%-432%) for misclassified and ischemic lesion agreement regions, respectively. Median absolute cerebral blood volume was 1.59 (IQR:1.43–1.79) ml/100g (P<0.01) and 1.38 (IQR:1.15–1.49) ml/100g (P<0.01) for misclassified ischemic core and ischemic lesion agreement, respectively. All CTP parameter values differed significantly.
Conclusion
For all patients a considerable region of the CTP ischemic core is misclassified. CTP param-eters significantly differed between ischemic lesion agreement and misclassified CTP ischemic core, suggesting that CTP analysis may benefit from revisions.
Introduction
Acute ischemic stroke is the third most common cause of death and the leading cause of per-manent invalidity in industrialized countries [1]. Early recanalization of arteries to restore per-fusion of regions at risk but still viable (penumbra) is vital [2]. Recanalization can be achieved by intravenous administration of recombinant tissue plasminogen activator (rtPA) or intra-arterial treatment (IAT) [3]. Intravenous rtPA is proven to be a beneficial treatment for ische-mic stroke patients, but due to haemorrhage risk, has a limited time-window of four and a half hours after onset of symptoms [4]. Recent multi-center randomized control trials, like MR CLEAN, EXTEND-IA, SWIFT PRIME, ESCAPE and REVASCAT, showed that intra-arterial treatment after intravenous rtPA is beneficial in restoring reperfusion within 6 hours after onset of symptoms and significantly improved patient outcome after 90 days [5–9]. However, a successful early recanalization by IAT does not guarantee a good outcome at 90 days. CT perfu-sion (CTP) has the potential to limit the number of futile recanalizations by improving critical patient selection for treatment [10,11].
CTP software distinguishes ischemic core from penumbra and unaffected regions by mea-suring blood perfusion in cerebral regions, based on venous contrast agent injection. Cerebral Blood Flow (CBF), Cerebral Blood Volume (CBV), and Mean Transit Time (MTT) are param-eters determined by CTP analysis, which are used for assessment of ischemic core and penum-bra [12–14]. CTP has certain advantages [15–18]. It is widely available at almost all emergency units, rapid and easily performed, and has a high spatial resolution [12]. Therefore this tech-nique has the potential to become a useful diagnostic tool in acute settings.
Despite the potential of CTP there are some issues which may cause inaccurate results and hamper its acceptance in clinical practice [16]. Different processing software packages, based on different underlying algorithms, have been proven to produce different results [19,20]. Other causes can be incorrect manual selection of arterial or venous input or too short acquisi-tion times causing truncaacquisi-tion of time attenuaacquisi-tion curves [21–23]. Head-movement or biologi-cal (certain vascular- or neurodiseases or cardiac output) or anatomibiologi-cal (lesions, variations in Circle of Willis or vascular system) causes can also influence data analysis [22–24].
CTP software creates summary maps to visualize ischemic core and tissue“at-risk” (penum-bra). Classification of this ischemic core and penumbra is based on parametric thresholds. Sub-optimal thresholds may influence CTP results. Thresholds used for classification of ischemic core are derived from large samples and can agree in large-scale studies. However, these thresh-olds can produce large errors when applied to individual patients [22,25]. Studies have shown that strict threshold values can lead to over- or underestimation of ischemic core volume and
penumbra, as they may not be specific for individual cases [23,26]. A previous study showed the appearance of false ischemic penumbra, caused by upstream flow restriction, old infarction, vascular anatomy variations and dysregulation, and patient misplacement in scanner [27].
Currently CTP still misclassifies a large area as ischemic core [28]. For CTP to be more reli-able in clinical settings, accuracy has to be improved [1,17]. MR-DWI is considered the most accurate modality to assess cerebral infarct and has been used as a gold standard in various studies [29,30]. However, MR-DWI is not commonly available in the acute setting of treatment of ischemic stroke patients [1]. Alternatively, it is proposed to use follow-up noncontrast CT as reference standard. Follow-up noncontrast CT is accurate in quantification of final infarct [31]. However, it is known that in the period between baseline and follow-up scanning, the infarct may grow [32,33]. Nevertheless, because it is not possible to have an ischemic core on baseline that has disappeared on follow-up imaging, follow-up noncontrast CT can be used as reference standard to identify regions misclassified as ischemic core on CTP. In this study we aim to identify misclassified CTP ischemic core using follow-up noncontrast CT and determine perfu-sion characteristics of ischemic core that can be used to improve CTP analysis.
Materials and Methods
Population
This study included patients from the MR CLEAN trial (www.mrclean-trial.org) [5]. Patients were eligible for inclusion in the MR CLEAN trial, if they had a clinical diagnosis of acute ischemic stroke, with a deficit on the National Institutes of Health Stroke Scale (NIHSS) of 2 points or more, CT or MRI ruling out haemorrhage, and intracranial artery occlusion of the distal intracranial carotid artery or middle (M1/M2) or anterior (A1/A2) cerebral artery. All patients or relatives signed an informed consent.
Seventy-one patients from MR CLEAN trial received>100 mm brain coverage baseline CTP. Final infarct volume was determined on 5–7 day follow-up noncontrast CT. For two patients, 5–7 day CT was not available and 24-hours follow-up noncontrast CT was used for determining final infarct volume. Patients were excluded for the following reasons: CTP avail-able, but no follow-up CT (N = 18); excessive movement (N = 2); poor quality of the scans (N = 4); midline shift over 5 mm on follow-up CT (N = 7); craniectomy on follow-up CT (N = 3); no ischemic core on baseline CTP (penumbra only) (N = 2). After exclusion, final sample size of this study was 35 patients.
CT imaging
It has been shown that truncation may cause inaccuracies in CTP results [21]. AIF, VOF and tissue time-attenuation curves (TAC) were visually classified as truncated or complete. Attenuation curves were classified as complete when the attenuation values returned close to their baseline values
Follow-up noncontrast CT imaging. Patients received follow-up noncontrast CT at 24 hours and 5–7 days after hospitalization. Final infarct size was determined on 5–7 day follow-up noncontrast CT scanning if possible. When these were not available, infarct was determined on 24 hours follow-up noncontrast CT (N = 2). Follow-up noncontrast CT images were regis-tered with motion corrected CTP images using Elastix [34]. Infarct on follow-up noncontrast CT was determined using a semi-automated method by in-house developed software (MATLAB) [35].
Ethics statement. The CTP protocol has been approved by the institutional review board (Medisch Ethische Toetsings Commissie) from the Academic Medical Center, Amsterdam, The Netherlands. Patients or legal representatives signed informed consent.
Selection of misclassified ischemic core
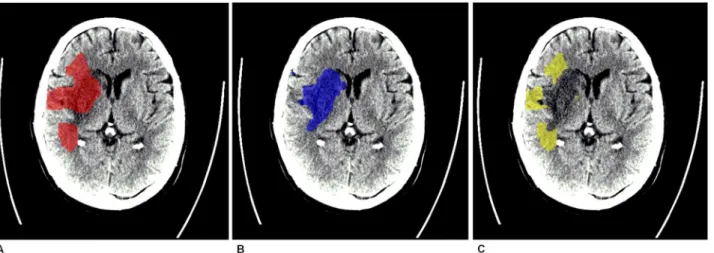
Registration of follow-up noncontrast CT with baseline CTP allowed direct comparison of CTP derived ischemic core and follow-up noncontrast CT derived infarct (Fig 1) CTP ischemic core, follow-up noncontrast CT infarct and CTP derived parameter maps registration was per-formed in MATLAB.
Voxel-based comparison of CTP ischemic core with follow-up noncontrast CT infarct resulted in two areas of interest. The first is“misclassified ischemic core”, which is defined as the area classified as ischemic core on CTP and not as infarct on follow-up noncontrast CT. The second area of interest is the area in which CTP ischemic core and follow-up noncontrast CT infarct agree, which is referred to as“ischemic lesion agreement”in the following.
Misclassified ischemic core and ischemic lesion agreement were used as regions of interest (ROIs) for further analysis. ROIs were projected on follow-up noncontrast CT for visual assess-ment (Fig 1) and on quantitative parameter maps of the MTT, CBF, and CBV.
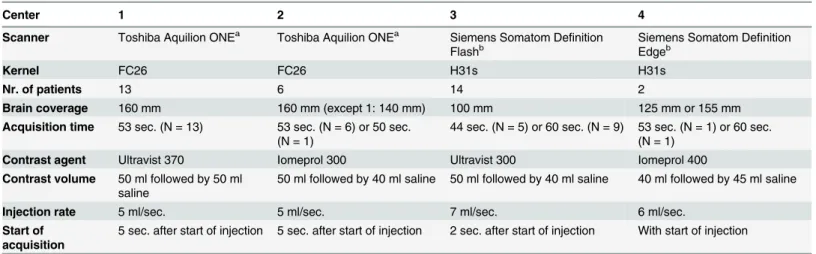
Table 1. Scanners, brain coverage, acquisition time and contrast agent for CT perfusion amongst hospitals included in this study.
Center 1 2 3 4
Scanner Toshiba Aquilion ONEa Toshiba Aquilion ONEa Siemens Somatom Definition
Flashb Siemens Somatom DeEdgeb finition
Kernel FC26 FC26 H31s H31s
Nr. of patients 13 6 14 2
Brain coverage 160 mm 160 mm (except 1: 140 mm) 100 mm 125 mm or 155 mm Acquisition time 53 sec. (N = 13) 53 sec. (N = 6) or 50 sec.
(N = 1)
44 sec. (N = 5) or 60 sec. (N = 9) 53 sec. (N = 1) or 60 sec. (N = 1)
Contrast agent Ultravist 370 Iomeprol 300 Ultravist 300 Iomeprol 400 Contrast volume 50 ml followed by 50 ml
saline
50 ml followed by 40 ml saline 50 ml followed by 40 ml saline 40 ml followed by 45 ml saline
Injection rate 5 ml/sec. 5 ml/sec. 7 ml/sec. 6 ml/sec.
Start of acquisition
5 sec. after start of injection 5 sec. after start of injection 2 sec. after start of injection With start of injection
aToshiba Medical Systems, Tokyo, Japan bSiemens, Erlangen, Germany
Statistical Analysis
Median and IQR of the total ischemic core, misclassified ischemic core and ischemic agreement lesion volume were determined. The false discovery ratio (FDR), defined as the misclassified ischemic core volume divided by the total ischemic core volume, was calculated. Median values of voxel-based CTP parameter values (rMTT, aCBF, rCBF, aCBV, and rCBV) were calculated per patient. Median of these median parameter values for misclassified ischemic core and ischemic lesion agreement amongst all patients were combined and analyzed separately with a rank-sum test. All analyses and visualization were performed in IBM SPSS 22.0 (IBM Corpora-tion, Armonk, New York, USA).
Results
Core volumes, false discovery ratio & identification of truncation
Median total CTP ischemic core volume was 49.7ml (IQR: 29.9–131.8ml, min.-max.: 12.2–
197.4ml). Median misclassified ischemic core volume was 30.4ml (IQR: 20.9–77.0ml, min.-max.: 5.1–159.7ml). Median ischemic lesion agreement volume was 18.6ml (IQR: 6.5–56.9ml, min.-max.: 1.9–98.0ml). Median FDR was 62% (IQR: 49%-80%, min.-max.: 23%-97%). These values are schematically presented inFig 2.
Truncation of AIF or VOF was observed in 12 out of 35 patients. Truncation of tissue TAC only was observed in 20 out of 35 patients.
Perfusion parameter value analysis
All perfusion parameter values were statistically significant different between misclassified ischemic core and ischemic lesion agreement areas(P<0.01). Median parameter values for all patients are shown inTable 2and Figs3–7.
Discussion
Comparison of baseline CTP ischemic core with follow-up noncontrast CT infarct showed that a large part of the ischemic CTP core volume was misclassified. For all perfusion parameters a significant difference was observed between misclassified ischemic core and ischemic lesion
Fig 1. Example of a misclassified ischemic core.A. Ischemic core as selected by CT perfusion software on baseline CTP (projected on follow-up noncontrast CT). B. Final infarct as determined on follow-up noncontrast CT. C. Misclassified ischemic core region projected on follow-up noncontrast CT.
agreement. This suggests that currently used thresholds and software used in this study cannot reliably identify ischemic core and may benefit from revisions.
To our knowledge, misclassification of CTP ischemic core volume has not been compared with follow-up noncontrast CT infarct volume to this extent. Several studies have compared CTP ischemic core volume with MR-DWI ischemic core volume obtained at baseline. A high measurement variability in ischemic core volumes was shown between both modalities, with large differences for CTP derived ischemic volumes compared to MR-DWI ischemic core vol-umes [36,37]. Our study agrees with the limited accuracy of CTP ischemic core volume estima-tions and shows that ischemic core misclassificaestima-tions are large. Underlying parameter values differed significantly between misclassified ischemic core and ischemic lesion agreement regions, suggesting room for improvement in threshold definition for ischemic core.
We acknowledge this study comprises a number of limitations. Infarct growth in the time between obtaining baseline CTP and follow-up noncontrast CT can impede accurate compari-son between baseline CTP ischemic core volume and follow-up infarct volume. This can lead to underestimation of the FDR of ischemic core on CTP. While misclassified ischemic core can only be caused by flaws in the CTP analysis, agreement between CTP and follow-up noncon-trast CT may be partly caused by infarct core growth. The infarcted lesion may grow in the time between baseline and follow-up imaging, therefore it is possible that tissue classified as
Fig 2. Total ischemic core volume (isc. core vol.), ischemic lesion agreement (light blue) and misclassified ischemic core (dark blue) volume (ml) and FDR (%) for all patients.If truncation was observed in time-attenuation curves (AIF/ VOF or tissue TAC), this is denoted as 1.
doi:10.1371/journal.pone.0141571.g002
Table 2. Median perfusion parameter values for misclassified and ischemic lesion agreement of all 35 patient specific values.
Parameter Misclassified ischemic core median (IQR) Ischemic lesion agreement median (IQR)
rMTT* 243% (198%-289%) 342% (249%-432%)
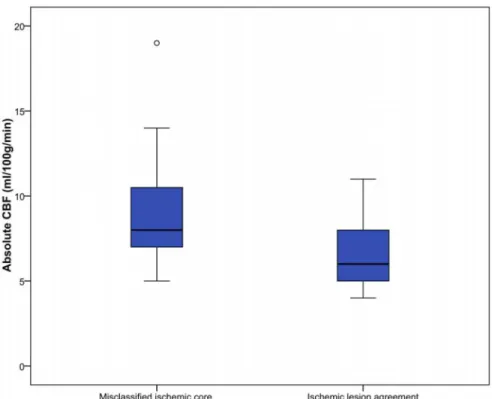
aCBF* 8 ml/100g/min (7–11 ml/100g/min) 6 ml/100g/min (5–8 ml/100g/min)
rCBF* 21.5% (17.3%-29.5%) 13.6% (9.7%-18.0%)
aCBV* 1.59 ml/100g (1.43–1.79 ml/100g) 1.38 ml/100g (1.15–1.49 ml/100g)
rCBV* 51.4% (39.3%-62.0%) 41.6% (31.6%-52.3%)
*Significantly different for misclassified and ischemic lesion agreement region (rank-sum, P<0.01).
Fig 3. Relative MTT (%) for misclassified ischemic core and ischemic lesion agreement.Threshold value for defining ischemic core is 145%, which is visualized in this figure by the horizontal line.
doi:10.1371/journal.pone.0141571.g003
Fig 4. Absolute CBF (ml/100g/min) for misclassified ischemic core and ischemic lesion agreement.
ischemic core on baseline CTP was actually misclassified at baseline but this misclassification was covered up due to infarct core growth [2,32,33,38].
Strict inclusion criteria were applied, excluding many patients, so results may not be gener-ally applicable. A large number of patients were excluded because of missing follow-up imag-ing. This may have resulted in a bias of our results since, for example, patients who did not survive the first days could not be included.
The level of misclassification may also be influenced by various baseline and imaging factors and may be correlated with patient outcome. However, with the relative low number of patients included in this study, the statistical power was not sufficient to correctly perform statistical tests to address this relation.
Though our sample size is relatively small, all perfusion parameters showed a significant dif-ference between the two groups. CT imaging was obtained from two manufacturers which could provide a limitation. It is possible that imaging data derived from different scanners pro-duce different results and may not co-operate optimally with the software. However, we observed similar FDR for both scanners. Furthermore, it has been suggested that insensi-tive methods might produce more accurate ischemic core classifications compared to delay-sensitive methods we used in this study [39]. This however, has recently been disputed. Delay-sensitive methods produce similar ischemic core volumes as delay-inDelay-sensitive methods if vali-dated thresholds are used [40]. Thresholds used in this study have been validated in previous studies and are currently used by this software in clinical practice. Several other studies found that usage of (sets of) other thresholds for the definition of infarct core used in other software packages might result in more accurate CTP assessments [18,41–44]. Due to limitations of the
Fig 5. Relative CBF (%) for misclassified ischemic core and ischemic lesion agreement.Proposed hypothetical threshold value for defining ischemic core is 31%, visualized by a dotted line [42].
software we were not able to evaluate the accuracy of using these alternative thresholds to define ischemic core.
Low signal to noise ratio contributes largely to limitation of CTP accuracy [45]. When quan-tified, CTP showed a relative low contrast-to-noise ratio (CNR), making it problematic to accu-rately analyze data [36]. Besides that, it has been shown that truncation of time-attenuation curves can cause inaccuracies in CTP-derived hemodynamic measurements [21,46]. We observed truncation in almost all patients. This was largely due to the applied scan protocol of 60 seconds of scanning, as a result of restricted acquisition times. However, we did not find a clear correlation between truncation and FDR, and could thus not relate truncation to inaccu-racies in CTP analysis.
Potential causes of the presented errors in CTP analysis could include biological and ana-tomical causes that can lead false perfusion results and either mimic or hamper (in-)correct diagnosis of acute ischemic stroke. This could be due to certain vascular or neurological dis-eases, variations in vascular anatomy and dysregulation, upstream flow restriction, cardiac out-put or lesions and old infarctions [22,23,27,46]. Misplacement of the patient and motion within the scanner, which is likely to occur in emergency settings, can further impede ideal CT imaging [24,27].
CTP software used in this study calculates ischemic core based on pre-set thresholds (rMTT145%, aCBV<2.0 ml/100g) [25]. Median values for both rMTT and aCBV for mis-classified ischemic core regions were closer to their threshold values than for ischemic lesion agreement regions, suggesting that some misclassification of ischemic core could be avoided if thresholds would be redefined. Thresholds currently used in CTP analysis are optimized for
Fig 6. Absolute CBV (ml/100g) for misclassified ischemic core and ischemic lesion agreement. Current threshold value for defining ischemic core is 2.0 ml/100g, and visualized by a horizontal line.
standard acquisition time (<60 sec). It is shown that extension of acquisition time could pro-duce more accurate results, which is increasingly performed [21,25,46]. Therefore, thresholds used currently could be suboptimal in individual cases. It has been suggested to abandon abso-lute thresholds and use rCBF as a possible optimal perfusion parameter for assessing ischemic core [42–44]. Our results for the rCBF parameter agree with this novel definition for ischemic core. In some cases usage of rCBF as threshold for ischemic core definition would have excluded some misclassified ischemic core regions.
The approach in which CTP parameters are associated with infarct core can be used to improve the current CTP analysis methods as it gives direct measures of these parameters at locations that end up as final infarct volume. Our study indeed shows that on a group level there are large differences between CTP parameters in CTP ischemic core volumes that end up as infarct and the volumes that ended up as healthy tissue on follow-up imaging. However, on a patient-specific level, current CTP analysis methods are insufficient. Approaches that use thresh-olding of voxel-based values to determine summary maps of ischemic core and penumbra are limited since CTP only reflects the current state of hemodynamics in brain tissue. Brain tissue’s accumulation of ischemic injury is gradual, and becomes irreversible only if reperfusion is not achieved and after a given time has elapsed. Treatment and time to reperfusion is not included in current CTP analysis packages, which is a conceptual limitation of the method currently used.
CTP can provide a valuable tool for ischemic core volume estimations in acute ischemic stroke patients, if causes for misclassification can be identified. Novel methods to define ischemic core, improved CT scanners, and more accurate postprocessing may improve CTP analysis and may eventually provide a powerful diagnostic method in acute ischemic stroke management.
Fig 7. Relative CBV (%) for misclassified ischemic core and ischemic lesion agreement.
Conclusion
This study has shown that perfusion analysis results in a large absolute and relative misclassi-fied ischemic core volume. There was a statistically significant difference for all perfusion parameter values between misclassified ischemic core and ischemic lesion agreement. This sug-gests that currently used thresholds and software used in this study cannot reliably identify ischemic core and may benefit from revisions.
Acknowledgments
The MR CLEAN investigators
Executive committee
Diederik W.J. Dippel1;Aad van der Lugt2;Charles B.L.M. Majoie3;Yvo B.W.E.M. Roos4;Robert J. van Oostenbrugge5;Wim H. van Zwam6;Olvert A. Berkhemer1,3; Puck S.S. Fransen1,2;Debbie Beumer1,5;Lucie A. van den Berg4
Local principal investigators
Wouter J. Schonewille7;Jan Albert Vos8;Charles B.L.M. Majoie3;Yvo B.W.E.M. Roos4;Paul J. Nederkoorn4;Marieke J.H. Wermer9;Marianne A.A. van Walderveen10;Robert J. van Oosten-brugge5;Wim H. van Zwam6;Julie Staals5;Jeannette Hofmeijer11;Jacques A. van Oostayen12; Geert J. Lycklama à Nijeholt13;Jelis Boiten14;Diederik W.J. Dippel1;Patrick A. Brouwer2;Bart J. Emmer2;Sebastiaan F. de Bruijn15;Lukas C. van Dijk16;L. Jaap Kappelle17;Rob H. Lo18;Ewoud J. van Dijk19;Joost de Vries20;Paul L.M. de Kort21;Jan S.P. van den Berg22;Boudewijn A.A.M. van Hasselt23;Leo A.M. Aerden24;René J. Dallinga25;Marieke C. Visser26;Joseph C.J. Bot27;Patrick C. Vroomen28;Omid Eshghi29;Tobien H.C.M.L. Schreuder30;Roel J.J. Heijboer31;Koos Keizer32; Alexander V. Tielbeek33;Heleen M. den Hertog34;Dick G. Gerrits35;Renske M. van den Berg-Vos36;Giorgos B. Karas37
Imaging assessment committee
Charles B.L.M. Majoie3(chair);Wim H. van Zwam6;Aad van der Lugt2;Geert J. Lycklama à Nijeholt13;Marianne A.A. van Walderveen10, Joseph C.J. Bot27;Henk A. Marquering38;Ludo F. Beenen3;Marieke E.S. Sprengers3;Sjoerd F.M. Jenniskens39, René van den Berg3;Olvert A. Ber-khemer1,3;Albert J. Yoo40
Outcome assessment committee
Yvo B.W.E.M. Roos4(chair);Peter J. Koudstaal1;Jelis Boiten;Ewoud J. van Dijk19
Adverse event committee
Robert J. van Oostenbrugge5(chair);Marieke J.H. Wermer9;H. Zwenneke Flach23
Trial statisticians
Ewout W. Steyerberg41;Hester F. Lingsma41
Data monitoring committee
Advisory board
Tommy Andersson45;Heinrich P. Mattle46;Nils Wahlgren47;Peter J. Koudstaal1
Research nurses / local trial coordinators
Esther van der Heijden1;Naziha Ghannouti1;Nadine Fleitour4;Imke Hooijenga4;Annemieke Lindl-Velema5;Corina Puppels7;Wilma Pellikaan7;Kirsten Janssen9;Nicole Aaldering11;Marjan Elfrink11;Joke de Meris14;Annet Geerlings19;Gina van Vemde22;Ans de Ridder17;Paut Greebe17; José de Bont-Stikkelbroeck21;Willy Struijk15;Tiny Simons30;Gert Messchendorp28;Friedus van der Minne28;Hester Bongenaar32;Karin Bodde26;
PhD / Medical students
Silvan Licher1;Nikki Boodt;Adriaan Ros1;Esmee Venema1;Ilse Slokkers1;Raymie-Jayce Gan-pat1;Maxim Mulder1;Nawid Saiedie1;Alis Heshmatollah1;Stefanie Schipperen1;Stefan Vinken1; Tiemen van Boxtel1;Jeroen Koets1;Merel Boers38;Emilie Santos2;38;Jordi Borst3;Ivo Jansen3; Manon Kappelhof3;Marit Lucas38;Ralph Geuskens38;Renan Sales Barros38;Roeland Dobbe38; Marloes Csizmadia38
List of affiliations
Department of Neurology1, Radiology2, Public Health41, Erasmus MC University Medical Cen-ter;Department of Radiology3, Neurology4, Biomedical Engineering and Physics38, Academic Medical Center, Amsterdam; Department of Neurology5, Radiology6, Maastricht University Medical Center and Cardiovascular Research Institute Maastricht (CARIM); Department of Neurology7, Radiology8, Sint Antonius Hospital, Nieuwegein; Department of Neurology9, Radiology10, Medical Statistics and Bioinformatics44, Leiden University Medical Center; Department of Neurology11, Radiology12, Rijnstate Hospital, Arnhem; Department of Radiol-ogy13, Neurology14, MC Haaglanden, the Hague; Department of Neurology15, Radiology16, HAGA Hospital, the Hague; Department of Neurology17, Radiology18, University Medical Center Utrecht; Department of Neurology19, Neurosurgery20, Radiology39, Radboud Univer-sity Medical Center, Nijmegen; Department of Neurology21, Sint Elisabeth Hospital, Tilburg; Department of Neurology22, Radiology23, Isala Klinieken, Zwolle; Department of Neurology24, Radiology25, Reinier de Graaf Gasthuis, Delft; Department of Neurology26, Radiology27, VU Medical Center, Amsterdam; Department of Neurology28, Radiology29, University Medical Center Groningen, the Netherlands; Department of Neurology30, Radiology31, Atrium Medical Center, Heerlen; Department of Neurology32, Radiology33, Catharina Hospital, Eindhoven; Department of Neurology34, Radiology35, Medical Spectrum Twente, Enschede; Department of Neurology36, Radiology37, Sint Lucas Andreas Hospital, Amsterdam; all in the Netherlands
Department of Radiology40, Texas Stroke Institute, Texas, United States of America; UCL Institute of Neurology42, National Hospital for Neurology and Neurosurgery, London, United Kingdom; Med. Fakultät43, Uniklinik Köln, Germany; Department of Radiology45, Neurol-ogy47, Karolinska Univeristy Hospital, Stockholm, Sweden; Department of Neurology46, Uni-versity Hospital of Bern, Switzerland
Contact for consortium
Prof. dr. Charles B.L.M. Majoie Dept. of Radiology
Tel: +31 20 56 65 827 / E-mail:[email protected]
Author Contributions
Conceived and designed the experiments: RREGG JB ML AMMB OAB YBWEMR MAAvW SFMJ WHvZ DWJD CBLMM HAM. Performed the experiments: RREGG JB ML AMMB HAM. Analyzed the data: RREGG JB ML AMMB OAB YBWEMR MAAvW SFMJ WHvZ DWJD CBLMM HAM. Contributed reagents/materials/analysis tools: RREGG JB ML AMMB OAB YBWEMR MAAvW SFMJ WHvZ DWJD CBLMM HAM. Wrote the paper: RREGG JB ML AMMB OAB YBWEMR MAAvW SFMJ WHvZ DWJD CBLMM HAM.
References
1. Wintermark M, Albers GW, Broderick JP, Demchuk AM, Fiebach JB, Fiehler J, et al. Acute Stroke Imag-ing Research Roadmap II. Stroke. 2013; 44: 2628–39. PMID:23860298
2. Saver JL. Time is brain—Quantified. Stroke. 2006; 37: 263–266. PMID:16339467
3. Jauch EC, Saver JL, Adams HP, Bruno A, Connors JJB, Demaerschalk BM, et al. Guidelines for the early management of patients with acute ischemic stroke: A guideline for healthcare professionals from the American Heart Association/American Stroke Association. Stroke. 2013; 44: 870–947. PMID: 23370205
4. Hacke W, Kaste M, Bluhmki E, Brozman M, Davalos A, Guidetti D, et al. Thrombolysis with Alteplase 3 to 4.5 Hours after Acute Ischemic Stroke. N Engl J Med. 2008; 359: 877–889.
5. Berkhemer OA, Fransen PSS, Beumer D, van den Berg LA, Lingsma HF, Yoo AJ, et al. A Randomized Trial of Intraarterial Treatment for Acute Ischemic Stroke. N Engl J Med. 2014; 141217070022009. doi: 10.1056/NEJMoa1411587
6. Campbell BCV, Mitchell PJ, Kleinig TJ, Dewey HM, Churilov L, Yassi N, et al. Endovascular Therapy for Ischemic Stroke with Perfusion-Imaging Selection. N Engl J Med. 2015; 150211090353006. doi:10. 1056/NEJMoa1414792
7. Goyal M, Demchuk AM, Menon BK, Eesa M, Rempel JL, Thornton J, et al. Randomized Assessment of Rapid Endovascular Treatment of Ischemic Stroke. N Engl J Med. 2015; 1019–1030. doi:10.1056/ NEJMoa1414905PMID:25671798
8. Jovin TG, Chamorro A, Cobo E, de Miquel MA, Molina CA, Rovira A, et al. Thrombectomy within 8 Hours after Symptom Onset in Ischemic Stroke. 2015; 1–11. doi:10.1056/NEJMoa1503780 9. Saver JL, Goyal M, Bonfare A, Diener H-C, Levy EI, Pereira VM, et al. Stent-Retriever Thrombectomy
after Intravenous t-PA vs. t-PA Alone in Stroke. 2015; 1–11. doi:10.1056/NEJMoa1415061
10. Yoo AJ, Leslie-Mazwi TM, Jovin TG. Future directions in IAT: better studies, better selection, better tim-ing and better techniques. J Neurointerv Surg. 2013; 5 Suppl 1: i1–6. PMID:23572460
11. Tarpley J, Franc D, Tansy AP, Liebeskind DS. Use of perfusion imaging and other imaging techniques to assess risks/benefits of acute stroke interventions. Curr Atheroscler Rep. 2013; 15: 336. PMID: 23666875
12. Wintermark M, Maeder P, Thiran J-P, Schnyder P, Meuli R. Quantitative assessment of regional cere-bral blood flows by perfusion CT studies at low injection rates: a critical review of the underlying theoret-ical models. Eur Radiol. 2001; 11: 1220–1230. doi:10.1007/s003300000707PMID:11471616
13. Konstas A, Goldmakher G, Lee T-Y, Lev M. Theoretic basis and technical implementations of CT perfu-sion in acute ischemic stroke, part 2: technical implementations. AJNR Am J Neuroradiol. 2009; 30: 885–92. PMID:19299489
14. Konstas A, Goldmakher G, Lee T-Y, Lev M. Theoretic basis and technical implementations of CT perfu-sion in acute ischemic stroke, part 1: Theoretic basis. AJNR Am J Neuroradiol. 2009; 30: 662–8. PMID: 19270105
15. Wintermark M, Meuli R, Browaeys P, Reichhart M, Bogousslavsky J, Schnyder P, et al. Comparison of CT perfusion and angiography and MRI in selecting stroke patients for acute treatment. Neurology. 2007; 68: 694–7. PMID:17325279
16. Grand S, Tahon F, Attye A, Lefournier V, Le Bas J-F, Krainik A. Perfusion imaging in brain disease. Diagn Interv Imaging. Elsevier Masson SAS; 2013; 94: 1241–57.
18. Campbell BCV, Yassi N, Ma H, Sharma G, Salinas S, Churilov L, et al. Imaging selection in ischemic stroke: feasibility of automated CT-perfusion analysis. Int J Stroke. 2015; 10: 51–54. doi:10.1111/ijs. 12381PMID:25319251
19. Fahmi F, Marquering HA, Streekstra GJ, Beenen LFM, Velthuis BK, VanBavel E, et al. Differences in CT perfusion summary maps for patients with acute ischemic stroke generated by 2 software pack-ages. AJNR Am J Neuroradiol. 2012; 33: 2074–80. PMID:22555577
20. Kudo K, Sasaki M, Yamada K, Momoshima S, Utsunomiya H, Shirato H, et al. Differences in CT Perfu-sion Maps Generated by Different Commercial Software : Quantitative Analysis by Using Identical Source. Neuroradiology. 2010; 254: 200–209.
21. Borst J, Marquering HA, Beenen LFM, Berkhemer OA, Dankbaar JW, Riordan AJ, et al. Effect of Extended CT Perfusion Acquisition Time on Ischemic Core and Penumbra Volume Estimation in Patients with Acute Ischemic Stroke due to a Large Vessel Occlusion. PLoS One. 2015; 10: e0119409. doi:10.1371/journal.pone.0119409PMID:25789631
22. Lui YW, Tang ER, Allmendinger AM, Spektor V. Evaluation of CT perfusion in the setting of cerebral ischemia: patterns and pitfalls. AJNR Am J Neuroradiol. 2010; 31: 1552–63. PMID:20190208 23. Allmendinger AM, Tang ER, Lui YW, Spektor V. Imaging of stroke: Part 1, Perfusion CT—overview of
imaging technique, interpretation pearls, and common pitfalls. AJR Am J Roentgenol. 2012; 198: 52– 62. PMID:22194479
24. Fahmi F, Beenen LFM, Streekstra GJ, Janssen NY, de Jong HW, Riordan A, et al. Head movement dur-ing CT brain perfusion acquisition of patients with suspected acute ischemic stroke. Eur J Radiol. Else-vier Ireland Ltd; 2013; 82: 2334–41.
25. Wintermark M, Flanders AE, Velthuis B, Meuli R, van Leeuwen M, Goldsher D, et al. Perfusion-CT assessment of infarct core and penumbra: receiver operating characteristic curve analysis in 130 patients suspected of acute hemispheric stroke. Stroke. 2006; 37: 979–85. PMID:16514093 26. Kaufmann AM, Firlik AD, Fukui MB, Wechsler LR, Jungries CA, Yonas H. Ischemic Core and
Penum-bra in Human Stroke. Stroke. 1999; 30: 93–99. doi:10.1161/01.STR.30.1.93PMID:9880395
27. Best AC, Acosta NR, Fraser JE, Borges MT, Brega KE, Anderson T, et al. Recognizing False Ischemic Penumbras in CT Brain Perfusion Studies. Radiogr a Rev Publ Radiol Soc North Am Inc. 2012; 32: 1179–1196.
28. Zhao L, Barlinn K, Bag AK, Kesani M, Cava LF, Balucani C, et al. Computed tomography perfusion prognostic maps do not predict reversible and irreversible neurological dysfunction following reperfu-sion therapies. Int J Stroke. 2011; 6: 544–546. PMID:22111800
29. Campbell BCV, Tu HTH, Christensen S, Desmond PM, Levi CR, Bladin CF, et al. Assessing Response to Stroke Thrombolysis: Validation of 24-Hour Multimodal Magnetic Resonance Imaging. Arch Neurol. 2012; 69: 46–50. PMID:21911654
30. Benson J, Payabvash S, Salazar P, Jagadeesan B, Palmer CS, Truwit CL, et al. Comparison of CT per-fusion summary maps to early difper-fusion-weighted images in suspected acute middle cerebral artery stroke. Eur J Radiol. Elsevier Ireland Ltd; 2015; doi:10.1016/j.ejrad.2014.12.026
31. Saver JL, Johnston KC, Homer D, Wityk R, Koroshetz W, Truskowski LL, et al. Infarct volume as a sur-rogate or auxiliary outcome measure in ischemic stroke clinical trials. The RANTTAS Investigators. Stroke. 1999; 30: 293–298. PMID:9933262
32. Rosso C, Hevia-Montiel N, Deltour S, Bardinet E, Dormont D, Crozier S, et al. Prediction of infarct growth based on apparent diffusion coefficients: penumbral assessment without intravenous contrast material. Radiology. 2009; 250: 184–192. PMID:19017923
33. Finitsis S, Kemmling A, Havemeister S, Thomalla G, Fiehler J, Brekenfeld C. Stability of ischemic core volume during the initial hours of acute large vessel ischemic stroke in a subgroup of mechanically revascularized patients. Neuroradiology. 2014; 56: 325–332. PMID:24468860
34. Klein S, Staring M, Murphy K, Viergever MA, Pluim JPW. elastix: a toolbox for intensity-based medical image registration. IEEE Trans Med Imaging. 2010; 29: 196–205. PMID:19923044
35. Boers AM, Marquering HA, Jochem JJ, Besselink NJ, Berkhemer OA, van der Lugt A, et al. Automated cerebral infarct volume measurement in follow-up noncontrast CT scans of patients with acute ischemic stroke. AJNR Am J Neuroradiol. 2013; 34: 1522–7. PMID:23471018
36. Schaefer PW, Souza L, Kamalian S, Hirsch JA, Yoo AJ, Kamalian S, et al. Limited Reliability of Com-puted Tomographic Perfusion Acute Infarct Volume Measurements Compared With Diffusion-Weighted Imaging in Anterior Circulation Stroke. 2015; M: 419–425. doi:10.1161/STROKEAHA.114.007117
38. Zhu G, Michel P, Aghaebrahim A, Patrie JT, Xin W, Eskandari A, et al. Prediction of recanalization trumps prediction of tissue fate: The penumbra: A dual-edged sword. Stroke. 2013; 44: 1014–1019. PMID:23463751
39. Konstas AA, Lev MH. CT perfusion imaging of acute stroke: the need for arrival time, delay insensitive, and standardized postprocessing algorithms? Radiology. 2010; 254: 22–25. PMID:20032139
40. Man F, Patrie JT, Xin W, Zhu G, Hou Q, Michel P, et al. Delay-sensitive and delay-insensitive deconvo-lution perfusion-CT: similar ischemic core and penumbra volumes if appropriate threshold selected for each. Neuroradiology. 2015; doi:10.1007/s00234-015-1507-7
41. Olivot J-M, Mlynash M, Thijs VN, Kemp S, Lansberg MG, Wechsler L, et al. Optimal Tmax threshold for predicting penumbral tissue in acute stroke. Stroke. 2009; 40: 469–75. PMID:19109547
42. Campbell BCV, Christensen S, Levi CR, Desmond PM, Donnan GA, Davis SM, et al. Cerebral blood flow is the optimal CT perfusion parameter for assessing infarct core. Stroke. 2011; 42: 3435–3440. PMID:21980202
43. Kamalian S, Kamalian S, Maas MB, Goldmacher G V., Payabvash S, Akbar A, et al. CT cerebral blood flow maps optimally correlate with admission diffusion-weighted imaging in acute stroke but thresholds vary by postprocessing platform. Stroke. 2011; 42: 1923–1928. PMID:21546490
44. Dani KA, Thomas RGR, Chappell FM, Shuler K, MacLeod MJ, Muir KW, et al. Computed tomography and magnetic resonance perfusion imaging in ischemic stroke: definitions and thresholds. Ann Neurol. 2011; 70: 384–401. PMID:21796665
45. Gonzalez RG. Low signal, high noise and large uncertainty make CT perfusion unsuitable for acute ischemic stroke patient selection for endovascular therapy. J Neurointerv Surg. 2012; 4: 242–245. PMID:22679196