www.atmos-chem-phys.net/8/1911/2008/ © Author(s) 2008. This work is distributed under the Creative Commons Attribution 3.0 License.
Chemistry
and Physics
Global fire activity patterns (1996–2006) and climatic influence: an
analysis using the World Fire Atlas
Y. Le Page1, J. M. C. Pereira1, R. Trigo2, C. da Camara2, D. Oom3, and B. Mota1
1Technical University of Lisbon, Instituto Superior de Agronomia, Department of Forestry, Tapada da Ajuda 1349-017 Lisboa, Portugal
2Lisbon University, Geophysical Center, Department of Physics, Campo Grande, Ed C8, Piso 6, 1749-016 Lisboa, Portugal 3Tropical Research Institute, Remote Sensing Centre, Tv. Conde da Ribeira 9, 1300-142 Lisboa, Portugal
Received: 12 October 2007 – Published in Atmos. Chem. Phys. Discuss.: 28 November 2007 Revised: 13 February 2008 – Accepted: 29 February 2008 – Published: 2 April 2008
Abstract.Vegetation fires have been acknowledged as an en-vironmental process of global scale, which affects the chem-ical composition of the troposphere, and has profound eco-logical and climatic impacts. However, considerable uncer-tainty remains, especially concerning intra and inter-annual variability of fire incidence. The main goals of our global-scale study were to characterise spatial-temporal patterns of fire activity, to identify broad geographical areas with sim-ilar vegetation fire dynamics, and to analyse the relation-ship between fire activity and the El Ni˜no-Southern Os-cillation. This study relies on 10 years (mid 1996–mid 2006) of screened European Space Agency World Fire At-las (WFA) data, obtained from Along Track Scanning Ra-diometer (ATSR) and Advanced ATSR (AATSR) imagery. Empirical Orthogonal Function analysis was used to reduce the dimensionality of the dataset. Regions of homogeneous fire dynamics were identified with cluster analysis, and in-terpreted based on their eco-climatic characteristics. The impact of 1997–1998 El Ni˜no is clearly dominant over the study period, causing increased fire activity in a variety of regions and ecosystems, with variable timing. Overall, this study provides the first global decadal assessment of spatial-temporal fire variability and confirms the usefulness of the screened WFA for global fire ecoclimatology research.
1 Introduction
Vegetation fires are an ecological process strongly responsive to climatic drivers, which have substantial impacts on bio-geochemical cycles, at scales ranging from local to global. As an indicator of the relevance of this phenomenon, re-ports from various sources estimate fires to affect on average
Correspondence to:Y. Le Page
3.5 million km2of vegetation in recent years, the size of In-dia, with ensuing carbon emissions equivalent to a third of fossil fuel combustion, and further characterised by impor-tant year to year variability (Tansey et al., 2004a,b ; Ito and Penner, 2004 ; van der Werf et al., 2006). Bond et al. (2005) simulating a world without fires, obtained a virtual land cover where closed forests had doubled their area relatively to ac-tual contemporary extent. Other impacts include for example changes in the Earth’s planetary albedo and radiative budget (Govaerts et al., 2002; Schafer et al., 2002; Kaufman and Ko-ren, 2006), damages to endangered species (Loboda, 2004), or coral reef asphyxiation (Abram et al., 2003).
The Global Climate Observing System (GCOS, 2006) considered fire disturbance an “Essential Climate Variable” and highlighted the need for long data time series to quantify the links between climate and fire. Originally local phenom-ena, it becomes globally relevant due to the integrating role of the atmosphere in two distinct ways. Combustion products are entrained and transported at wide range of distances, de-pending on the nature of the chemical species, atmospheric stability, and fire intensity (Damoah et al., 2004). The sec-ond globalising effect of the atmosphere occurs through the synchronisation of fire weather conditions at distant loca-tions, via teleconnection mechanisms induced by climatic modes. The El Ni˜no – Southern Oscillation (ENSO) is the best known of these mechanisms, but similar roles have been assigned to the Arctic Oscillation (AO) (Balzter et al., 2005; Patra et al., 2005), Pacific Decadal Oscillation (PDO) and Atlantic Multidecadal Oscillation (AMO) (Kitzberger et al., 2007), the Indian Ocean Dipole and the North Atlantic Os-cillation (Patra et al., 2005).
1912 Y. Le Page et al.: Fire activity variability over the last decade the next section, and relatively high frequency, including the
occurrence of one strong and two weaker El Ni˜no phases over the study period.
2 ENSO-fire relationships
The El Ni˜no-Southern Oscillation is a natural, coupled atmospheric-oceanic cycle in the tropical Pacific Ocean (Trenberth 1997, Diaz et al., 2001). Normal conditions are characterised by warm surface waters in the western Pacific, while cool water wells up in the eastern Pacific, a pattern that is sustained by westward winds. El Ni˜no, the warm phase of ENSO, is set when the trade winds weaken or reverse, due to changes in air pressure gradient over east and west Pacific. Warm waters and the convection zone they induce are there-fore driven eastward. El Ni˜no episodes, which occur every 3 to 7 years and last from 12 to 18 months, are character-ized by an increase in ocean surface temperature of about 3 to 6◦C, ranging from the coastal zone of Peru and Ecuador to the centre of the equatorial Pacific Ocean. This warm-ing causes long-term meteorological disturbances over the tropical land surface, including a reversal of normal rainfall patterns, and also has substantial impacts on extensive extra-tropical regions. The reverse situation, i.e. a greater sea sur-face temperature gradient, defines ENSO cold phase, or La Ni˜na episodes, which often follow El Ni˜no events (Diaz et al., 2001).
The above-described meteorological anomalies associated to ENSO are usually referred to as teleconnection patterns, which are characterised by recurring and persistent, larscale patterns of atmospheric flow that encompass vast ge-ographical areas and possess characteristic long time-scales of variability. Teleconnections are associated to statistically significant links between weather changes occurring in sep-arated regions which, in the case of ENSO teleconnections appear to be stronger throughout the tropics and in parts of North America and Oceania (Glantz, 2001). They are also present, but weaker, in Europe and extra-tropical Asia. The direct effects of ENSO and its teleconnections are reflected in precipitation and temperature anomalies (Allan et al., 1996) on a scale dependent basis, major peaks in the spatial extent of drought and excessively wet conditions being generally as-sociated with extreme phases of ENSO (Lyon and Barnston, 2005).
The sequence of events that may lead to changes in fire ac-tivity varies with the type of ecosystem considered. In most tropical regions, where net primary productivity is high, El Ni˜no induces droughts, leading to vegetation dryness, tree mortality and fire outbreaks. In semi-arid and arid ecosys-tems, where precipitation is a limiting factor, increased rain-fall under El Ni˜no conditions first results in a pulse of pro-ductivity and fuel accumulation followed, when conditions are back to normal or under La Ni˜na phase, by fuel drying and high flammability (Holmgren et al., 2006).
As pointed out in previous teleconnection studies, climate variability in SE Asia is highly determined by the ENSO sig-nal. In particular, under El Ni˜no conditions, rainfall is lim-ited and long periods of droughts may be experienced, while La Ni˜na generally implies wetter than average conditions. Fire – ENSO relations are thus expected to be particularly strong in this region, and numerous studies have focused on the large fires that were observed during the two strongest re-cent El Ni˜no events, namely in 1982–1983 and in 1997–1998 (Siegert et al., 2001; Schimel and Baker, 2002; Doherty et al., 2006). Fuller and Murphy (2006) reported a strong correla-tion between fires and ENSO indices, such as the Southern Oscillation Index (SOI) and the Ni˜no 3.4 index, for forested areas located between the latitudes 5.5◦S and 5.5◦N.
Fire – ENSO teleconnections have been extensively ad-dressed in North America. Simard et al. (1985) analyzed 53 years of USA fire statistics and found decreased fire activity during El Ni˜no in the South. Swetnam and Betancourt (1990) used pyrodendrochronology and fire statistics data from Ari-zona and New Mexico for the period 1700–1983. They con-cluded that small areas typically burn after wet spring sea-sons, associated with El Ni˜no, while larger burned areas tend to burn after dry springs, associated with the La Ni˜na phase of ENSO. Veblen et al. (2000) determined that years of exten-sive burning in Colorado had a tendency to occur during La Ni˜na years, often preceded by two to four years of wetter than average Springs, generally related to El Ni˜no phases, increas-ing fine fuel production. An alternation of wet and dry pe-riods in two to five year cycles favours widespread fires and displays strong links with ENSO. El Ni˜no also tends to pro-duce unusually warm and dry conditions in interior Alaska (Hess et al., 2001). In this region, during the years 1940 to 1998, 15 out of the 17 biggest fire years occurred under moderate to strong El Ni˜no and were, responsible for 63% of the area burned over the whole period. Other fire – ENSO teleconnections in the USA were also reported for the Rocky Mountains (Schoennagel et al., 2005) and Florida (Beckage et al., 2003).
In the Mexican state of Chiapas, Roman-Cuesta et al. (2003) found a clear influence of El Ni˜no on the types of ecosystems affected by fire. In non-El Ni˜no years, burning primarily affects very flammable pine-oak vegetation, while in El Ni˜no years, normally less flammable rainforests burn extensively, due to anomalous drought conditions.
Kitzberger et al. (2001) detected inter-hemispheric syn-chrony between fire seasons in the South West USA and northern Patagonia, Argentina. Major fire years typically oc-cur after a switch from El Ni˜no to La Ni˜na conditions, due to the already mentioned pattern of enhanced fine fuel pro-duction during the ENSO warm phase, and prevailing dry conditions during the cold phase.
increases markedly during El Ni˜no periods. Similar conclu-sions were reported by Lindesay (2003).
Other regions are teleconnected to the ENSO phe-nomenon, and regional fire regimes are likely to be affected. For example, the East African climate is under the influ-ence of the Indian Ocean Dipole, which is itself altered by ENSO (Black, 2005). In other cases, the exceptionally in-tense 1997–1998 El Ni˜no episode is believed to be respon-sible for important fire events in regions previously not re-ported to be sensitive, such as Far East Siberia (National Cli-matic Data Center (NCDC, 1998 Annual Review, 1999).
3 Data and method
3.1 The world fire atlas
Several fire datasets have been developed in recent years, and each product is bound to present some advantages and limita-tions. We evaluated these datasets for our specific purposes, especially taking into account the available time series and their consistency.
The longest time series were produced using Pathfinder AVHRR Land (PAL) 8 km resolution data (Carmona-Moreno et al., 2005; Ria˜no et al., 2007) spanning 17–20 years, with monthly resolution. The accuracy of these burned area prod-ucts is, however, limited by the radiometric and orbital in-consistencies in the original dataset in the first case, and by the global application of a burned area mapping supervised classifier trained exclusively with data from Africa, in both cases.
Justice et al. (2002) and Giglio et al. (2003) developed a multi-year daily active fire product from the Moderate Res-olution Imaging Spectroradiometer (MODIS). This product has a good detection rate, due to its 4 daily overpasses, but is only available since early 2000.
The World Fire Atlas (WFA, Arino et al., 2005) is a global active fire product, developed with data acquired by the Along-Track Scanning Radiometer (ATSR-2) and the Advanced Along-Track Scanning Radiometer (AATSR), on-board the second European Remote Sensing Satellite (ERS-2) and the Environment Satellite (ENVISAT), respectively. The full dataset covers the period from November 1995 to the present, with a gap between January and June 1996. The spatial resolution of ATSR-2 and AATSR is 1km at nadir and the 512 km swath width allows for an equatorial revisiting period of 3 days. Data for the WFA are acquired at night (around 10 p.m. local time).
We selected the WFA for its consistency, and the period of data available, which includes 2 minor El Ni˜no events, and the large El Ni˜no event of 1997–1998 followed by an equally important La Ni˜na episode. This product inherently screens out small, short duration burnings, mostly land use manage-ment and savannah fires, which show a strong diurnal cycle and do often not burn overnight. Those fires are thus likely
to be under-represented. However it was not considered very limiting since by considering anomalies, we reduced the de-pendency of our results to the absolute fire activity. Larger fires are also more likely to be under strong climatic control. Two fire databases are available within the WFA, based on two thresholds of the 3.7µm channel. Algorithm 1 relies on a 312K threshold, while for algorithm 2 a 308 K thresh-old is used. Detection sensitivity ranges from a burning area of 10 m2at 600 K to 1 m2at 800 K. The final WFA product consists of date, time, latitude and longitude of all pixels with temperature values exceeding the thresholds.
We chose algorithm 2 data, to reduce the overall under-estimation of fire activity (Arino and Plummer, 2001), a known limitation of the WFA. The data were then thoroughly screened to remove observations not corresponding to vege-tation fires (Mota el al., 2006). For the study period, about 29% of observations were thus screened out of the WFA. 3.2 WFA exploratory analysis
The spatial and monthly temporal fire variability contained in the WFA was analysed using a simple statistic representation. The screened WFA data were first aggregated by months, at a spatial resolution of 2.5◦latitude by 2.5◦longitude. As we are interested in anomalous fire events, the time series at each grid cell were deseasonalised, i.e. seasonal cycles were re-moved by subtracting to each monthly value the grand mean of the corresponding month for the considered 10-year pe-riod (Eq. 1):
Fds(m, y)=F (m, y)−
P
y
F (m)
10 (1)
whereF andFdsare respectively the fire activity and
desea-sonalised fire activity, at monthmof yeary in a given grid cell. Time series were subsequently standardized, i.e. each monthly value of the deseasonalised time series is further di-vided by the standard deviation of the corresponding month computed over the 10-year period (Eq. 2). Standardisation was performed with the aim of enhancing those fire-sensitive ecosystems that although being rarely affected by fires pos-sess less ability to rebound compared to other fire-dependent ecosystems (The Nature Conservancy, 2006). A weighting factor given by the percentage of continental surface of each grid-cell containing ocean or inland water bodies was finally applied to each standardized value (Eq. 2):
Fa(m, y) =
Fds(m, y)
σ (Fds)
×Lp (2)
whereFais the anomaly, at monthmof yeary at the
con-sidered grid cell, σ is the standard deviation of Fds of the
considered month over the 10-year period andLpis the land proportion in the grid cell.
1914 Y. Le Page et al.: Fire activity variability over the last decade
Latitude
1997 1998 1999 2000 2001 2002 2003 2004 2005 2006 −40
−20 0 20 40 60
0 2 4 −20 0 20 40 60
Firecounts/year/km2
Latitude
1997 1998 1999 2000 2001 2002 2003 2004 2005 2006 −3
−2 −1 0 1 2 3
Total monthly Anomalies
−0.5 0 0.5 1 1.5 a)
c)
b)
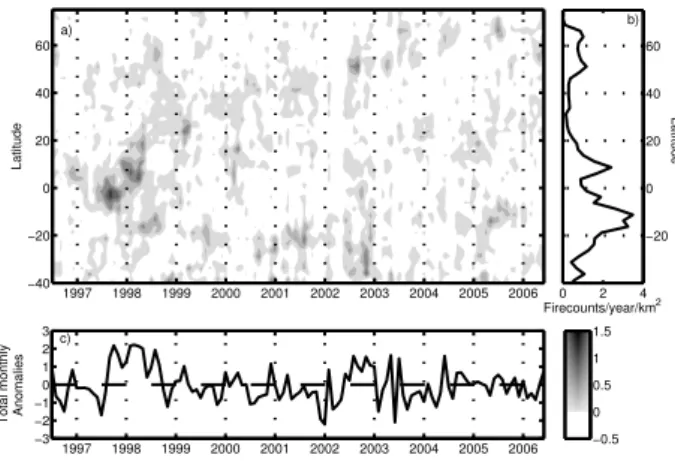
Fig. 1. (a)Time-latitude Hovmoller diagram of monthly
deseason-alised fire anomalies (positive anomalies only, scale indicated by the colorbar).(b)Fire counts by latitude (detection/year/km2), cor-rected by continental surface for each latitudinal band.(c)Monthly anomalies of the total deseasonalised fire counts over the 10 years.
fire activity gradient by latitude. Total anomalies over the 10 years, i.e. the deseasonalised sum of raw data, is also shown (Fig. 1c).
The most striking feature in the Hovmoller graph is the highly positive anomaly spanning from mid-1997 to the be-ginning of 1999 and extending along time to almost the whole range of latitudinal bands. This feature has been linked, at least for the majority of fire events, to the con-temporaneous 1997–1998 El Ni˜no through its impacts on re-gional temperature and precipitation (see Sect. 2). It reveals very clearly the global scope of this specific event, further pointed out by the total deseasonalised anomaly profile, with a broad peak of high positive values. The intense anomaly first appears around the equator, and then spreads gradually to the higher latitudes, reaching 60◦N by mid-1998.
Other conspicuous fire events include early 2000 in the northern tropics, and a succession of anomalies in southern extra-tropical regions from mid-2000 to early 2003. The last one is contemporaneous with fires in northern mid-latitudes, which greatly increased fire activity on a global scale during the year 2002. 2004 is the less perturbed year in terms of spatial anomalies, but global fire counts where anomalously high in June, due to boreal fires. In 2005, the high northern latitudes and the southern tropics exhibited above normal fire activity.
Although biased by the detection rate variability of the sensor (Sect. 3.1), a broad depression in fire activity centred around 30◦N is identified in Fig. 1c, corresponding to the global desert belt. There is another depression in the data over the equator, in spite of the strong 1997–1998 ENSO. Fires in most of those regions are sporadic, only occurring under strong droughts leading to low levels of moisture al-lowing for fire spread. Conversely, over tropical regions, ex-tensive savannah burning occurs regularly on an annual basis
due to the succession of wet and dry season and to agricul-tural activities.
As pointed out in this section, complex patterns of oc-currence of anomalous fire events are detected worldwide, revealing high rates of variability that appear to be driven by both global and regional processes. Time lags between ENSO and climatic anomalies at extra-tropical latitudes fur-ther complicate the extraction of clear and meaningful infor-mation from simple basic statistics, raising the need for more advanced analyses to unravel the temporal and spatial struc-turing of global fire activity for the 10-year long fire time series. In particular, the leading role of ENSO, clearly sug-gested here, is further explored.
3.3 Principal Component Analysis and clustering proce-dure
Principal Component Analysis (PCA) is a multivariate statis-tical technique whose aim is to extract spatio-temporal infor-mation when dealing with datasets formed by a large number of variables that are not statistically independent. This tech-nique allows computing an optimal new system of uncorre-lated variables, referred to as Principal Components (PCs). Each PC is expressed as a linear combination of the original variables, the coefficients of the linear combination being re-ferred to as the Empirical Orthogonal Function (EOF) of the corresponding PC. Since PCs are uncorrelated, the total vari-ance of the original dataset may be expressed as the sum of the variances of each PC. PCs are usually ranked in terms of decreasing explained variance and the dimensionality of the dataset may be often reduced by retaining a relatively low number of PCs that explain a sufficiently high part of the to-tal variance. Additional information on PCA applied to geo-sciences may be found in standard books, e.g. Wilks (2005) and von Storch and Zwiers (2002).
PCA is a purely statistical procedure, in the sense that it is entirely based on computing the eigenvectors and eigen-values of the covariance (or correlation) matrix of the data. However the first EOF/PC pairs often reflect physically meaningful patterns, which are associated to physical mech-anisms whose signatures in the dataset are captured by PCA. When such is the case, besides reducing data dimensionality, PCA leads to a better characterisation and understanding of the original dataset.
1996 1997 1998 1999 2000 2001 2002 2003 2004 2005 2006 -1
0 1 2 3
MEI
El Niño
La Niña
Fig. 2.MEI index time series. Darkgray/lightgray patches represent
El Ni˜no/La Ni˜na as identified by NOAA.
dimension) and covers 40 consecutive seasons (temporal di-mension), from June–August 1996 to March–May 2006.
Since there is no optimal criterion to decide on the num-ber of PC/EOF pairs that ought to be retained (Wilks, 2005), and taking into account that the aim of our study is to retain the most outstanding events, (and therefore not to maximise the variance explained), we adopted the approach based on the so-called Log-Eigenvalue (LEV) diagram (Craddock and Flood, 1969). The concept behind LEV is that the more dominant events represent a large proportion of variability, whereas the others explain an exponentially decreasing pro-portion of variance that appears as a decreasing near straight line towards the tail of the LEV diagram.
In order to further highlight the main modes of variabil-ity and better characterise their spatial organization, we per-formed a cluster analysis on the space of retained EOFs (spa-tial patterns). For this purpose, we used a hierarchical clus-tering procedure, i.e points were incrementally merged into clusters, from singletons (i.e. clusters with one grid cell) up to one single cluster at the last step. The chosen merging pro-cedure is based on the Ward’s linkage method, that uses the increase in the total within-cluster sum of squares as a result of joining two clusters (Ward, 1963; Milligan, 1980). The re-sulting cluster tree allows identifying the loss of information from step to step, and in particular those merging steps that lead to high increases of the linkage distance. The cluster tree is accordingly used as a support to decide on the final num-ber of clusters to be retained. Our discussion of spatial and temporal patterns of global fire activity, as well as on their re-lationship to climate and land cover, is ultimately structured around the resulting cluster map.
3.4 The Multivariate ENSO Index and its climatic context Several ENSO indices have been proposed, built with dif-ferent meteorological variables and defined over various re-gions. Hanley et al. (2003) published an evaluation of those indices and assessed their sensitivity to El Ni˜no/La Ni˜na events. We used the Multivariate ENSO Index (MEI), which is calculated as the first unrotated principal component of six observed variables over the tropical Pacific Ocean: sea level pressure, zonal and meridional components of surface wind, sea surface temperature, surface air temperature and
5 10 15 20 25 30 35
2 3 4 5 6 7
EOF number
Expl. Variance (%)
Cum. Var. 40%
Fig. 3. LEV diagram, based on a log-representation. The
thresh-old is defined as the elbow point of the line (set to 9, for 40% of explained variance).
total cloudiness fraction of the sky. MEI is expressed by means of standardized departures from zero and is positive (negative) under El Ni˜no (La Ni˜na) conditions. The observed maximum for the strongest recent El Ni˜no events is in the 3.0 range. Most events fall between 1 and 2. MEI correlates well with the Southern Oscillation Index (SOI) and with ENSO indices based on sea surface temperature.
Hanley et al. (2003) concluded that the MEI is very sen-sitive to ENSO and identifies events not detected by other indices. However, they considered it robust, and suitable for global studies, while other indices may be more appropriate for regional-scale research. Time series of MEI are avail-able from 1948 to present, from the National Oceanic and Atmospheric Administration (NOAA: http://www.cdc.noaa. gov/people/klaus.wolter/MEI/). Figure 2 illustrates the re-cent evolution of the MEI index for the 1996–2006 period and the El Ni˜no (La Ni˜na) events as identified by NOAA.
Figure 2 shows that one very strong and two mild El Ni˜no, and one strong La Ni˜na events were observed during the considered 10-year period. In 1997–1998, the strongest El Ni˜no on record triggered widespread climate perturbations, especially an extended drought in south-east Asia and South America. This was followed by a cold phase from late 1998 through 2000, which is associated with the opposite influ-ence in south-east Asia. 2002–2003 and 2004–2005 warm phases, albeit weaker, also affected large scale atmospheric circulation.
4 Results
4.1 Deseasonalised EOF fire count analysis
1916 Y. Le Page et al.: Fire activity variability over the last decade
-30 0 30
EOF1
30 0 -30
EOF2
-20 0 20
EOF3
-20 0 20
EOF4
1997 1999 2001 2003 2005
-20 0 20
EOF5
-20 0 20 EOF6
-20 0 20 EOF7
-20 0 20 EOF8
1997 1999 2001 2003 2005 -20
0 20 EOF9 -30
0 30
Fig. 4. Top nine PCs time series. Dark/Clear patches represent El
Ni˜no/La Ni˜na phases.
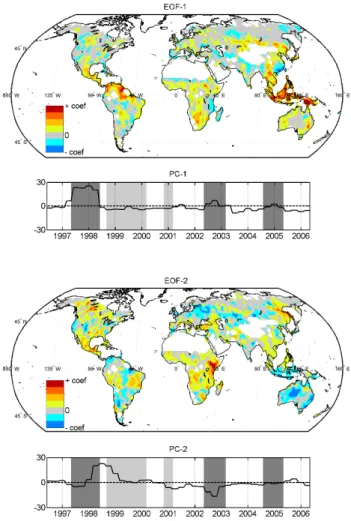
EOFs, representing 40% of the total variance. The relatively low value of retained variance from 9 EOFs indicates that fire anomalies are very scattered in time and space, being less condensable into a few dimensions than for example temper-ature, which classically has larger scale patterns and exhibits higher proportions of variance explained by the first EOFs. The complexity of those patterns is enhanced by our use of 3-monthly data, allowing a high temporal resolution of the observed patterns that would not be observed with annual anomalies. Standardisation also contributes to low values of explained variance, since it tends to give equal importance to all grid cells. However, as mentioned before this choice is justified so that fire sensitive ecosystems are not ignored. Performing the analysis with non-standardised data would result in focusing almost exclusively on regions of very high fire incidence (e.g. tropical savannahs and woodlands, pri-marily those located in Africa), which was considered unde-sirable. Figure 4 illustrates the PCs time series of the nine components retained, and Fig. 5 displays the spatial patterns extracted associated to EOF1 and EOF2.
EOF1 accounts for 6.6% of the total variance. High posi-tive loadings are concentrated in equatorial Asia and northern South America. The main events identified coincide with El Ni˜no periods (1997–1998 and, to a much lesser extent, 2002-20-03 and 2004–2005). The 1997–1998 event is remarkable for its length (one year) and the magnitude of the anomaly.
EOF2 accounts for 5.3% of the total variance. Coher-ent spatial patterns, with positive loadings are most evidCoher-ent in central East-Africa, Eastern Siberia, Eastern Brazil, Cen-tral America and CenCen-tral/Western Canada. Those regions also experienced extensive burning in 1998, but the ENSO-related fire activity occurred later than in regions highlighted in EOF1. This is likely due to the ENSO propagation process and the timing of the fire season, and will be discussed later. The various regional fire variability patterns represented by later EOFs, also merged through the PCA because of their spatial or temporal coherency, do not have such global driving mechanisms as EOF1 and EOF2. The featured pat-terns, rearranged through the clustering procedure, are
how-Fig. 5.EOF1 and EOF2 and corresponding PCs. Colorbar scale is
relative.
ever supported by former publications as will be shown in discussion.
4.2 Cluster analysis
4 19 11 5 33 21 13 16 24 37 31 32 23 38 29 6 14 3 15 7 20 0.4
0.6 0.8 1 1.2 1.4
Cluster Identification (with 40 clusters)
Linkage Distance
CL5
CL6 CL2 CL8 CL1 CL7 CL3 CL4
Fig. 6. Linkage distance tree. Retained clusters are indicated as
CL#.
years (time series) and for the seasonal cycle. Time series of precipitation data anomalies from the CMAP Precipita-tion data, provided by the NOAA/OAR/ESRL PSD, Boulder, Colorado, USA, (http://www.cdc.noaa.gov/) are also shown for each cluster, to illustrate the role of precipitation as a fire determinant.
Using the 1 km landcover product from University of Maryland (available online at http://glcf.umiacs.umd.edu/ data/), a quantitative assessment of fire-affected ecosystems is given for each year (Table 1), and each cluster (Table 1 Fig. 10) to assess the variability in affected ecosystems. We followed the method used by Tansey et al. (2004a, b) with the GBA2000 dataset, i.e. landcovers are aggregated into 4 broad vegetation types (Needleleaved and Mixed forests (N&MF), Broadleaved forests (BF), Woodlands and Shrub-lands (W&S), GrassShrub-lands and CropShrub-lands (G&C)). The quan-titative comparison to GBA2000 (Table 1) confirms previous findings that the detection rate of the ATSR sensor varies with landcover. Consequently, fire count distribution by landcover must be considered relatively (between clusters or through time) and not as an absolute quantification.
5 Discussion
5.1 WFA screened data detection characteristics
Results from an analysis based on active fires are expected to differ from those based on burned area, since the correla-tion between these two types of fire signal has been reported to be relatively weak for some regions or ecosystems (Ka-sischke et al., 2003 ; Arino and Plummer, 2001). The rela-tively low temporal resolution of the WFA (3–4 days) and the night-time overpass (10:00 p.m.) lead to underdetec-tion of low duraunderdetec-tion and intensity fires. As a consequence, forest fires represent a higher proportion of our data than in GBA2000 (∼17% vs. ∼3% in 2000). Comparison with MODIS active fires (Justice et al., 2002) and derived burned area data (Giglio et al., 2006) also shows underestimation of fire activity in agricultural areas and, more generally, in
CL 1 1
2
3
4
5 6 7 8
9
CL 2 1
2
3
4
5 6 7 8
9
CL 3 1
2
3
4
5 6 7 8
9
CL 4 1
2
3
4
5 6 7 8
9
CL 5 1
2
3
4
5 6 7 8
9
CL 6 1
2
3
4
5 6 7 8
9
CL 7 1
2
3
4
5 6 7 8
9
CL 8 1
2
3
4
5 6 7 8
9
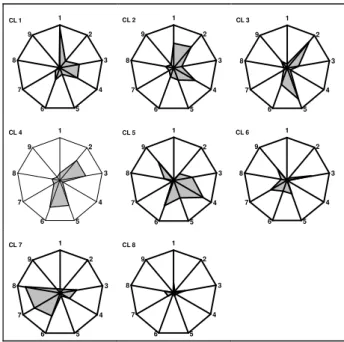
Fig. 7.Centroids coordinates of the 8 clusters along the 9 retained
EOFs, in absolute value. Star diagram axis length equals 0.04 EOF units.
Africa (unpublished results), where a large number of fires only burn at daytime. This means that our dataset does not take into account an unknown proportion of small fire events, thus focusing on the larger, longer lasting events, which are more likely to show a strong relationship with climate pat-tern. It should be stressed that these large vegetation fire events can also be considered to represent the most impor-tant fires in terms of biomass burnt and atmospheric emis-sions. We strongly believe that our other results, especially their temporal dynamic, are little affected by this bias since we worked with anomaly data. Finally, findings from Ka-sischke et al. (2003) suggest that remotely sensed fire data have variable inter-annual detection rates. Especially, high fire years exhibit increased fire intensity and decreased cloud cover, enhancing the detection rate. This may magnify the scale of positive anomalies identified in our study.
5.2 Global variability patterns over 1996–2006
The main space-time patterns of fire activity observed during the study period were classified into 8 clusters, illustrated in Figs. 8 and 9.
1918 Y. Le Page et al.: Fire activity variability over the last decade
Fig. 8.Spatial clusters of fire counts variability from 07/1996 to 06/2006. Isolated pixels were removed for clarity.
Table 1. Fire counts proportion (%) by year. GBA2000 indicates proportion of burned areas derived from this product (Tansey et al.,
2004a,b).
NLandM Forest BL Forest Woodlands and Shrublands Grasslands and Croplands
1997 2.5 26.4 56.8 12.7
1998 9.7 19.6 57.3 11.7
1999 4.6 17.0 65.2 11.6
2000 (GBA2000) 5.6 (1.5) 11.2 (1.2) 68.9 (80.7) 13.1 (16.6)
2001 3.1 1.2 67.0 16.0
2002 7.8 17.2 60.7 13.3
2003 14.7 16.0 55.3 12.4
2004 4.5 21.5 62.4 10.6
2005 3.6 20.9 60.3 13.5
Total 6.6 17.5 61.5 12.9
burning. The evergreen rainforest and peatlands were hugely affected by those fires (Page et al., 2002 ; Siegert and Hoff-mann, 2000). Murdiyarso and Adiningsih (2006) estimated the area affected at about 116 000 km2, resulting in the re-lease of 1.45 GtC, equivalent to half the annual atmospheric CO2growth rate.
In South America, cluster 1 includes large parts of the Amazon forest (in the Brazilian states of Amazonas, Roraima and Par´a, northern Brazil), as well as in Paraguay, north-east Argentina and southern Colombia. The Amazon basin expe-rienced one of the most severe droughts on record, leading to both tree mortality and intense burning (Williamson et. al,
2000 ; Cochrane et al., 1999). In Roraima, which burned intensively in early 1998, the affected area represented an es-timated 7% of the original forest ecosystem and more than doubled its previously deforested area (Barbosa et al., 2003). In Kazakhstan, 1997 was a very dry year, and large fires affected timber plantations (Arkhipov et al., 2000). However, these have not been connected to El Ni˜no and may result from other factors at the regional scale.
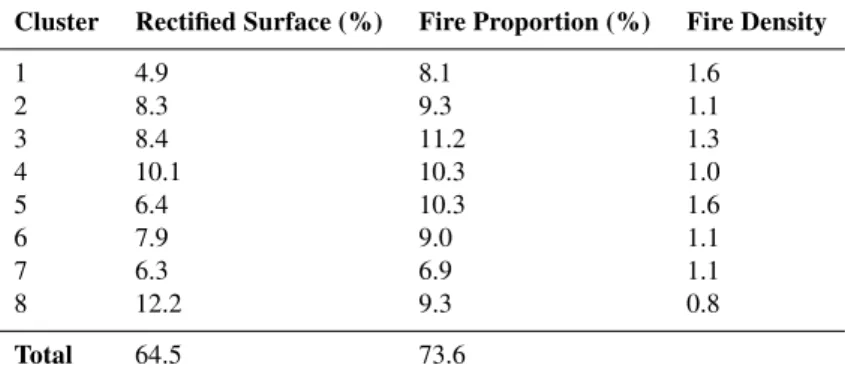
Table 2.Clusters global characteristics. Rectified surface is the proportion of total grid cells surface (rectified with latitude) with active fires in the cluster. Fire density is the ratio between the cluster percentage of total active fires and the corresponding rectified surface.
Cluster Rectified Surface (%) Fire Proportion (%) Fire Density
1 4.9 8.1 1.6
2 8.3 9.3 1.1
3 8.4 11.2 1.3
4 10.1 10.3 1.0
5 6.4 10.3 1.6
6 7.9 9.0 1.1
7 6.3 6.9 1.1
8 12.2 9.3 0.8
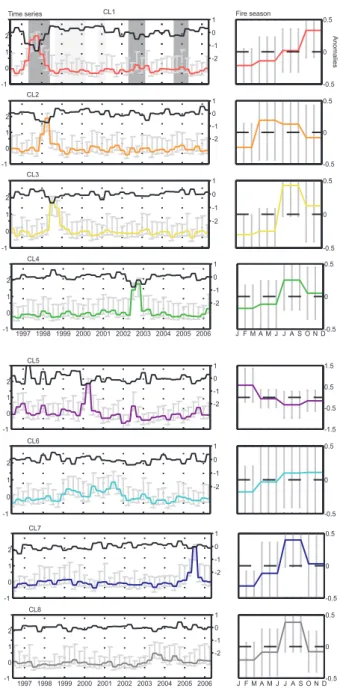
Total 64.5 73.6
but become highly flammable during occasional severe mois-ture deficits. This is particularly true in disturbed ecosys-tems, either subject to selective logging or peatland drainage. Although those regions were generally not much affected by fires over the rest of the period, this cluster has the high-est fire density, and almost 50% of the fire activity is de-tected in tropical forests, further indicating the scale of the 1997–1998 El Ni˜no episode (Table 2 and Fig. 10). Interest-ingly, although the 1997–1998 event clearly leads the cluster, a slight increase is observed in 2002–2003, corresponding to a weaker El Ni˜no phase, mainly affecting insular south-east Asia.
Cluster 2 is driven by EOF1, 2 and 4 (Fig. 7). It is mostly representative of sub-tropical regions affected by El Ni˜no in 1998, including south-east Asia, southern Africa and Central America. The corresponding enhanced fire activity peaks in March–April 1998, i.e. close but clearly afterwards the peak depicted by cluster 1 (Fig. 9). Dry conditions in Cen-tral America were provoked by a sub-tropical high pressure area settling over the region in the spring season, due to late El Ni˜no impact (NCDC, 1998 Annual Review, 1999). Agri-cultural fires escalating out of control were responsible for large areas of destroyed tropical forests. In tropical Mex-ico alone, Cairns et al. (1999) estimated a total of 4820 km2 affected area, while only 2230 km2 had been burned in the previous 17 years of satellite data availability, and the region has been reported to be sensitive to ENSO (Rom´an-Cuesta et al., 2003).
In south western Africa, the anomaly was actually due to an early start of the fire season, although fire activity appears not to have been exceptionally high.
South-east Asia, Thailand, Cambodia, Vietnam, Malaysia and the Philippines were highly affected by ENSO-induced dry conditions. In Thailand, extensive crown fires in pine forest and ground fires in peat-swamp forests contributed to a total burned area of more than 10 000 km2, largely above the annual average (Akaakara, 2002).
The landcover profile is diversified, but shows a
signifi-cant percentage of affected tropical forests. The average fire season for this cluster is bimodal, with one peak occurring in the first half of the year in south-east Asia and Mexico, and the other later in the year, in southern Africa. Overall, cluster 2 has a low fire density (1.1), which is not surprising since vegetation fires are very sporadic throughout most of its component regions, perhaps with the exception of Thailand. Regions in northern China and Canada are also included. They represent the start of two other important fire events connected to El Ni˜no, which further spread during the fol-lowing months, as identified in cluster 3.
Cluster 3 is mostly driven by EOF2 and EOF5 (Fig. 7). It groups regions in the Siberian Far East, central/western Canada, eastern Brazil and eastern Africa, all having their fire season cycle in phase, i.e with maxima occurring at ap-proximately the same time of the year. It is characterised by enhanced fire activity in June-August and September– November of 1998, mainly originating from a delayed im-pact of El Ni˜no. The Siberian Far East was hit by a se-vere drought for several months, after a high pressure cen-tre persisted from May to September (NCDC, 1998 Annual Review, 1999), leaving the region without adequate rain-fall. 72 000 km2of forests were affected, with roughly 10000 km2corresponding to high intensity crown fire burns (Shv-idenko, 2001). Over North America, very warm temper-atures were observed, and fires burned 47 000 km2 (John-ston, 1999). These episodes, although mostly concentrated in the regions highlighted in this cluster, affected the whole boreal ecosystem (forest, steppe and peatland). The total burned area has been estimated at 179 000 km2 (Kasischke and Bruhwiler, 2002).
In eastern Brazil, mature El Ni˜no climatic conditions are partially to blame for enhanced fire activity in Mato Grosso and southern Par´a (Alencar et al., 2006). Fires were origi-nally set by farmers and loggers for clearing land, and easily spread through the very dry vegetation.
1920 Y. Le Page et al.: Fire activity variability over the last decade -0.5 0 0.5 -0.5 0 0.5 -1 0 1 2 -2 -1 0 1 CL2 -0.5 0 0.5 -1 0 1 2 -2 -1 0 1 CL3 -1 0 1 2 Anomalies CL1 -2 -1 0 1 Fire season Time series -1.5 -0.5 0.5 1.5 -1 0 1 2 -2 -1 0 1 CL5 -0.5 0 0.5 -1 0 1 2 -2 -1 0 1 CL6 -0.5 0 0.5 -1 0 1 2 -2 -1 0 1 CL4 CL5
J F M A M J J A S O N D 19971998199920002001 2002200320042005 2006
-0.5 0 0.5 -1 0 1 2 -2 -1 0 1 CL7
J F M A M J J A S O N D-0.5 0 0.5
1997199819992000200120022003 200420052006 -1 0 1 2 -2 -1 0 1 CL8
Fig. 9. (left) temporal profiles of fires (colored) and precipitation
anomalies (CMAP data) and (right) averaged fire season.
above average rainfall in 1997, resulting in accumulation of biomass (Anyamba et al., 2001). The reversed situation in 1998, with moderate to strong drought (Kijazi and Reason, 2005), facilitated the outbreak of large fire events.
Clusters 1 to 3 are all related to the El Ni˜no event, illus-trating its global scope. They are individualised by the dif-ferent timing of the fire outbreak, which results from a com-plex interlocking of several factors. First is the propagation of the ENSO induced changes in precipitation, starting in early-1997, mid-1997 and early-1998 respectively (Fig. 9). This time sequence is due to the latitudinal or longitudinal
1 2 3 4 5 6 7 8
0 20 40 60 80 100 Cluster
Cumulative proprortion (%)
N&MF BF W&S G&C
Fig. 10. Active fires incidence by landcover (UMD Landcover),
for each cluster. N&MF: Needleleaved and Mixed Forests ; BF: Broadleaved Forests ; W&S: Woodlands and Shrublands ; G&C: Grasslands and Croplands.
distance to the original ENSO location, involving complex atmospheric circulation patterns. In the case of the eastern Africa regions, affected by fires in mid-1998, the teleconnec-tion may have involved a coupling of ENSO with the Indian Ocean Dipole (Black, 2005). Second, the vegetation state and moisture level at the onset of a drought period is a deter-minant factor of the delay before fire-prone conditions are ac-tually achieved. Generally, fires are mainly observed during the normal climatologic fire season, but in the case of strong and prolonged droughts, fires may occur at unusual time of the year (south-east Africa in cluster 2), and in rarely af-fected ecosystems (tropical forests). The sensitivity of those regions to El Ni˜no was tested by repeating the same analy-ses over 1999–2006 only, thus removing the extreme event of 1997–1998. The results (not shown), indicate that cluster 1 is merged with cluster 4 (see below), which also showed positive anomalies during the 2002 El Ni˜no. This suggests a recurrent impact of ENSO on fires in Indonesia and South America, as was also indicated by EOF1 (Fig. 5). Clusters 2 and 3 do not show this sensitivity to weaker El Ni˜no events.
Cluster 4, driven by EOFs 2, 3, 5 and 6 (Fig. 7), is dom-inated by a strip covering central Asia, south Australia and western Argentina (Fig. 8). The temporal pattern shows a clear spike in fire activity in the second half of 2002. Dur-ing this episode, Russia was hit by a widespread heat wave, unprecedented in the previous 30 years (NCDC 2002 Annual Review, 2003), which favoured the occurrence of late sea-son major fire outbreaks, affecting an estimated 120 000 km2 (Giglio et al., 2006). In Australia, Victoria and the Capital Territory experienced intense fire activity, during one of the driest years on record (NCDC 2002 Annual Review, 2003).
by the positive rainfall anomaly during the previous year, as suggested by the precipitation profile. Enhanced fire activity was reported in Africa at this time, particularly in Ethiopia, where large fires led to a multi-national fire fighting cam-paign through February to the outcome of heavy rainfall in late March (Goldammer and Habte, 2000). This episode was unusual, since mostly forest was burned, in a cluster where woodlands, shrublands and agricultural fires are highly pre-dominant. The fire-density is estimated at 1.6, but this is very likely to be an underestimation, as the ATSR WFA has a rel-atively low detection rate in agricultural fires, which mainly burn at daytime.
Cluster 6 involves diverse, globally scattered regions, in-cluding northern Australia, south-east Asia and the United States (Fig. 8). The time series associated indicates a broad positive anomaly spreading from 1999 to 2001. In the US, 2000 was the second worst fire year since 1960, with more than 30 000 km2 burned (Wildland Fire Statistics, 2007). Central Australia was affected by large bushfires, and the state of Queensland was hit by one of its worst fire seasons in memory (Bureau of Meteorology, Annual Report 2001– 2002, 2002). The large standard deviation indicates that the timing of the patterns is variable from one region to another. Cluster 7 is characterised by a sharp event in the 2005 bo-real summer, featured by EOFs 6, 7 and 8 (Fig. 7), affect-ing Alaska, Peru and the western Brazilian Amazon, mainly (Fig. 8). In Alaska, around 45 000 km2, mostly boreal for-est, burned, severely affecting an ecosystem recovering from the previous fire season, which had been the worst of the last 50 years. The 2004 fires do not appear in our analysis since they were not contemporaneous with other regional fire events and thus did not represent sufficient global variability to be retained.
South America was hit by a severe drought, especially along the Brazilian/Peru border region, where it was the most severe of the previous 60 years. Fires especially affected the eastern Brazilian states of Acre and Rondonia (Arag˜ao et al., 2007), which are both included in this cluster.
Cluster 8 includes mainly boreal regions, and, as sug-gested by the centroid coordinates, does not highlight any significant event. It includes scattered regions, and has the lowest fire density of all clusters.
The main driver of the cluster distribution is, by construc-tion, the variability that was represented by the set of nine selected EOFs. But most of the clusters also exhibit a strong coherence in terms of fire seasonality, suggesting that in most parts of the world the parameters driving fire season have a sufficient strength to contain fires within a certain annual ex-tent. The only exception concerns regions where the usual climatic drivers normally show little intra-annual variability, namely equatorial regions.
6 Conclusions
Analysis of major space-time patterns of global fire incidence over an entire decade using a screened version of the WFA, reveals important spatial and temporal structuring and a clear major role played by ENSO. The ten years of fire data can be arranged into a small number of clusters, which are in-terpretable in both ecological and climatic terms, and corre-spond to regional anomalies described in the literature. The results are valuable to identify the regions mostly affected by each event, and to support ecological studies and atmospheric impact assessments.
The outstanding El Ni˜no event of 1997–1998, controlling the three leading EOFs, is shown to have had global and long term footprints on fire activity, in critical regions, especially tropical forests. This high sensitivity of global fire activity to a global climate phenomenon suggests its mechanisms and implications have to be better understood for both near-future and climate change forecast purposes. Tropical forests have a fundamental role, in many ways. They host the highest biodiversity in the world, and current deforestation rates and enhanced fire activity are exposing those ecosystems to fur-ther and more rapid degradation by positive feedbacks mech-anisms, as described by Nepstad et al. (1999), Laurance et al., (2001) and Cochrane and Schulze (1999). Forecasts of 21st century tropical timber trade stress the urgency of addressing this issue (Soares-Filho et al., 2006).
Boreal regions have also experienced very destructive fires over the study period, both in Eurasia and North America, some under El Ni˜no conditions (Cluster 3), and others during regional precipitation and temperature anomalies (Clusters 4 and 7). Evidence of an ENSO influence, and of the impact of extreme conditions potentially due to climate change on fire incidence in the Siberian Far East is particularly worrying. This region, which contains important biodiversity resources, is under serious threat (Mollicone et al., 2006), since the ca-pacity for fire fighting and for preventing illegal logging have declined in recent years.
1922 Y. Le Page et al.: Fire activity variability over the last decade
Acknowledgement. This study is funded by the Marie Curie
Research Training Network GREENCYCLES, contract number MRTN-CT-2004-512464 (www.greencycles.org).
Edited by: I. Aben
References
Abram, N. J., Gagan, M. K., McCulloch, M. T., Chappell, J., and Hantoro, W. S.: Coral reef death during the 1997 Indian Ocean dipole linked to Indonesian wildfires, Science, 301, 952–955, 2003.
Akaakara, S.: Special Report on Forest Fire. International For-est Fire News, 26, 100–105, available at: http://www.fire. uni-freiburg.de/iffn/iffn 26/IFFN 26.pdf, 2002.
Alencar, A., Nepstad, D., and Diaz, M. D. V.: Forest understory fire in the Brazilian Amazon in ENSO and non-ENSO years: Area burned and committed carbon emissions, Earth Interactions, 10, 17, 2006.
Allan, R. J., Lindesay, J., and Parker, D. E.: El Nino – Southern Oscillation & Climatic Variability. CSIRO Publishing, 1996. Anyamba, A., Tucker, C. J., and Eastman, J. R.: NDVI anomaly
patterns over Africa during the 1997/1998 ENSO warm event, Int. J. Remote Sens., 22, 1847–1859, 2001.
Arag˜ao, L., Malhi, Y., Roman-Cuesta, R. M., Saatchi, S., Anderson, L. O., and Shimabukuro, Y. E.: Spatial patterns and fire response of recent Amazonian droughts, Geophys. Res. Lett, 34, 5, 2007. Arino, O., and Plummer, S.: The Along Track Scanning Radiometer World Fire Altas – Detection of night-time fire activity. IGBP-DIS Working paper #23, Potsdam, Germany, 2001.
Arino, O., Plummer, S., and Defrenne, D.: Fire disturbance: the ten years time series of the ATSR world fire atlas. H. Lacoste, Proceedings of the MERIS (A)ATSR Workshop 2005 (ESA SP-597), 2005.
Arkhipov, V., Moukanov, B. M., Khaidarov, K., and Goldammer, J. G.: Overview on Forest Fires in Kazakhstan. International Forest Fire News, 22, 40-48, available at: http://www.fire.uni-freiburg. de/iffn/country/kz/kz 1.htm, 2000.
Balzter H., Gerard F. F., George C. T., Rowland C. S., Jupp T. E., McCallum I., Shvidenko A., Nilsson S., Sukhinin A., Onuchin A., and Schmullius C.: Impact of the Arctic Oscillation pattern on interannual forest fire variability in Central Siberia, Geophys. Res. Lett., vol. 32, L14709, doi:10.1029/2005GL022526, 2005. Barbosa, R. I.: Forest Fires in Roraima, Brazilian Amazonia.
Inter-national Forest Fire News, 28, 51-56, available at: http://www. fire.uni-freiburg.de/iffn/iffn 28/Brazil-2.pdf, 2003.
Beckage, B., Platt, W. J., Slocum, M. G., and Pank, B.: Influence of the El Nino Southern Oscillation on fire regimes in the Florida everglades, Ecology, 84, 3124–3130, 2003.
Black, E.: The relationship between Indian Ocean sea-surface tem-perature and east African rainfall, Philos. T. R. Soc. A, 363, 43-47, 2005.
Bond, W. J., Woodward, F. I., and Midgley, G. F.: The global distri-bution of ecosystems in a world without fire, New Phytol., 165, 525–537, 2005.
Bureau of Meteorology, Annual report 2001–2002: http://www.bom.gov.au/inside/eiab/reports/ar01-02/PDF/
Annual Report 2001-02.pdf, last access: 14 September 2007, 2002.
Cairns, M. A., Hao, W. M., Alvarado, E., and Haggerty, P. C.: Car-bon Emissions from Spring 1998 Fires in Tropical Mexico, In: Proceedings from The Joint Fire Science Conference and Work-shop ”Crossing the Millennium: Integrating Spatial Technolo-gies and Ecological Principles for a New Age in Fire Manage-ment”. Moscow, University of Idaho, U.S.A., 15–17 June 1999, Volume 1, 242–248, 2000.
Carmona-Moreno, C., Belward, A., Malingreau, J. P., Hartley, A., Garcia-Alegre, M., Antonovskiy, M., Buchshtaber, V., and Pivo-varov, V.: Characterizing interannual variations in global fire cal-endar using data from Earth observing satellites, Glob. Change Biol., 11, 1537–1555, 2005.
Cochrane, M. A., Alencar, A., Schulze, M. D., Souza, C. M., Nep-stad, D. C., Lefebvre, P., and Davidson, E. A.: Positive feedbacks in the fire dynamic of closed canopy tropical forests, Science, 284, 1832–1835, 1999.
Cochrane, M. A. and Schulze, M. D.: Fire as a recurrent event in tropical forests of the eastern Amazon: Effects on forest struc-ture, biomass, and species composition, Biotropica, 31, 2–16, 1999.
Craddock, J. M. and Flood, C. R.: Eigenvectors for rep-resenting the 500 mb geopotential surface over the North-ern Hemisphere. Q. J. Roy. Meteor. Soc., 96(407), 124–129, doi:10.1002/qj.49709640711, 1969.
Damoah R., Spichtinger N., Forster C., James P., Mattis I., Wandinger U., Beirle S., Wagner T., and Stohl A.: Around the world in 17 days – hemispheric-scale transport of forest fire smoke from Russia in May 2003, Atmos. Chem. Phys., 4, 1311– 1321, 2004,
http://www.atmos-chem-phys.net/4/1311/2004/.
Diaz, H. F., Hoerling, M. P., and Eischeid, J. K.: ENSO variability, teleconnections and climate change, Int. J. Climatol., 21, 1845– 1862, 2001.
Doherty, R. M., Stevenson, D. S., Johnson, C. E., Collins, W. J., and Sanderson, M. G.: Tropospheric ozone and El Nino-Southern Oscillation: Influence of atmospheric dynamics, biomass burn-ing emissions, and future climate change, J. Geophys. Res-Atmos., 111, 21, 2006.
Dwyer, E., Pereira, J. M. C., Gregoire, J. M., and DaCamara, C. C.: Characterization of the spatio-temporal patterns of global fire activity using satellite imagery for the period April 1992 to March 1993, J. Biogeogr., 27, 57–69, 2000a.
Dwyer, E., Pinnock, S., Gregoire, J. M., and Pereira, J. M. C.: Global spatial and temporal distribution of vegetation fire as de-termined from satellite observations, Int. J. Remote Sens., 21, 1289–1302, 2000b.
Fuller, D. O., and Murphy, K.: The ENSO-fire dynamic in insular Southeast Asia, Clim. Change, 74, 435–455, 2006.
GCOS-107: Systematic Observation Requirements for Satellite-based Products for Climate - Supplemental details to the satellite-based component of the Implementation Plan for the Global Ob-serving System for Climate in Support of the UNFCCC, http: //www.wmo.int/pages/prog/gcos/Publications/gcos-107.pdf, last access: 14 September 2007, 2006.
Giglio, L., van der Werf, G. R., Randerson, J. T., Collatz, G. J., and Kasibhatla, P.: Global estimation of burned area using MODIS active fire observations, Atmos. Chem. Phys., 6, 957–974, 2006, http://www.atmos-chem-phys.net/6/957/2006/.
Glantz, M. H.: Currents of Change: Impacts of El Ni˜no and La Ni˜na on Climate and Society. Cambridge University Press, Cam-bridge, UK, 2001.
Goldammer, J. G. and Habte, T.: fire disasters: Early warning, mon-itoring, and response. UN International Search and Rescue Ad-visory Group (INSARAG) Regional Europe – Africa Meeting, Hammamet, Tunisia, 15–19 November 2000, 2000.
Govaerts, Y. M., Pereira, J. M., Pinty, B., and Mota, B.: Impact of fires on surface albedo dynamics over the African continent, J. Geophys. Res-Atmos., 107, 12, 2002.
Hanley, D. E., Bourassa, M. A., O’Brien, J. J., Smith, S. R., and Spade, E. R.: A quantitative evaluation of ENSO indices, J. Cli-mate, 16, 1249–1258, 2003.
Hess, J. C., Scott, C. A., Hufford, G. L., and Fleming, M. D.: El Nino and its impact on fire weather conditions in Alaska, Int. J. Wildland Fire, 10, 1–13, 2001.
Holmgren, M., Stapp, P., Dickman, C. R., Gracia, C., Grahams, S., Gutierrez, J. R., Hice, C., Jaksic, F., Kelt, D. A., Letnic, M., Lima, M., Lopez, B. C., Meserve, P. L., Milstead, W. B., Polis, G. A., Previtali, M. A., Michael, R., Sabate, S., and Squeo, F. A.: Extreme climatic events shape arid and semiarid ecosystems, Front. Ecol. Environ., 4, 87–95, 2006.
Ito, A. and Penner, J. E.: Global estimates of biomass burning emis-sions based on satellite imagery for the year 2000, J. Geophy. Res-Atmos., 109, 18, 2004.
Johnston, T.: Canada Report 1998. International Forest Fire News, 20, 40–45, available at: http://www.fire.uni-freiburg.de/iffn/ country/ca/ca 6.htm, 1999.
Justice, C. O., Giglio, L., Korontzi, S., Owens, J., Morisette, J. T., Roy, D., Descloitres, J., Alleaume, S., Petitcolin, F., and Kauf-man, Y.: The MODIS fire products, Remote Sens. Environ., 83, 244–262, 2002.
Kasischke, E. S. and Bruhwiler, L. P.: Emissions of carbon dioxide, carbon monoxide, and methane from boreal forest fires in 1998, J. Geophy. Res-Atmos., 108, 16, 2002.
Kasischke, E. S., Hewson, J. H., Stocks, B., van der Werf, G., and Randerson, J.: The use of ATSR active fire counts for estimating relative patterns of biomass burning - a study from the boreal forest region, Geophys. Res. Lett., 30, 4, 2003.
Kaufman, Y. J. and Koren, I.: Smoke and pollution aerosol effect on cloud cover, Science, 313, 655–658, 2006.
Kijazi, A. L. and Reason, C. J. C.: Relationships between intrasea-sonal rainfall variability of coastal Tanzania and ENSO, Theor. Appl. Climatol., 82, 153–176, 2005.
Kitzberger, T., Swetnam, T. W., and Veblen, T. T.: Inter-hemispheric synchrony of forest fires and the El Nino-Southern Oscillation, Global Ecol. Biogeogr., 10, 315–326, 2001. Kitzberger T., Brown P. M., Heyerdahl E. K., Swetnam T. W., and
Veblen T. T.: Contingent Pacific–Atlantic Ocean influence on multicentury wildfire synchrony over western North America. Proceedings of the National Academy of Sciences, 104(2), 543– 548, 2007.
Laurance, W. F., and Williamson, G. B.: Positive feedbacks among forest fragmentation, drought, and climate change in the Ama-zon, Conserv. Biol., 15, 1529–1535, 2001.
Lindesay, J. A.: Fire and climate in Australia, in Australia Burning: Fire Ecology, Policy and Management Issues, edited by: Cary G., Lindenmayer D., Dovers S., CSIRO Publishing, Melbourne, Australia, 2003.
Loboda, T. V.: Estimating Potential Fire Danger within the Siberian Tiger Habitat. Department of Geography, University of Maryland, College Park, Maryland, USA, available at: http://www.savethetigerfund.org/AM/Template.cfm?Section= Papers and Theses\&TEMPLATE=/CM/ContentDisplay.cfm\
&CONTENTID=1719, 2004.
Lyon, B. and Barnston, A. G.: ENSO and the spatial extent of inter-annual precipitation extremes in tropical land areas, J. Climate, 18, 5095–5109, 2005.
Milligan, G. W.: An examination of the effect of six types of er-ror perturbation on fifteen clustering algorithms. Psychometrika, 1980.
Mollicone, D., Eva, H. D., and Achard, F.: Ecology – Human role in Russian wild fires, Nature, 440, 436–437, 2006.
Mota, B. W., Pereira, J. M. C., Oom, D., Vasconcelos, M. J. P., and Schultz, M.: Screening the ESA ATSR-2 World Fire Atlas (1997–2002), Atmos. Chem. Phys., 6, 1409–1424, 2006, http://www.atmos-chem-phys.net/6/1409/2006/.
Murdiyarso, D., and Adiningsih, E. S.: Climate anomalies, Indone-sian vegetation fires and terrestrial carbon emissions, Mitiga-tion and AdaptaMitiga-tion Strategies for Global Change, 12, 101–112, 2007.
NCDC, Climate of 1998 Annual Review: http://lwf.ncdc. noaa.gov/oa/climate/research/1998/ann/ann98.html, LAST ac-cess: 14 September 2007, 1999.
NCDC, Climate of 2002 Annual Review: http://lwf.ncdc.noaa.gov/ oa/climate/research/2002/ann/ann02.html, access: 14 Septem-ber 2007, 2003.
Nepstad, D. C., Verissimo, A., Alencar, A., Nobre, C., Lima, E., Lefebvre, P., Schlesinger, P., Potter, C., Moutinho, P., Mendoza, E., Cochrane, M., and Brooks, V.: Large-scale impoverishment of Amazonian forests by logging and fire, Nature, 398, 505–508, 1999.
Page, S. E., Siegert, F., Rieley, J. O., Boehm, H. D. V., Jaya, A., and Limin, S.: The amount of carbon released from peat and forest fires in Indonesia during 1997, Nature, 420, 61–65, 2002. Patra P. K., Ishizawa M., Maksyutov S., Nakazawa T., and Inoue
G.: Role of biomass burning and climate anomalies for land-atmosphere carbon fluxes based on inverse modeling of atmo-spheric CO2, Global Biogeochem. Cy., 19(3), 1–10, 2005. Ria˜no, D., Ruiz, J. A. M., Isidoro, D., and Ustin, S. L.: Global
spatial patterns and temporal trends of burned area between 1981 and 2000 using NOAA-NASA Pathfinder, Glob. Change Biol., 13, 40–50, 2007.
Roman-Cuesta, R. M., Gracia, M., and Retana, J.: Environmental and human factors influencing fire trends in enso and non-enso years in tropical Mexico, Ecol. Appl., 13, 1177–1192, 2003. Schafer, J. S., Holben, B. N., Eck, T. F., Yamasoe, M. A., and
Artaxo, P.: Atmospheric effects on insolation in the Brazilian Amazon: Observed modification of solar radiation by clouds and smoke and derived single scattering albedo of fire aerosols, J. Geophys. Res-Atmos., 107, 15, 2002.
Schimel, D. and Baker, D.: Carbon cycle: The wildfire factor, Na-ture, 420, 29–30, 2002.
1924 Y. Le Page et al.: Fire activity variability over the last decade
and Cook, E. R.: ENSO and PDO variability affect drought-induced fire occurrence in Rocky Mountain subalpine forests, Ecol. Appl., 15, 2000–2014, 2005.
Shvidenko, A.: Fire Situation in Russia. International Forest Fire News, 24, 41–59, available at: http://www.fire.uni-freiburg.de/ iffn/country/rus/rus 26.htm, 2001.
Siegert, F., and Hoffmann, A. A.: The 1998 forest fires in East Kali-mantan (Indonesia): A quantitative evaluation using high reso-lution, multitemporal ERS-2 SAR images and NOAA-AVHRR hotspot data, Remote Sens. Environ., 72, 64–77, 2000.
Siegert, F., Ruecker, G., Hinrichs, A., and Hoffmann, A. A.: In-creased damage from fires in logged forests during droughts caused by El Nino, Nature, 414, 437–440, 2001.
Simard, A. J., Haines, D. A., and Main, W. A.: Relations between El Ni˜no Southern Oscillation anomalies and wildland fire activity in the United-States, Agr. Forest Meteorol., 36, 93–104, 1985. Soares-Filho, B. S., Nepstad, D. C., Curran, L. M., Cerqueira, G. C.,
Garcia, R. A., Ramos, C. A., Voll, E., McDonald, A., Lefebvre, P., and Schlesinger, P.: Modelling conservation in the Amazon basin, Nature, 440, 520–523, doi:10.1038/nature04389, 2006. Swetnam, T. W. and Betancourt, J. L.: Fire – Southern Oscillation
relations in the southwestern United-States, Science, 249, 1017– 1020, 1990.
Tansey, K., Gregoire, J. M., Binaghi, E., Boschetti, L., Brivio, P. A., Ershov, D., Flasse, S., Fraser, R., Graetz, D., Maggi, M., Peduzzi, P., Pereira, J., Silva, J., Sousa, A., and Stroppiana, D.: A global inventory of burned areas at 1km resolution for the year 2000 derived from SPOT VEGETATION data, Clim. Change, 67, 345–377, 2004a.
Tansey, K., Gregoire, J. M., Stroppiana, D., Sousa, A., Silva, J., Pereira, J. M. C., Boschetti, L., Maggi, M., Brivio, P. A., Fraser, R., Flasse, S., Ershov, D., Binaghi, E., Graetz, D., and Peduzzi, P.: Vegetation burning in the year 2000: Global burned area esti-mates from SPOT VEGETATION data, J. Geophys. Res-Atmos., 109, 22, 2004b.
The Nature Conservancy, Living with Fire - Sustaining Ecosystems & Livelihoods Through Integrated Fire Management, by My-ers, R. L. available at: http://www.nature.org/initiatives/fire/files/ integrated fire management myers 2006.pdf, 2006.
Trenberth, K. E.: Short-term climate variations: Recent accom-plishments and issues for future progress, B. Am. Meteorol. Soc., 78, 1081–1096, 1997.
van der Werf, G. R., Randerson, J. T., Giglio, L., Collatz, G. J., Kasibhatla, P. S., and Arellano, A. F.: Interannual variability in global biomass burning emissions from 1997 to 2004, Atmos. Chem. Phys., 6, 3423–3441, 2006,
http://www.atmos-chem-phys.net/6/3423/2006/.
Veblen, T. T., Kitzberger, T., and Donnegan, J.: Climatic and hu-man influences on fire regimes in ponderosa pine forests in the Colorado Front Range, Ecol. Appl., 10, 1178–1195, 2000. Verdon, D. C., Kiem, A. S., and Franks, S. W.: Multi-decadal
vari-ability of forest fire risk – eastern Australia, Int. J. Wildland Fire, 13, 165–171, 2004.
von Storch, H., and Zwiers, F. W.: Statistical Analysis in Climate Research. Cambridge University Press, Cambridge, UK, 2002. Ward, J. H.: Hierarchical Grouping to Optimize an Objective
Func-tion. J. Am. Stat. Assoc., 58, 236–244, 1963.
Wildland Fire Statistics: http://www.nifc.gov/fire info/fires acres. htm, last access: 14 September 2007.
Wilks, D. S.: Statistical Methods in the Atmospheric Sciences. Aca-demic Press, Burlington, Maryland, USA, 2005.