Taxonomia, biogeografia e conservação dos anfíbios
da Serra do Espinhaço
Tese apresentada ao Instituto de Ciências
Biológicas, para a obtenção de Título de
Doutor em Ecologia Conservação e
Manejo da Vida Silvestre pela
Universidade Federal de Minas Gerais
Orientador: Paulo C. A. Garcia
Belo Horizonte
Universidade Federal de Minas Gerais
Taxonomia, biogeografia e conservação dos anfíbios da Serra do
Espinhaço
Taxonomy, biogeography and conservation of anurans in the
Espinhaço Range, Brazil
Banca examinadora:
Prof. Dr. Renato N. Feio
UFV Prof. Dr. Marcelo F. Vasconcelos PUC-Minas
Prof. Dr. Bruno V. S. Pimenta
Bicho do Mato Consultoria Ambiental
Prof. Dr. Leonardo E. Lopes UFV
À minha família, Emanuel, Raquel, Júlia e Laura, que foram fundamentais na minha formação profissional e pessoal. Obrigada pelo apoio incondicional, pelo carinho e amor. À Ciça pelo amor, compreensão e companhia fundamentais para que todo este período fosse ainda mais agradável. Vocês fazem de mim uma pessoa muito mais feliz.
Ao meu orientador Paulo Garcia por ter ingressado na UFMG possibilitando que eu fizesse o doutorado em Belo Horizonte e por acreditar no meu trabalho. À banca examinadora por ter aceitado o convite. Aos curadores e funcionários dos museus que visitei. Meus sinceros agradecimentos ao Bira por ter aceitado colaborar com este trabalho. Sua contribuição foi inestimável!
Aos colegas de laboratório pela agradável convivência e momentos de diversão. Agradeço ao todos que me ajudaram nas expedições de campo: Tiago Pezzuti, Michael Lindemann, Raphael Mourão, Camila Rievers, Julia Thompson, Paulo Pinheiro, Pedro Taucce, Leandro Drummond, Bruno Felhberg, Barbara Zaidan, Felipe Fernandes, Bruna Imai, Fernando Leal, Hans Andrade e Pedro Bigode. À Julia Thompson por ter tombado todos (e não foram poucos) os animais coletados.
Sinceros agradecimentos aos biólogos Pedro L. Viana, Pablo Hendrigo, Tiago Pezzuti, Leonardo Lopes, Alexandre Mendes, Bernardo Ranieri, Marcelo Vasconcelos, Frederico Neves e Fernando Goulart. A longa convivência com vocês teve um grande impacto na minha formação como naturalista.
Introdução Geral 01
Capítulo 1. Anuran diversity and conservation deficits for the greatest Brazilian mountain range: a gap analysis based on species distribution models. 11
Abstract 12
Introduction 13
Methods 17
Results 25
Discussion 36
References 43
Appendix 57
Capítulo 2. Anuran distribution patterns in the Brazilian highlands: implications for the delimitation of Espinhaço range areas of endemism and understanding of their evolutionary dynamic. 60
Abstract 61
Introduction 63
Methods 68
Results 72
Discussion 84
References 92
Capítulo 3. A new species of Bokermannohyla from the Espinhaço range, state of Minas Gerais, southeastern Brazil. 100
Introdução Geral
Os anfíbios modernos são possivelmente o grupo existente de vertebrados
terrestre mais antigo, existindo desde o Médio Permiano (± 305 - 290 m.a.; Alford et al.,
2007; Marjanovic & Laurin, 2007; Pyron and Wiens, 2011). Apesar disso, apenas
recentemente se atentou para sua grande diversidade de espécies, sendo este o grupo de
vertebrados terrestres que teve o maior número de espécies descritas nas últimas
décadas (Köhler et al., 2005). Atualmente são conhecidas cerca de 6890 espécies
(AmphibiaWeb, 2012), sendo que a melhor estimativa para o número total de espécies é
de 8000–12000 (Parra, 2005). O grupo possui um importante papel na dinâmica dos nutrientes, promovendo o fluxo de energia entre os sistemas terrestres e aquáticos
(Alford et al., 2007).
Anfíbios também constituem o grupo de vertebrados terrestre mais ameaçado do
mundo: pelo menos 37% estão classificados como vulneráveis, em perigo ou
criticamente ameaçados (IUCN, 2012). Esta situação é certamente otimista visto que
25% possuem status de conservação desconhecido (IUCN, 2012). Declínios
populacionais detectados em todo o mundo têm gerado uma crescente preocupação em
relação à conservação desse grupo (Stuart et al. 2004, Hoffmann et al. 2010). As causas
desses declínios são assunto de pesquisa contínua, mas provavelmente incluem
modificações no uso do solo, mudanças climáticas e a proliferação da doença
quitridiomicose causada por um fungo patogênico (Stuart et al., 2004; Blaustein &
Kiesecker, 2002; Beebee & Griffiths, 2005). Infelizmente, o panorama futuro tende a
ser muito pior em 2080 (Hof et al., 2011), visto que as áreas que abrigam as faunas mais
ricas de anfíbios serão desproporcionalmente mais afetadas por um ou múltiplos fatores
de ameaça (doenças e mudanças climáticas ou no uso do solo) do que áreas de baixa
de planos para proteger sua diversidade. Para tal, a necessidade de dados de taxonomia e
distribuição geográfica de alta qualidade, dos quais derivam estudos científicos
confiáveis, é bastante obvia.
O Brasil abriga a maior riqueza de anfíbios do mundo (IUCN, 2012). Atualmente,
946 espécies são conhecidas para o país (Segalla et al., 2012). Contudo, para manejar
tamanha diversidade, frente às crescentes ameaças, precisamos saber quais são as
unidades taxonômicas básicas que a compõe, onde ela está, como se encontra
organizada em diferentes escalas, como as suas diferentes facetas covariam no espaço e
no tempo e como respondem a um conjunto desconcertante de variáveis que atuam e
interagem, mediando a diversidade e a distribuição das espécies por meio de inúmeros
mecanismos e processos. Entretanto, o conhecimento acerca da biodiversidade
permanece inadequado, visto que a maioria das espécies do planeta ainda não foi
formalmente descrita (‗the Linnean shortfall‘) e a distribuição geográfica da maioria das espécies é superficialmente conhecida (‗the Wallacean shortfall‘, Whittaker et al.,
2005). Essa carência de informação é especialmente grave em regiões tropicais (Kress
et al., 1998; Bini et al., 2006), principalmente em regiões montanhosas onde muitos
gêneros e espécies de vertebrados ainda estão sendo descritas ano após ano (e.g.
Rodrigues et al., 2009; Percequillo et al., 2011) e os registros individuais são
consideravelmente espaçados e/ou enviesados espacialmente devido a seu isolamento e
difícil acesso.
A maior cadeia de montanhas da América do Sul fora os Andes, a Serra do
Espinhaço, não é exceção à regra e é caracterizada, ao mesmo tempo, por uma biota
única e extremamente rica (Giulietti et al., 1997) e por enormes lacunas do
conhecimento no que se refere a diversos taxa (Versieux & Wendt, 2007; Echternacht,
de biodiversidade (i.e. a Mata Atlantica e o Cerrado) e ainda inserida em um bioma
semi-arido (i.e. Caatinga), o Espinhaço estende-se latitudinalmente por cerca de 1000
km, cortando os estados de Minas Gerais e Bahia. A complexidade de suas relações
(ecológicas e históricas) com os demaias domínios morfoclimáticos brasileiros, aliada a
sua grande heterogeneidade ambiental, propiciou condições diversas para o
estabelecimento de uma grande variedade de fitofisionomias (e.g. campos rupestres,
matas de galeria, matas nebulares, cerrados, veredas). O conjunto dessas caracteristicas
faz com que a região seja consistentemente apontada como área prioritária para a
conservação do Brasil (MMA, 1999, 2000a, 2000b, 2003) e do estado de Minas Gerais
(Drummond et al., 2005). Devido ao seu relevo acidentado, as terras altas do Espinhaço
permaneceram menos alteradas do que os vales de baixada e encostas a elas adjacentes,
oferecendo uma única possibilidade de se conservar parte do que ainda resta da
biodiversidade original desses três ameaçados domínios fitogeográficos brasileiros.
Apesar disso, o elevado número de espécies ameaçadas de distribuição restrita (MMA,
2008; IUCN, 2012) e as crescentes taxas de descaracterização de habitats causadas pela
ação antrópica (Safford, 1999; Jacobi et al., 2007; Versieux & Wendt, 2007; Barbosa et
al., 2010) salientam a necessidade urgente de ações de conservação. Apesar de sua
relevância para a conservação da biodiversidade brasileira, uma pequena parcela da área
da Serra do Espinhaço encontra-se protegida em reservas (Silva et al., 2008).
Ao mesmo tempo em que o difícil acesso permitiu que algumas áreas do
Espinhaço se mantivessem preservadas, ele também dificultou que grandes coletas de
anfíbios (e outros táxons) fossem feitas na região. Ressalvas devem ser feitas aquelas
realizadas por Werner Bokermann e Ivan Sazima durante as décadas de 1960 e 1970,
quando a maior parte das espécies endêmicas da porção sul do Espinhaço foram
Espinhaço só podem ser acessadas a pé e, portanto, permaneceram inexploradas por
muito tempo. Como exemplo da nossa ignorância, das 47 espécies de anfíbios
identificadas nesse estudo como endêmicas, 13 ainda não foram descritas, apesar de
serem facilmente diagnosticáveis. Apesar da proximidade da sua porção meridional
(Quadrilátero Ferrífero e Serra do Cipó) com a metrópole de Belo Horizonte, que
concentra a maior parte dos taxonomistas do estado de Minas Gerais, muitas espécies da
região são ainda frequentemente identificadas de maneira errônea, o que pôde ser
claramente observado nos acervos das coleções visitadas durante o presente estudo.
Além de terem distribuição geográfica restrita, algumas vezes conhecida de uma ou
poucas localidades, muitas espécies possuem hábitos crípticos e reprodução explosiva,
fatores que dificultam ainda mais seu encontro e coleta. Ainda, o pequeno número de
taxonomistas em relação ao número de espécies a ser estudada e a falta de apoio
institucional e de órgãos de fomento a este tipo de pesquisa básica, muitas vezes taxada
de pouco relevante, fortalece ainda mais o desconhecimento sobre esse peculiar grupo
de vertebrado. Contudo, tal panorama vem mudando, sendo que oito espécies
endêmicas do Espinhaço foram descritas nos últimos cinco anos (Cassimiro et al., 2008;
Caramaschi et al., 2009; Lourenço et al., 2009; Cassini et al., 2010, Maciel & Nunes,
2010; Leite et al., 2011; Napoli et al., 2011; Leite et al., 2012), a maioria delas fruto do
trabalho de novos taxonomistas. Entretanto, como observado por Leite et al. (2012),
muitas espécies ainda aguardam descrições formais (e.g. Carvalho et al., in prep.; Barata
et al., in prep.).
Taxonomia e conservação de espécies são frequentemente assumidas como
atividades interdependentes. Contudo, a taxonomia está subjacente e intrinsicamente
ligada à preservação da diversidade biológica. Não podemos almejar a conservação de
consequências das modificações e degradação ambientais estarão fatalmente
comprometidas caso não formos capazes de reconhecer e descrever os integrantes dos
sistemas naturais. Portanto, tanto a carência de conhecimento e habilidade taxonômica,
quanto confusões sobre onde o ‗limite‘ de uma espécie deve ser definido, causam problemas para os conservacionistas. Contudo, taxonomia e conservação
definitivamente não são a mesma coisa. Descrever espécies e suas relações não é
garantia de sua conservação. Lista de espécies completas ou revisões taxonômicas por si
só são ineficientes do ponto de vista da conservação. Entretanto, seria impossível
desenvolver estratégias e mecanismos necessários para a conservação de espécies na
ausência do conhecimento adequado sobre a distribuição e a taxonomia das mesmas.
Como herpetólogo e conservacionista, acredito que diminuir a distância entre
taxonomistas e conservacionistas é um ponto crítico, e cada um de nós deveria se sentir
insentivado a tomar parte desta tarefa, tornando-se pessoalmente mais proficiente em
taxonomia e história natural de maneira a encurtar este hiato.
Esta tese está dividida em quatro capítulos, escritos em inglês, na forma de artigos
para publicação em revistas internacionais. Todas as questões abordadas estão
intimamente ligadas à disciplina da biogeografia da conservação, que foi formalmente
definida por Whittaker et al. (2005), como a ―aplicação dos princípios, teorias e análises biogeográficas aos problemas relativos à conservação da biodiversidade‖. O primeiro capítulo traz uma descrição detalhada do sistema de estudo, apresentando uma lista de
espécies atualizada à luz de uma detalhada revisão de museu e de um grande esforço de
campo. Beneficiando de modelos de distribuição de espécies, descrevo nele os padrões
espaciais de riqueza de espécies e endemismo, considerando toda a extensão do
Espinhaço, de maneira a possibilitar uma avaliação da eficiência do atual sistema de
encontra-se em fase final de preparação e será submetido ao periódico Conservation
Biology. No segundo capítulo identifico as áreas de endemismo de anuros da cadeia,
exploro as suas relações e avalio a influência do clima atual e pretérito, desde o último
máximo glacial, na configuração e distribuição dessas áreas. Pretende-se submeter este
capítulo ao periódico Journal of Biogeography. No terceiro e quarto capítulos apresento
as descrições, recentemente publicadas no periódico Herpetologica, de duas espécies
novas de distribuição muito pequena e restrita a duas áreas de endemismo identificadas
no segundo capítulo, uma em Minas Gerais e outra na Bahia. As espécies pertencem ao
gênero Bokermannohyla e foram coletadas em áreas pouco exploradas da Serra do
Espinhaço durante a realização das expedições de campo para este estudo.
Referências
Alford, R. A., Richards, S. J., and McDonald, K. R. 2007. Biodiversity of Amphibians. Pages 1–12 in Levin, S. A., editor. Encyclopedia of Biodiversity, 2ª edition. Academic Press.
AmphibiaWeb. 2012. Information on amphibian biology and conservation. 2012. Berkeley, California: AmphibiaWeb. Available from http://amphibiaweb.org/ (accessed October 2012).
Barata, I. M., Santos, M. T. T., Leite, F. S. F. L., and Garcia, P. C. A. (in prep.). A new species of Crossodactylodes (Anura: Cycloramphidae) from Minas Gerais, Brazil: first
record of genus within Espinhaço Range.
Barbosa, N. P. U., Fernandes, G. W., Carneiro, M. A. A., and Júnior, L. A. C. 2010. Distribution of non–native invasive species and soil properties in proximity to paved roads and unpaved roads in a quartzitic mountainous grassland of south–eastern Brazil (rupestrian fields). Biological Invasions 12: 3745–3755.
Bini, L. M., Diniz–Filho, J. A. F., Rangel, T. F. L. V. B., Bastos, R. P., and Pinto, M. P. 2006. Challenging Wallacean and Linnean shortfalls: knowledge gradients and conservation planning in a biodiversity hotspot. Diversity and Distributions 12: 475– 482.
Blaustein, A. R., and Kiesecker, J. M. 2002. Complexity in conservation: lessons from the global decline of amphibian populations. Ecology Letters 5: 597–608.
Caramaschi, U., Cruz, C. A. G., Barreto, L. B. 2009. A new species of Hypsiboas of the H. polytaenius clade from southeastern Brazil (Anura:Hylidae). South American Journal
of Herpetology 4: 210–216.
Carvalho, T., Leite, F. S. F. and Pezzuti, T. L. (in prep.) A new species of the Leptodactylus fuscus group from the Espinhaço range, Bahia, Brazil.
Cassimiro, J., Verdade, V. K., and Rodrigues, M. T. 2008. A large and enigmatic new Eleutherodactyline frog (Anura, Strabomantidae) from Serra do Sincorá, Espinhaço Range, northeastern Brazil. Zootaxa 1761: 59 – 68.
Cassini, C., Cruz, C. A. G., and Caramaschi, U. 2010. Taxonomic review of Physalaemus olfersii (Lichtenstein & Martens, 1856) with revalidation of Physalaemus lateristriga (Steindachner, 1864) and description of two new related species (Anura:
Leiuperidae). Zootaxa 2491: 1–33.
Drummond, G. M., Martins, C. S., Machado, A. B. M., Sebaio, F. A., and Antonini, Y. 2005. Biodiversidade em Minas Gerais – um atlas para sua conservação. 2ª ed. Fundação Biodiversitas, Belo Horizonte, Brasil.
Echternacht, L.,Trovó, M., Oliveira, C. T., and Pirani, J. R. 2011. Areas of endemism in the Espinhaço Range in Minas Gerais, Brazil. Flora 206: 782–791.
Giulietti, A. M., Pirani, J. R. and Harley, R. M. 1997. Espinhaço range region. Pages 397–404 in Davis, S. D., Heywood, V. H., Herrera–MacBride, O., Villa–Lobos, J., Hamilton, A. C., editors. Centres of Plant Diversity, vol. 3. The Americas. WWF–
IUCN, Washington.
Hoffmann, M. et al. 2010. The impact of conservation on the status of the world‘s
Hof, C., Araújo, M. B., Jetz, W., and Rahbek, K. 2011. Additive threats from pathogens, climate and land–use change for global amphibian diversity. Nature 480: 516–519.
IUCN (International Union for Conservation of Nature). 2012. IUCN Red List of Threatened Species. Version 2012.1.
Jacobi, C. M., Carmo, F. F., Vincent, R. C., and Stehmann, J. R. 2007. Plant communities on ironstone outcrops: a diverse and endangered Brazilian ecosystem. Biodiversity and Conservation 16: 2185–2200.
Köhler, J., Vieites, D. R., Bonett, R. M., García, F. H., Glaw, F., Steinke, D., and Vences, M. 2005. New amphibians and global conservation: a boost in species discoveries in a highly endangered vertebrate group. BioScience 55: 693–696.
Kress, W. J., Heyer, W. R., Acevedo, P., Coddington, J., Cole, D., Erwin, T. L., Meggers, B. J., Pogue, M., Thorington, R.W., Vari, R. P., Weitzman, M. J. and Weitzman, S. H. 1998. Amazonian biodiversity: assessing conservation priorities with taxonomic data. Biodiversity and Conservation 7: 1577–1587.
Leite, F. S. F., Juncá, F. A., and Eterovick, P. C. 2008. Status do conhecimento, endemismo e conservação de anfíbios anuros da Cadeia do Espinhaço, Brasil. Megadiversidade 4: 158–176.
Leite, F. S. F., Pezzuti, T. L., and Drummond, L. O. 2011. A new species of
Bokermannohyla from the Espinhaço range, state of Minas Gerais, Southeastern Brazil.
Herpetologica 67:440–448.
Leite, F. S. F., Pezzuti, T. L., and Garcia, P. C. A. 2012. A new species of the
Bokermannohylapseudopseudis group from the Espinhaço range, central Bahia, Brazil
(Anura: Hylidae). Herpetologica 68: 401–409.
Lourenço, A. C. C., Nascimento, L. B. N., and Silvério–Pires, M. R. 2009. New Species of the Scinax catharinae species group (Anura: Hylidae) from Minas Gerais,
Maciel, D. B., and Nunes, I. 2010. A new species of four–eyed frog genus Pleurodema
Tschudi, 1838 (Anura: Leiuperidae) from the rock meadows of Espinhaço range, Brazil. Zootaxa 2640: 53 – 61.
Marjanovic, D. and Laurin, M. 2007. Fossils, molecules, divergence times, and the origin of Lissamphibians. Systematic Biolology 56: 369–388.
MMA (Ministério do Meio Ambiente). 1999. Ações prioritárias para a conservação da biodiversidade do Cerrado e Pantanal. MMA, Brasília, Brasil.
MMA (Ministério do Meio Ambiente). 2000a. Avaliação e ações prioritárias para a conservação da biodiversidade da Mata Atlântica e Campos Sulinos. MMA, Brasília, Brasil.
MMA (Ministério do Meio Ambiente). 2000b. Avaliação e ações prioritárias para a conservação da biodiversidade do bioma da Caatinga. MMA, Brasília, Brasil.
MMA (Ministério do Meio Ambiente). 2003. Áreas prioritárias para a conservação, utilização sustentável e repartição de benefícios da biodiversidade brasileira. MMA, Brasília, Brasil.
MMA (Ministério do Meio Ambiente). 2008. Instrução normativa No. 6, de 23 de setembro de 2008. Ministério do Meio Ambiente, Brasília. Available from http://www.mma.gov.br/estruturas/179/_arquivos/179_05122008033542.pdf (accessed 20 January 2011).
Napoli, M. F., Cruz, C. A. G., Abreu, R. O., and Del–Grande, M. L. 2011. A new species of Proceratophrys Miranda–Ribeiro (Amphibia: Anura: Cycloramphidae) from
the Chapada Diamantina, State of Bahia, Northeastern Brazil. Zootaxa, 3133: 37–49. Parra, G., Brown, R., Hanken, J., Hedges, B., Heyer, R., Kuzmin, S., Lavilla, E., Lötters, S., Pimenta, B., Richards, S., Rödel, M. O., de Sá, R. O., and Wake, D. 2005. Page 64 in Amphibian Conservation Action Plan. IUCN/SSC Amphibian Specialist Group. Gland, Switzerland and Cambridge, UK.
Oryzomyini), with comments on Oryzomyine biogeography. Zoological Journal of the Linnean Society 161: 357–390.
Pyron, R. A., and Wiens, J. J. 2011. A large-scale phylogeny of Amphibia with over 2,800 species, and a revised classification of extant frogs, salamanders, and caecilians. Mollecular Phylogenetenetics and Evolution 61: 543–583.
Rodrigues, M. T., Cassimiro, J., Pavan, D., Curcio, F. F., Verdade, V. K., Pellegrino, K. C. M. 2009. A new genus of microteiid lizard from the Caparaó mountains, Southeastern Brazil, with a discussion of relationships among Gymnophthalminae (Squamata). American Museum Novitates 3673: 1–26.
Safford, H. D. 1999. Brazilian páramos I. An introduction to the physical environment and vegetation of the campos de altitude. Journal of Biogeography 26: 693–712.
Segalla, M. V., Caramaschi, U., Cruz, C. A.G.; Garcia, P. C.A.; Grant, T., Haddad, C. F. B, and Langone, J. 2012. Brazilian amphibians – List of species. Available from http://www.sbherpetologia.org.br. Sociedade Brasileira de Herpetologia (accessed October 2012).
Silva, J. A., Machado, R. B., Azevedo, A. A., Drumond, G. M., Fonseca, R. L., Goulart, M. F., Moraes Júnior, E. A., Martins, C. S., Ramos Neto, M. B. 2008. Identificação de áreas insubstituíveis para conservação da Cadeia do Espinhaço, estados de Minas Gerais e Bahia, Brasil. Megadiversidade 4: 272–309.
Stuart,S. N., Chanson, J. S., Cox, N. A., Young, B. E., Rodrigues, A. S. L., Fischman, D. L., and Waller, R. W. 2004. Status and trends of amphibian declines and extinctions worldwide. Science 306: 1783–1786.
Versieux, L. M., and Wendt, T. 2007. Bromeliaceae diversity and conservation in Minas Gerais state, Brazil. Biodiversity and Conservation 16: 2989–3009.
Capítulo 1
Anuran diversity and conservation deficits for the greatest
Brazilian mountain range: a gap analysis based on species
distribution models.
Leite, F. S. F., Oliveira, U., Neves, F. S., Garcia, P. C. A. (in prep.). Anuran diversity and conservation deficits for the greatest Brazilian mountain range: a gap analysis based on species distribution models. Manuscrito em fase final de
Anuran diversity and conservation deficits for the greatest Brazilian mountain
range: a gap analysis based on species distribution models.
Abstract
We investigated patterns of richness and endemism of anurans in the most extent
Brazilian mountain range and evaluate species conservation trends by accessing the
adequacy of protection (representation) and habitat loss of each endemic species. We
used a large point locality data set and three distribution modeling technics to produce
detailed maps of the predicted range of 47 Espinhaço range anuran species. Then, we
compared predicted distributions with the current Brazilian reserve system to assess the
adequacy of protection (based on species-specific representation targets) for each
endemic species and detect gaps in protection. After that, we accessed the amount of
habitat already lost within species range. Finally, we verified how endemic species
life-history traits are related to their range-size, habitat loss, protected range and adequacy
of protection. Species richness, endemism richness and endemism levels aggregated
into two main hotspots localized in the southern portion of the range and in the Chapada
Diamantina at its northern portion, but less inclusive areas of great richness and
endemism levels were also pinpointed. We reported one of the most worrying cases of
species representation in reserves ever reported, considering gap analyses performed at
different continents and various taxonomic groups (87% of the endemics are not
properly protected). The vast majority (94%) of species have been already affected by
habitat loss, in a way the fulfillment of the protection target of nine narrowly endemic
species became unreachable. Forest anurans lost more of their range than species that
reproduce in open habitats. Considering multiple criteria (species richness, endemic
we pinpoint several areas of special concern for habitat protection. Our findings also
highlight the urgent need to extend field efforts towards exploration on other
Neotropical mountains because of their great relevance for the scientific research and
biodiversity conservation.
Introduction
The creation and maintenance of protected areas (PAs) is a world-wide key
strategy to protect endangered biodiversity (Bruner et al., 2001; Chape et al., 2005). For
this purpose, over the years, countries have established (though at different rates) a
reserve network which accounts for nearly 13% of the global territory (Jenkins & Joppa,
2009). However, in the absence of spatially explicit data, it is unlikely that a network of
protected areas can be effectively designed so as to ensure proper biodiversity
protection (Brooks et al., 2004a; Pressey, 2004). Thus, understanding the spatial
patterns of species richness and endemism provide the essential first step of systematic
conservation planning (Margules and Pressey, 2000). Nevertheless, our knowledge
about how many species inhabit Earth and their geographical distributions remains
incipient and plagued by the so-called, respectively, Linnean and Wallacean shortfalls
(Lomolino, 2004; May, 2010; Mora et al., 2011). These shortages are mostly
problematic in the tropics (Kress et al., 1998; Bini et al., 2006), especially in mountain
ranges where many new species and genera of vertebrates are still described at a rapid
pace (e.g. Rodrigues et al., 2009; Percequillo et al., 2011) and individuals records are
fairly sparse and spatially biased owing to their remoteness and extremely difficult
access. The most extent South American mountain range besides Andes, the Espinhaço
by an extremely rich and endemic biota and huge knowledge gaps (Giulietti et al., 1997;
Echternacht, 2011).
Several studies have demonstrated that PAs often do not represent the biodiversity
properly (Scott et al., 1993; Rodrigues et al., 1999; Margules and Pressey, 2000) as
reserve locations are frequently chosen opportunistically and without targeting on one
of its major goals—namely, protecting species. In a world-wide assessment 74% of terrestrial vertebrates species were found not to meet their representation targets
stressing global reserve system is far from complete and have yet to be augmented
(Rodrigues et al., 2004). This picture is even more severe for amphibians which are
markedly less well covered than other taxa because they have much smaller range sizes
(increasing the probability of falling through the network) and because few reserves
have been created with specific consideration of amphibians, while mammals and birds
are more often taken into account (Rodrigues et al., 2004). Not by chance, amphibians
are also the terrestrial vertebrates most at risk of extinction: at least 37% are classed as
Vulnerable, Threatened or Endangered (IUCN, 2012). This scenario is certainly
optimistic, because the conservation status of about 25% of species remains unknown
(IUCN, 2012) and because many taxa are still not known (Bini et al, 2006; Giam et al.,
2012).
Gap analysis is a systematic planning tool which aims to assess the extent species,
vegetation types or biomes are adequately protected by an existing reserve network, by
defining representation biodiversity targets (Scott et al., 1993; Jennings, 2000).
Representation targets play a major role in systematic conservation planning by
providing clear purposes for implementing conservation actions particularly for
decisions regarding area prioritization (Margules and Pressey, 2000; Cowling et al.,
original range required to allow species persistence (Rodrigues et al., 2004). Therefore,
a solid gap analysis should rely on spatially explicit data which must include species
detailed distributions (not to be confused with gross delineations of range limits) and
also account for previous habitat losses (Jennings, 2000). However, if the current
distribution of an element is already hard to known (especially in the tropics) the
historic distribution is even more difficult.
A wide range of methods has been used for estimating species distributions
(Graham & Hijmans, 2006). Within this broad spectrum of techniques the use of species
distribution models (SDM) is an alternative to overcome the lack of current and
historical knowledge about species distributions (Elith and Leathwick, 2009). These
models have recently increased in sophistication and prediction accuracy and can even
perform satisfactorily for species known from few localities (Elith et al., 2006,
Hernandez et al., 2006). Niche-based models estimate the relation between a species
and its environment and then predict a distribution based on the occurrence of the
identified suite of environmental variables across the landscape under study (Elith and
Leathwick, 2009). Although their caveats (Wiens et al., 2009; Warren, 2012), SDM
have been successfully applied to a variety of questions in ecology, evolution, and
conservation (Araújo and Peterson, 2012).
The Espinhaço range (known as Serra do Espinhaço) represents the most
extensive and continued orogenic belt of the Brazilian territory (Almeida-Abreu &
Renger, 2002). Unlike other main mountain ranges of central and eastern Brazil that are
fully embedded in a single biome (Atlantic forest or Cerrado) the Espinhaço range is
located in the transition zone between these two Neotropical hotspots and it is still the
only large mountain range embedded within the Caatinga semi-arid biome (Fig. 1).
isolated from other large blocks of South American highlands (Andes, Pantepui, and
southern Brazilian ranges). Due to this isolation, the Espinhaço harbours a unique biota
with many endemic genera and species of plants (Giulietti & Pirani, 1988). The Atlantic
forest and the Cerrado are among the most diverse and threatened regions of the world
(Mittermeier et al., 2005). Recent estimates based on satellite remote sensing shows that
between 84% and 88.6% of the Atlantic forest and approximately 55% of the Cerrado‘s
original vegetation has been removed (Machado et al., 2004; Ribeiro et al., 2009). The
Caatinga conservation status is not better. Between 30.4% and 51.7% of this semi-arid
biome has been altered by human activities, which conservatively rank this biome as the
third most heavily impacted in Brazil (Leal et al., 2005). Owing to its steep relief,
Espinhaço higher lands remained less altered than adjoining lower lands offering a
unique possibility to still conserve part of the original biodiversity of these three
threatened Neotropical biomes. Nevertheless, the extreme high number of threatened
narrowly endemic species in these habitats (MMA, 2008; IUCN, 2012) and the
increasing pace of human driven disturbance activities (Jacobi et al., 2007; Versieux &
Wendt, 2007; Barbosa et al., 2010) claim for urgent conservation actions.
In this paper we depict for the first time the spatial patterns of anuran richness,
endemism and collection effort across the entire Espinhaço range based on a large data
set. We benefit from SDM to generate range maps of 47 endemic species. Then, we
compare predicted distributions with the current Brazilian reserve system to assess the
adequacy of protection (representation) for each endemic species and detect eventual
gaps in protection. After that, we superimpose these maps to a map of Brazilian
vegetation remnants to access the amount of habitat already lost within species range.
Finally, we verify how endemic species life-history traits are related to their range-size,
provide multiple relevant criteria that will be useful to assist upcoming species
conservation status reassessments and pinpoint areas of high conservation priority.
Methods
Data collection
We gathered a database on anuran distribution in the Espinhaço range based on
museum specimen inspection and field surveys. We limited our revision to localities
placed within an elevation threshold of 500 m a. s. l. around the range. All museum
specimens‘ identities were checked by physical examination. We examined 17,240
specimens deposited in seven Brazilian collections (see acknowledgments). To fill some
sampling gaps we carried out from 2007 to 2011 field surveys in 14 localities
accounting for 140 days of fieldwork and 4,466 georeferenced sampled anurans. When
available, we used geographical coordinates from museum databases, and in other
instances, precise locations were obtained directly from collectors. When record
coordinates were not available in museum databases, we approximated point localities
from locality descriptions using Google Earth® and the Geoloc tool (available in
http://splink.cria.org.br). When these information where not available, locations were
represented by municipality administration center. We classified species according to their breeding habitats based on field data and literature accounts.
Measures of species richness, endemism and collection effort
We mapped, based on point localities data, the geographic distributions of all
Espinhaço anuran species. The distribution of all species was then overlaid into a single
map with a spatial resolution of 0.3 grid cell using the software ArcGis™ 10.0,
mountain range. Collection effort was inferred by summing the number of collected
specimens per grid cell.
To measure endemism we calculated the weighted endemism index (WE)
following Williams & Humphries (1994), Slatyer et al. (2007) and others. WE counts
all species in a given area, but weighting each by the inverse of its range, assigning high
weights to small ranged species, and progressively smaller weights to more widespread
species. Thus, a species with 1000 km2 of range-size would have a WE 10 times bigger
than a species with a range of 100,000 km2. Species range-size was predicted by
Fig. 1 General location of the Espinhaço range in eastern Brazil, depicting main
landscape features mentioned in the text and adjoining biomes: Atlantic forest (At),
Cerrado (Ce), and Caatinga (Ca). Protected areas are outilined by red. Darker gray tones
represent increasing elevations from 785 to 2072 m a. s. l. Gray lines indicate state
Environmental data and distribution modeling
Environmental variables used to produce niche-based distribution models
included climatic, topographic and sensing-derived vegetation variables at a 30″ (1 km2)
spatial resolution. The integration of climatic-topographic variables with remote
sensing-based variables is likely to produce more accurate spatial predictions of species
distribution (Zimmermann et al., 2007; Buermann et al., 2008). We used enhanced
vegetation index (EVI) derived from MODIS reflectance as a proxy of vegetation
structure which in turn may encompass a suite of small-scale habitat characteristics (e.g.
microhabitat and microclimate) known to strongly affect the suitability of habitat for
anurans (Blaustein et al., 1994). To account for EVI annual variation we calculate the
mean EVI values of the wettest (January) and driest month (July) from 2000 to 2010.
We included in our SDMs only variables weakly correlated (r < 0.8) for the study area.
This procedure was done to avoid or minimize overparameterization of the models with
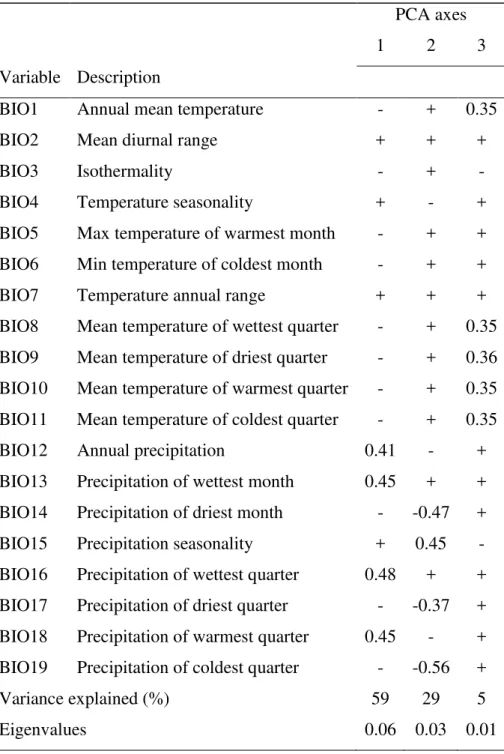
redundant variables. Therefore, from a set consisting of 19 bioclimatic variables relating
to temperature and precipitation, two topographic (i.e. slope and altitude), plus EVI
values, we included in the models seven variables namely, temperature seasonality,
temperature annual range, annual precipitation, precipitation seasonality, slope, mean
January EVI (2000 – 2010), and mean July EVI (2000 – 2010). Climatic variables were downloaded from the Worldclim data base (Hijmans et al., 2005;
http://www.worldclim.org/); topographical variables were from the shuttle radar
topography mission (http://srtm.csi.cgiar.org/), and EVI values from the US Geological
Survey‘s (http://glovis.usgs.gov/).
Three modelling methods with distinct logics and increasing levels of complexity
Euclidean distance algorithm (ED), with distances being measured to the closest point;
the Mahalanobis distance algorithm (MD), with distances being measured to the
average of all presence points; and the machine-learning maximum entropy model
Maxent (Phillips et al., 2006). The distance-based models were chosen due to their
conceptual simplicity and because they do not need information about absences to
determine the suitable conditions for a given species. They measure environmental–
climatic similarity of characteristics of each species‘ occurrence as Euclidean or Mahalanobis distances to the nearest or mean of the available climatic space (Farber &
Kadmon, 2003). Also, the ED was selected owing to the presence of species with very
small sample within our data set which could not to be modelled with other algorithms
(e.g. Siqueira et al, 2009). Maxent was chosen because it also has been shown to work
better than other approaches with small samples (Hernandez et al., 2006; Pearson et al.,
2007; Wisz et al., 2008). We did not carry out MD and Maxent projections for species
with less than 18 and five occurrence points, respectively. ED projections had no
sample size restrains. Distance-based methods were implemented by the package
openModeller Desktop 1.1.0 (http://openmodeller.sourceforge.net/). Maxent 3.2.4 was
used to run the maximum entropy models (Phillips & Dudik, 2008).
To estimate the range-size of species, we converted MD and Maxent models
continuous outputs into presence/absence maps by applying the lowest presence
threshold (LPT). Because ED distances were measured to the closest point rather than to
the average of all points, allowing us to deal with very small sample sizes, we could not
have applied the traditional LPT threshold. Thus, in order avoid the use of arbitrary
thresholds upon the ED outputs we generated, for species with five or more occurrence
points, new models each of them with an exclusive subset of points, being one of the
This procedure was repeated such as the number of replicates models equals the number
of available occurrence points. Then, for each model we extract the suitability values of
the pixel corresponding to the removed point. Finally, the minimum value obtained
within all models was assumed as the LTP thresholds and was applied to the full model.
For species with less than five points (modeled only with ED) we applied an arbitrary
threshold, as there was no other available alternative, where only pixels with suitability
of occurrence above 0.7 were considered as potentially suitable for the species and
therefore were included in the prediction. Applying a high threshold will reduce the risk
of selecting sites with low suitability for individual species what is especially desired
for gap analysis and other conservations purposes.
Because models may yield different outputs (Loiselle et al., 2003; Thuiller, 2004;
Araújo et al., 2005), it is better to integrate results across multiple methods (Araújo &
New, 2007). We used an ensemble-forecasting approach (Araújo and New, 2007) in
order to deal with models variability and uncertainty and to obtain the central tendency
of predicted distributions. For species which the number of occurrence points allowed
the use of two (≥ 5 points) or three (≥ 18 points) modeling algorithms we made an ensemble forecast to reach a consensus scenario among the two or three models,
respectively. We carefully analyzed each species consensus distribution and excluded
from the predicted range polygons corresponding to disjoint areas where a given species
is well known not to occur (Swenson et al., 2012). This was especially useful, for
example, to exclude occurrences of southern Espinhaço endemics predicted into its
northern portion where they are known not to occur, being sometimes replaced by a
Criteria for gap and habitat loss analysis
We carried out gap analyses considering the projected distribution of the 47
endemic anuran species. We performed two analyses: one with all categories of reserves
including both strictly protected (e.g. national parks, state parks, equivalent to IUCN
category II) and sustainable use reserves (equivalent to IUCN category V), herein ‗all reserves‘, and another only with strictly protected reserves. We did not include the
Brazilian reserve category ‗Area of Environmental Protection‘ within the all reserves
analyses because conversion of natural land cover for low-intensity type activities (e.g.
extensive cattle breeding) or localized intense type (e.g., mining and urban settlements)
in these areas are generally allowed. We judged this reserve category, the way they
work in the studied area, if not in entire Brazil, bring so few protection to an area that it
could not be considered as a species protection surrogate. This category can also occupy
broad extensions within the studied area (especially at its southern portion) and so
would bias the amount of representation targets achieved by species. We overlapped
predicted distributions with the current map of Brazilian protected-area system to access
the adequacy of protection (representation) for each species and detect eventual gaps in
protection. Shape files of Brazilian protected areas were downloaded from IBGE
webpage (Brazilian Institute of Geography and Statistics; http://mapas.ibge.gov.br/) and
consist of federal, state and municipal reserves, implemented until 2011.
Representation is the percentage of area of a species range included within
protected areas, in order for the species to be considered covered (Rodrigues et al.,
2004). Representation target is a parameter commonly used in conservation planning to
assess adequacy of protection (Margules and Pressey, 2000; Margules and Sarkar,
occupied by each species. For very narrowly distributed species (area of occupancy <
500 km2), the representation target is 100% of the range; for widespread species (<
25,000 km2), the target is 10%. For species with area of potential presence of
intermediate size (> 500 < 25,000 km2) the target was interpolated between these two
extremes using a linear regression on the log-transformed area occupied, following the
procedure proposed by Rodrigues et al. (2004). A species was considered a ―gap species‖ if less than 20% of its representation target was met, ―partially protected‖ if its
representation target is only partially met (more than 20% less than 90%), and
―protected‖ if more than 90% of its representation target was achieved. We create an
index which, in a way similar to the WE, counts all species (no matter how represented)
in each cell but weighting each by the inverse of the percentage of the representation
target it had achieved. We term this measure Representation Deficit Index (RDI). Thus,
species with higher representation deficit index are worse protected and more likely to
be exposed to habitat loss.
We superimpose each species‘ predicted distribution to the latest version of the
maps of Brazilian vegetation remnants (i.e. Atlantic forest, Cerrado and Caatinga)
available at the Brazilian Biomes Deforestation Monitoring Project webpage
(http://siscom.ibama.gov.br/monitorabiomas/index/) to access the amount of their range
already affected by habitat loss. In order to ensure species more affected by habitat loss
to have an increased relative importance in relation the lesser affected species we create
a simple index. The Habitat Loss Index (HLI) weights species more affected by
conversion of natural landscapes in to unsuitable habitats by squaring the proportion of
its predicted range already lost. To obtain a habitat loss score for a cell, these weights
Statistical analyses
Generalized linear models (GLMs) were built to evaluate the effect of
physiognomy (forested/open), water flow (lotic/lentic), and hydroperiod
(temporary/permanent) of breeding habitat (explanatory variables) on the species
predicted range and latitudinal range (response variables). We also applied GLMs to
verify the effect of the same set of reproductive habitat variables plus the species
predicted range on the percentage of range under protection, the percentage of the
representation target achieved and the percentage of original range already affected by
habitat loss. The minimal model was constructed by removing non-significant
explanatory variables (p> 0.05) from the complete model in all the analyses described
above. All models were developed using R software 2.10 (R Development Core Team,
2010), followed by residual analyses and assessment of error distribution adequacy
(Crawley, 2007).
Results
Species richness, endemism and collection effort
The Espinhaço range has high anuran species richness, including endemic,
widespread, and species typical from each of the three biomes it is embedded in (i.e.
Atlantic Forest, Cerrado and Caatinga). We recorded 162 anuran species, belonging to
15 families, and 37 genera (Appendix I, supplementary material). Families with the
highest number of representatives were Hylidae (78), Leiuperidae (22), Leptodactylidae
(16), Cycloramphidae (12) and Brachycephalidae (10). The monotypic genus Rupirana
and other 46 (ca. 29%) taxa are endemic. The stream dweller Bokermannohyla
mountains showed a particularly high level of endemism in the Espinhaço. Six out of
ten known species of this group are Espinhaço endemics. Thirteen (ca. 28%) out of the
47 endemic species are undescribed but easily diagnosable new taxa. Some other
verified specimens could not be assigned to any described species, but due to taxonomic
problems concerning many Neotropical anuran taxa, we assume a more conservative
criterion and did not considered them as multiple undescribed species.
Fig. 2 (A) Number of anuran species per unit area (0.3° x 0.3° cell) (B) collection effort
by means of the number of museum specimens records in the Espinhaço range in the
states of Minas Gerais and Bahia, Brazil.
The maximum values for anuran species richness were found in southern portion
of the Espinhaço range, in areas corresponding to the Serra do Cipó and the eastern
up to 73 species (Fig. 2A). In addition, isolated cells of moderately high richness exist
in the northern edge of the Diamantina Plateau, and in the Serra de Grão Mogol, in the
north of Minas Gerais. Species richness decreases towards northern region, in areas
corresponding to the small mountain chains of northern Minas Gerais and Chapada
Diamantina, in the state of Bahia.
Mapping the number of museum specimens collections per grid cell depicts a
sampling bias towards the southern portion of the mountain range, where the Espinhaço
most representatives anuran collections (UFMG and MCNAM) are located and
historical collection were made by 1960-70 (Fig. 2B). Species richness and collection
effort maps exhibit relatively congruent distribution patterns (Fig.2A, B). However, grid
cells with the greatest richness in Espinhaço do not overlap completely with the
collection effort pattern.
The raw data and modeled endemism richness followed the same overall richness
pattern with maximum values located in areas corresponding to the range‘s
southernmost portion (Fig. 3A, B). Relative low values for anuran endemic richness
were also found in areas corresponding to the small mountain chains of northern Minas
Gerais. Conversely, endemic richness increases to moderate levels in the southern
portion of Chapada Diamantina region, in the state of Bahia but again, decreases
northwards in areas with lower altitudes.
Weighted endemism highlighted two narrowly distributed hotspots in the eastern
slopes of Serra do Cipó and in the Pico do Itambé (Itambé summit). Three other areas
with moderate to high endemism levels were predicted to occur in the Serra do Cabral,
Almas-Barbado complex and Serra do Sincorá, both at the southern portion of Chapada
Fig. 3 (A) Number of anuran endemic species per unit area (0.3° x 0.3° cell) based on the raw data (B) number of endemic species based on the
species distributions models (C) weighted endemism index in the Espinhaço range in the states of Minas Gerais and Bahia, Brazil. Zooms
Gap and range loss analysis
The current Brazilian reserve network within the Espinhaço range failed to ensure
the representation of most of its endemic anuran species (Fig. 4). For all reserves our
models identified the majority of taxa analyzed are gap (17, 36%) or partial gap species
(24, 51%) (Fig. 4). Only six species are properly protected. Furthermore, in the strictly
protected reserves seven (15%) species achieved less than 5% of its representation
targets including two southwestern Chapada Diamantina endemics which neither have
observational occurrences within reserves nor were predicted to occur in such areas
(Bokermannohyla flavopicta and Pseudopaludicola aff. mineira) and two southeastern
endemics which also have no records within protected areas (Aplastodiscus aff. cavicola
and Sphaenorhynchus aff. surdus). Considering both reserves systems more than half of
partial gap species reached less than 50% of their protection targets (Tab. 1). The area
with the highest values for the representation target index was located in the Espinhaço
southern portion at the eastern slopes of the Diamantina Plateau, corresponding to its
forested slopes (Fig.5B).
The predicted range was found to affect positively the percentage of the
representation target achieved in both the strictly protected (p=0.002) and all reserves
(p=0.002). However, conflicting examples could be found among narrowly endemic
species (range < 2500 km2) for which the percentage of the target achieved varied from
nearly zero (e.g. Aplastodiscus aff. cavicola and Sphaenorhynchus aff. surdus) to almost
100 (e.g. Crossodactylodes sp., a high altitude species with very limited distribution
which is entirely inside a State Park) (Fig. 4). We found the percentage of the
representation target achieved in both the strictly and all reserves was not affected by
The vast majority (94%) of species had already been affected by habitat loss (Tab.
1). Forty five percent (44) of the anuran endemics lost between 20 and 40% of their
original range, whereas 17% (8) lost more than 40%. Land use alone has already
decreased the range of 29 species (62%) by at least 20%, of which eight has already lost
more than 40% (Table 1). Forest anurans lost more of their range (x=34.9%, SD=15.6,
min=11.7%; max=56.7%; n=13; p=0.003) than species that reproduce in open
(x=19.4%, SD=12.5, min=0%; max=59.1%; n=27) or in both habitats physiognomy
(x=26.7%, SD=6.4, min=18.3%; max=36.1%; n=5), which in turn did not differ from
each other (p>0.05). Seven out of the eight species most affected by habitat loss are
forested species. Aplastodiscus aff. cavicola and Sphaenorhynchus aff. surdus were the
most affected species. Accordingly, the maximum values for the habitat loss index were
found in the meridional portion of the Espinhaço range, in areas corresponding to its
Atlantic forested slopes (Fig. 5A). Habitat loss was not affected by breeding habitat
water flow and hydroperiod (p>0.05), suggesting that despite higher in closed canopy
habitats it has not occurred alongside streams, ponds or puddles more than expected by
chance.
We did not find a significant relationship between life-history traits (i.e.
physiognomy, water flow, and hydroperiod of the breeding habitat) and the range-size
or latitudinal range of the endemic species (P >0.05). Neither the breeding habitat
features nor the range were found to affect the percentage of the range protected
Fig. 4 Relationship between percentage of current (dashed line) and expected protection
(target) (continuous line) for 47 Espinhaço range endemic anuran species, depicting
gap, partial gap and protected species, considering all reserves system.
Fig. 5 (A) Representation deficit index (B) habitat loss index for endemic anuran
Table 1. Spatially independent points (1 km x 1 km), estimated range (km2), percentage of range converted for anthropogenic use, number of
observational occurrences within all reserves categories, representation targets, percentage of range overlapping Brazilian reserves (strictly
protection reserves and all reserves), percentage of the representation target achieved (strictly protection reserves and all reserves), protection
status, and conservation status of 47 Espinhaço range endemic anurans.
Taxon Points Range
(km2)
Habitat loss (%) Occurrence within reserves Targe t (%) Protection in strictly protected reserves (%) Protection in all reserves (%) Target achieved (%) - stricly protected
Target achieved (%) - all reserves
Protection status - all reserves
IUCN (2011)
Brazil (2003)
Crossodactylodes sp. 1 6 0.0 1 100 99.3 99.3 99.3 99.3 protected - -
Physalaemus aff. rupestris 1 46 12.3 0 100 15.7 17.5 15.7 17.5 gap - -
Physalaemus deimaticus 1 168 0.4 1 100 65.0 65.0 65.0 65.0 partial gap DD DD
Scinax pinima 1 240 0.0 0 100 8.2 8.3 16.2 8.3 gap DD DD
Bokermannohyla juiju 3 322 8.3 1 100 79.4 79.4 79.4 79.4 partial gap - -
Scinax cabralensis 3 329 22.4 1 100 2.2 2.2 2.2 2.2 gap DD -
Fritiziana aff. fissilis 2 337 1.8 2 100 4.0 6.2 4.0 6.2 gap - -
Bokermannohyla sagarana 5 516 18.3 1 99 7.4 7.4 7.5 7.5 gap - -
Pseudopaludicola aff. mineira 6 526 16.6 0 99 0.0 6.7 0.0 6.8 gap - -
Physalaemus erythros 4 722 7.9 2 92 9.2 12.6 10.1 13.8 gap DD -
Hypsiboas cipoensis 12 1023 1.0 3 84 27.3 27.4 32.6 32.8 partial gap NT LC
Aplastodiscus aff. cavicola 4 1208 56.7 0 80 0.1 0.1 0.1 0.1 gap - -
Bokermannohyla itapoty 10 1641 18.0 1 73 50.5 50.5 69.5 69.5 partial gap LC -
Bokermannohyla martinsi 15 1706 26.6 6 72 9.1 18.6 12.7 25.9 partial gap LC LC
Sphaenorhynchus aff. surdus 2 1977 59.1 0 68 0.2 0.5 0.2 0.8 gap - -
Pristimantis aff. ramagii 5 2060 24.6 2 67 19.4 21.0 28.8 31.2 partial gap - -
Rupirana cardosoi 9 2225 23.4 1 66 38.7 38.7 58.9 58.9 partial gap NT LC
Physalaemus evangelistai 9 2404 8.7 6 64 18.1 22.0 28.3 34.5 partial gap DD DD
Phasmahyla jandaia 7 2511 21.2 5 63 14.0 17.4 22.3 27.7 partial gap LC LC
Scinax sp. (clade ruber) 18 3340 23.6 2 56 21.9 22.9 8.2 40.6 partial gap - -
Hylodes uai 7 3605 41.7 4 55 1.6 5.2 3.0 9.4 gap DD LC
Scinax aff. curicica 7 4147 27.6 1 51 20.3 21.2 39.5 41.4 partial gap - -
Scinax machadoi 8 4326 27.3 4 50 8.2 9.5 16.2 18.8 gap LC LC
Pristimantis sp. 11 4398 24.4 0 50 21.9 22.9 43.8 45.8 partial gap - -
Bokermannohyla nanuzae 23 4724 11.7 6 48 19.7 19.7 40.7 40.7 partial gap LC LC
Proceratophrys minuta 6 4958 36.1 2 47 15.1 15.1 32.0 32.0 partial gap - -
Bokermannohyla diamantina 9 4996 25.3 1 47 6.0 6.8 12.8 14.4 gap DD -
Leptodactylus gr. fuscus 9 5299 27.7 1 46 23.2 24.1 50.7 52.7 partial gap - -
Bokermannohyla aff. feioi 11 5344 51.5 2 45 3.0 6.4 6.5 14.1 gap - -
Strabomantis aramunha 13 6197 28.7 2 42 18.6 19.2 44.2 45.7 partial gap DD -
Bokermannohyla oxente 32 6533 27.5 2 41 16.0 16.4 39.1 40.2 partial gap LC -
Hypsiboas botumirim 19 6853 19.4 5 40 11.7 11.8 29.3 29.7 partial gap - -
Physalaemus orophilus 10 6880 50.8 2 40 2.6 3.9 6.7 9.8 gap - -
Phyllomedusa megacephala 12 7474 10.4 3 38 16.4 16.4 43.3 43.5 partial gap DD LC
Proceratophrys cururu 7 8721 13.9 5 34 16.3 16.3 47.5 47.6 partial gap DD LC
Pseudopaludicola mineira 24 10054 12.4 6 31 16.1 16.2 52.1 52.2 partial gap DD LC
Leptodactylus camaquara 26 10590 17.0 8 30 16.1 16.5 54.2 55.4 partial gap DD LC
Hylodes otavioi 4 12324 47.3 1 26 3.9 4.0 14.8 15.1 gap DD DD
Crossodactylus trachystomus 19 20097 22.0 8 15 12.7 13.7 84.6 91.3 protected DD LC
Scinax tripui 7 24615 45.3 1 10 4.5 5.5 43.1 53.2 partial gap - -
Scinax curicica 38 27233 33.2 11 10 9.1 9.9 90.9 99.3 protected DD -
Bokermannohyla saxicola 38 28871 27.0 9 10 9.6 9.6 95.8 96.4 protected LC LC
Bokermannohyla alvarengai 55 29782 27.2 11 10 9.7 10.3 96.8 102.9 protected LC LC
Thoropa megatympanum 72 31846 26.7 11 10 9.6 10.1 96.5 100.5 protected LC LC
Discussion
Species richness and endemism
Our results give the first clear description of current anuran species richness and
endemism patterns of an entire Brazilian mountain range. Species richness and
endemism levels gathered for Espinhaço range anurans overcomes those previously
detected by Leite et al. (2008) review which was based manly in literature records. We
added 58 species not listed by Leite et al. (2008) revealing a much more diverse anuran
fauna than previously known. The gathering of all these distributional and taxonomy
data has allowed the description of several new species (e.g. Canedo et al., 2010; Leite
et al., 2011; Leite et al., 2012; Carvalho et al., in prep.; Barata et al., in prep.). Eight
endemics were described in the last five years (Cassimiro et al., 2008; Caramaschi et al.,
2009; Lourenço et al., 2009; Cassini et al., 2010, Maciel & Nunes, 2010; Leite et al.,
2011; Napoli et al., 2011; Leite et al., 2012) nevertheless, as noted by Leite et al.
(2012), many Espinhaço endemic taxa still wait for formal description. These results
attest the extent of our ignorance concerning Neotropical mountains biota and
emphasize the decisive importance of bringing together fine point-locality species data,
based on careful revision zoological collections and field surveys designed to cover
sampling gaps, prior to conservation planning analyses (Brooks et al., 2004b; Nogueira
et al., 2011). It also justifies the funding of extensive research programs with the basic
purpose of inventorying and describing new species, especially in poorly known
tropical developing regions of the world characterized by high rates of habitat loss and,
often, by very high biodiversity.
The only Brazilian biome for which there is an anuran species list recovered by
Cerrado. However, the southern portion of the Espinhaço is often included in the
Cerrado and therefore part of its fauna is considered not only to happen in this biome
but also to be endemic to it (Colli, 2005; Valdujo et al., 2012). The number of species
and endemic species recorded herein is equivalent to 80% and 57% of the 204 species
and 83 endemic species (excluding the 19 Espinhaço species Valdujo et al. (2012)
considered also Cerrado endemics) found in the Cerrado, respectively. Nevertheless, if
considered the sixfold Cerrado larger area (2,058,200 km2) in relation to the range‘s
area (328,186 km2 above 500 m of elevation) and the expected effect of the species-area
relationship the Espinhaço alone seems to have a relative greater anuran species
richness and endemism richness than its neighboring savanna-like biome. In fact, a
considerable portion of the Cerrado anuran richness, especially endemic species, are
found on its southeastern portion in the transition with the Atlantic Forest in regions
with greater altitudinal variation which corresponds to the Espinhaço range (Diniz-Filho
et al., 2007; Diniz-Filho et al., 2008; Silvano et al., 2011). This pattern was also
corroborated for Cerrado squamates reptiles for which altitude was important in
predicting species richness (Costa et al., 2007) and endemism richness prevailed in open
elevated plateaus, which is the case of Espinhaço, instead in the peripheral depressions
(Nogueira et al., 2011). These results suggest not only altitude but also the geographic
location of the range between two Neotropical hotspots might be related to the great
anuran diversity found at the Espinhaço range.
The number of Espinhaço anuran endemic species documented in the present
study largely surpasses those known for any other vertebrate group, including fishes
(27, Alves et al., 2008), birds (5, Vasconcelos et al., 2008; Freitas et al., 2012), and
mammals (2, Lessa et al., 2008). There is no synthesis about Espinhaço endemic
observation). This pattern is similar to that described for tropical Andes (Lynch, 1987;
Lynch et al., 1997). In contrast with other vertebrate ectotherms, the better ability to
adjust their physiology at lower temperatures at high elevations (Navas, 1996), higher
ecophysiological constraints and the low dispersal ability of anurans, the latter supposed
to cause geographic isolation and further speciation (Hillman et al., 2009) are likely to
be the main factors behind these patterns. Endemic vertebrates were showed to be the
most effective surrogates for identifying conservation priorities at an infracontinental
scale (Loyola et al., 2007). In this sense, the higher number of endemic anurans in
highland systems and its usual narrower distributions when compared to other
vertebrates make them possibly one of the best indicator groups for conservation
planning analyses within tropical mountain ranges.
It is clear from this study that richness, endemism richness and endemism levels
(WE) are not distributed randomly over the landscape, but do aggregate into hotspots
localized in the southern portion of the range (Quadrilátero Ferrífero, Serra do Cipó, and
Diamantina Plateau) and in the Chapada Diamantina at its northern portion. Why this
phenomenon occurs is properly the subject of macroecology and biogeography, and
beyond the scope of this paper. However, these hotspots correspond to the largest,
highest and most continuous highland islands of the entire range. Accordingly, besides
climatic factors commonly used to explain richness patterns across broad scales
environmental gradients (e.g. Costa et al, 2007; Diniz-Filho 2008) there may be other
variables such as area and degree of isolation playing important roles in determining
species richness and endemism in this high altitude topographic islands system.
The decrease in endemism levels between the southern and northern hotspots and
found there. Most species recorded in these regions despite being endemic are well
distributed across the range and therefore contributes little to local WE. This general
pattern of species richness and endemism is well corroborated by many Espinhaço plant
taxa (Harley, 1995; Pirani et al., 2003; Echternacht et al., 2011a). The positive
correlation between overall and endemic species richness and the collection effort
suggests this pattern could be biased. However, by modeling endemic species
distributions based on extensive specimen-based revision we believe to have reduced
this bias (Elith and Leathwick, 2009).
Gap and range loss analysis
The Brazilian reserve network within the Espinhaço range revealed to be very
inefficient in conserving its endemic anurans. We reported one of the most worrying
cases of species representation in reserves ever reported, considering gap analyses
performed at different continents and various taxonomic groups, including anurans
(Fjeldså et al., 2004; Maiorano et al., 2006; Catullo et al., 2008, Urbina-Cardona &
Loyola, 2008; Ochoa-Ochoa et al., 2009). The extent species are being protected based
on species-specific representation targets were accessed only two times in Brazil, both
for the Cerrado region. Silvano et al. (2011) found 58% of this savanna-like biome
endemic anurans did not achieve 20% of their targets and therefore were considered gap
species. However, the range-size thresholds they use for defining targets were far higher
than those we use. We applied the same targets they apply and found almost 100% of
Espinhaço endemic anurans would have to be considered gap species. A gap analysis
concerning this Neotropical hotspot birds showed only 3 (8%) out of 38 endemics are