COMPUTATIONAL ANALYSIS OF
INTAKE MANIFOLD DESIGN AND
EXPERIMENTAL INVESTIGATION ON
DIESEL ENGINE FOR LCV
S. KARTHIKEYAN, R. HARIGANESH, M.SATHYANADAN, S. KRISHNAN
Engine Product Development Department (Sunrise), Ashokleyland Technical Center Chennai, Tamil Nadu, India
P. VADIVEL, D.VAMSIDHAR
CFD Department, Defiance Technologies Chennai, Tamil Nadu, India
Abstract:
It is quite familiar that a duly designed intake manifold is essential for the optimal performance of an internal combustion engine. Air flow inside the intake manifold is one of the important factors, which governs the engine performance and emissions. Hence the flow phenomenon inside the intake manifold should be fully optimized to produce more engine power with better combustion and further reduces the emission. In this paper, during the new engine development the pressure waves for the intake manifold is simulated using 1D AVL-Boost software, to study the internal air flow characteristic for the 3-cylinder diesel engine during transient conditions. Based on the 1D simulation results (stage-I), the intake manifold design is optimized using 3D CFD software under steady state condition. As a result of this 3D CFD (stage-I) analysis, the disproportionate flow of air inside the runners is identified and pressure inside the runner is also experimentally investigated on the engine test bench. Further the engine smoke level is also investigated using engine test bench for the initial (stage-I) and optimized (stage-II) manifold. From the investigation, it is identified that the pressure inside the runners are uniform and smoke level is also reduced for optimized inlet manifold design.
Keywords: Intake manifold, Pressure, AVL boost-1D, Smoke.
1. Introduction
The main task of an Inlet Manifold (IM) is to distribute air inside the manifold runner uniformly, which is essential for an optimized IM design. The IM design has strong influence on the volumetric efficiency of the engine. An uneven air distribution leads to less volumetric efficiency, power loss and increased fuel consumption [1, 2].
Depending on the amplitude and phase of pressure waves inside the IM, filling of cylinders by air can be affected positively or negatively. The amplitude and phase of these pressure waves depend on IM design, engine speed and valve timing. The unsteady nature of the induction means the effect of the manifold on charging is extremely dependent upon the engine speed. This is because the entry of air inside the IM is a function of varying pulses into it. Therefore these pulses should be fine tuned in engine manifolds to give required power [3, 4, 5].
IM can be designed in various ways, although for naturally aspirated engines the only suitable method which considers the passage of waves in the pipes. The reason is very large effect of unsteady flow which affects volumetric efficiency of the engines, such method is defined as wave action calculation method. It is possible to use such techniques with turbocharger engines because the component of turbocharger acts as filters to the waves and force the gas into the cylinders; such engines are less susceptible to waves effect [6].
2. Design Parameters for Intake Manifold
To design an optimal intake manifold, following parameters should be taken into consideration: 1. Uniform distribution of air to all cylinders.
2. Minimum possible resistance in IM runners.
3. Proper designs of IM profile helps to reduce the sudden raise in pressure waves which improve induction process and also eliminate the unnecessary turbulence and eddies inside the intake manifold.
3. Computational Analysis
3.1.Steady state analysis
The main aim of steady state analysis is to find the air flow pattern for different cylinder opening conditions. Further eddies formation during suction stroke can be analyzed. Steady state analysis can provide the loss coefficients but it cannot provide any information about an IM performance in the transient operating conditions. The boundary condition (BC) used in the steady state simulation is constant pressure.
3.2.Transient analysis
Flow through an intake manifold is dependent on the time since crank angle positions vary with respect to time. Unsteady state simulation can predict how an IM work under real conditions. The boundary conditions are no longer constant but vary with time. The IM pressure data is obtained from 1D analysis using AVL BOOST software.
3.3.Simulation procedure
The following step shows steady and unsteady simulation procedures:
1. Creation of 3D model of IM using Pro-E software.
2. Mesh generation in ICEM CFD software. Many kinds of mesh size have been generated and after the grid independency investigation, 0.4 million cell mesh size is selected for this steady state simulation.
3. The information of cells is used as the input for CFD solver (CFX).
4. From the post processing, eddies and mass fraction of air flow is obtained.
5. Finally the steady state simulation results are compared with experimentally investigated engine test rig data.
3D Model of Inlet Manifold
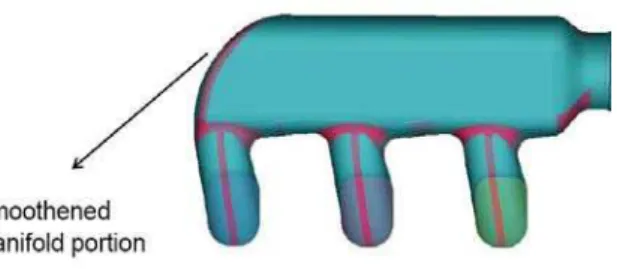
During the 3D model development for intake manifold, plenum and runner volume should be taken into account based on turbocharger or naturally aspirated engine requirement. Optimum engine cylinder charging is achieved by proper breathing of an engine and this depends on IM design. Fig 1 shows initial (stage-I) manifold design without flow optimization.. Fig 2 shows optimized manifold (stage-II) and this is developed based on simulation results and experimental investigation.
Intake Runner 1 1.13 1.135 1.14 1.145 1.15 1.155 1.16 1.165 1.17 1.175 1.18 1.185 P res s ur e( bar )
0 90 180 270 360 450 540 630 720
CRANKANGLE(deg)
Pr@40mm(bar) 4. Results & Discussions
4.1 Analysis for inlet manifold (stage-I) using 1D- AVL Boost
From the 1D AVL BOOST software, variation of pressure pulses with various crank angles is obtained for all the three runners at different engine speed conditions are shown below.
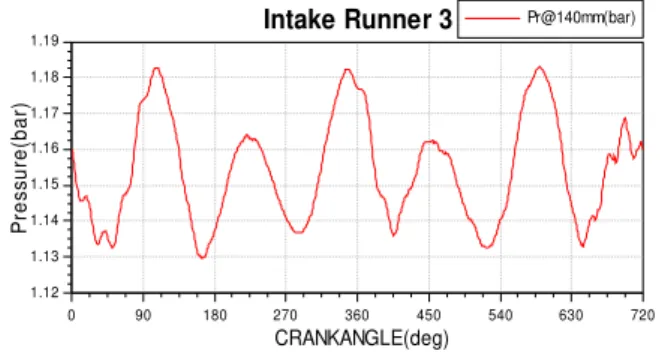
Fig 3, 4 shows formation of pressure waves is almost smooth. Fig 5 shows pressure variation is more due to sudden increase in the velocity of incoming air. Therefore IM geometry near the corners should be made smooth to avoid sudden increase in the pressure waves.
Fig 3. Pressure wave simulation before flow optimization using AVL Boost for 1100 rpm; runner-I
Intake Runner 2
1.13 1.14 1.15 1.16 1.17 1.18 1.19 P re s s u re (ba r)
0 90 180 270 360 450 540 630 720
CRANKANGLE(deg)
Pr@40mm(bar)
Fig 4. Pressure wave simulation before flow optimization using AVL Boost for 1100 rpm; runner-II
Intake Runner 3
1.12 1.13 1.14 1.15 1.16 1.17 1.18 1.19 P res s ur e( bar )
0 90 180 270 360 450 540 630 720
CRANKANGLE(deg)
Pr@140mm(bar)
Fig 5. Pressure wave simulation before flow optimization using AVL Boost for 1100 rpm; runner-III
Intake Runner 1
1.21 1.22 1.23 1.24 1.25 1.26 1.27 1.28 P res s u re( bar )
0 90 180 270 360 450 540 630 720
CRANKANGLE(deg)
Pr@40mm(bar)
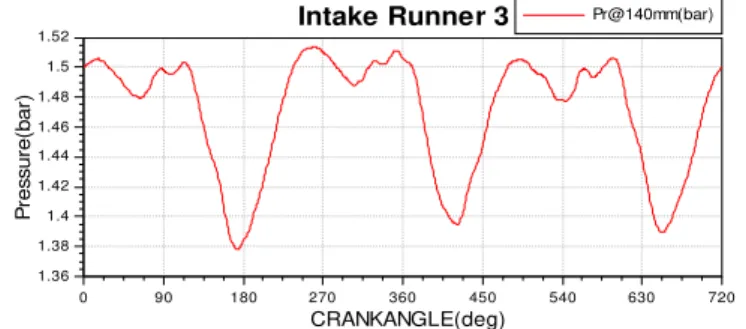
From the fig 6, 7& 8 pressure distributions are not smooth due to shock waves. Manifold profiles near the corners can be made smooth to avoid the reflecting shock waves with higher velocity as the engine speed increases to 1250rpm. More number of shock waves observed when compared with 1100 rpm results.
Intake Runner 3
1.12 1.13 1.14 1.15 1.16 1.17 1.18 1.19 P re s s u re(ba r)
0 90 180 270 360 450 540 630 720
CRANKANGLE(deg)
Pr@140mm(bar)
Fig 8.Pressure wave simulation before flow optimization using AVL Boost for 1250 rpm; Runner-III
Intake Runner 2
1.21 1.22 1.23 1.24 1.25 1.26 1.27 1.28 P re s s u re (b a r)
0 90 180 270 360 450 540 630 720
CRANKANGLE(deg)
Pr@40mm(bar)
Fig 7.Pressure wave simulation before flow optimization using AVL Boost for 1250 rpm; Runner-II
Intake Runner 1
1.38 1.4 1.42 1.44 1.46 1.48 1.5 1.52 P res s ur e( bar )
0 90 180 270 360 450 540 630 720
CRANKANGLE(deg)
Pr@40mm(bar)
Fig. 9.Pressure wave simulation before flow optimization using AVL Boost for 1500 rpm; Runner-I
Intake Runner 2
1.38 1.4 1.42 1.44 1.46 1.48 1.5 1.52 P re ssu re (b a r)
0 90 180 270 360 450 540 630 720
CRANKANGLE(deg)
Pr@40mm(bar)
Fig 9, 10 & 11 shows as the engine speed increases pressure reaches 1.51 bar max. But pressure waves found to be less when compared to previous engine speed.
Intake Runner 1
1.6 1.65 1.7 1.75 1.8 1.85 1.9 1.95 P res s ur e( bar )
0 90 180 270 360 450 540 630 720
CRANKANGLE(deg)
Pr@40mm(bar)
Fig 12. Pressure wave simulation before flow optimization using AVL Boost for 1750 rpm; Runner-I
Intake Runner 2
1.6 1.65 1.7 1.75 1.8 1.85 1.9 1.95 P res s ur e( bar )
0 90 180 270 360 450 540 630 720
CRANKANGLE(deg)
Pr@40mm(bar)
Fig 13. Pressure wave simulation before flow optimization using AVL Boost for 1750 rpm; Runner-II
From the fig 12, 13 & 14 as the engine speed is increased few shock waves only formed. But the pressure has increased to 1.9bar when compared to 1500rpm. Manifold profiles near the corners should be made smooth to avoid the reflecting shock waves as the engine speed increases1750 rpm.
Intake Runner 3
1.36 1.38 1.4 1.42 1.44 1.46 1.48 1.5 1.52 P res s ur e( b ar )
0 90 180 270 360 450 540 630 720
CRANKANGLE(deg)
Pr@140mm(bar)
Fig 11.Pressure wave simulation before flow optimization using AVL Boost for 1500 rpm; Runner-III
Intake Runner 3
1.6 1.65 1.7 1.75 1.8 1.85 1.9 1.95 P ressu re (b a r)
0 90 180 270 360 450 540 630 720
CRANKANGLE(deg)
Pr@140mm(bar)
Intake Runner 3
1.8 1.85 1.9 1.95 2 2.05 2.1 2.15 2.2 2.25
P
res
s
ure(
bar)
0 90 180 270 360 450 540 630 720
CRANKANGLE(deg)
Pr@140mm(bar) Intake Runner 1
1.8 1.85 1.9 1.95 2 2.05 2.1 2.15 2.2 2.25
P
res
s
ur
e(
bar
)
0 90 180 270 360 450 540 630 720
CRANKANGLE(deg)
Pr@40mm(bar)
Fig 15. Pressure wave simulation before flow optimization using AVL Boost for 2000rpm; Runner-I
Intake Runner 2
1.8 1.85 1.9 1.95 2 2.05 2.1 2.15 2.2 2.25
P
ress
ur
e(
bar
)
0 90 180 270 360 450 540 630 720
CRANKANGLE(deg)
Pr@40mm(bar)
Fig 16.Pressure wave simulation before flow optimization using AVL Boost for 2000 rpm; Runner-II
Fig 17. Pressure wave simulation before flow optimization using AVL Boost for 2000 rpm; Runner-III
5.1 Analysis for inlet manifold (stage- & II) using 3D- CFD (CFX)
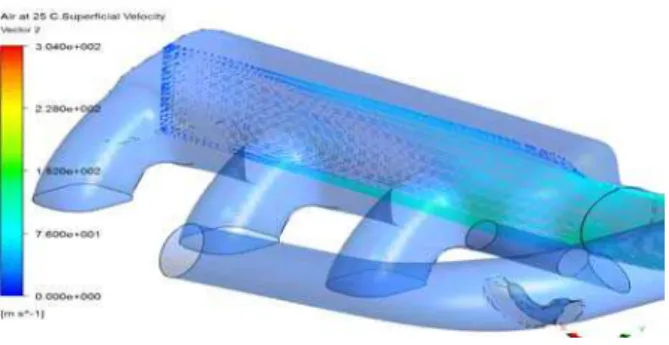
CFD analysis is carried out to investigate the flow characteristics inside the initial & optimized IM.CFD optimization for intake manifold provided uniform flow distribution in all runners.
From the fig 18, during second cylinder opening, some amount of air is trying to enter into first and third cylinder due to eddies. Fig 19 shows flow reversals are present in the plenum, which is the reason for causing an improper distribution of air to all the runners in the initial IM design.
Fig 19. Regions of flow reversal inside the initial IM Fig 18. Streamline velocity contour of air inside the initial IM for runner-II- open
condition at 1800 rpm
From fig 20, 21 the flow of air to the second runner can be observed and it can be seen that the amount of eddies in the optimized intake manifold are reduced which helps in obtaining uniform flow to all the three runners.
5.2 Experimental Investigation for (stage- & II Inlet manifold)
Based on the above CFD analysis, optimized IM is developed and it is tested on the engine to find pressure distribution inside the runners for both IM design. Further smoke level is investigated for part load conditions.
From the fig 22 it was observed that the pressure distribution was not uniform for all the three runners which indicate non uniform flow distribution. But after optimization of the manifold the variations are reduced and almost uniform amount of air is entering the runners.
Fig 21: Regions of flow reversal inside the optimized IM
Fig 22. Runner pressure inside the manifold
From the fig 23 the smoke level (stage-II with EGR) is found to low with optimized manifold when compared with initial manifold (stage-I with EGR). Since the smoke level is low, it indicates that EGR and air mixing take place in proper mode.
Conclusion
From the AVL BOOST software the sudden increase in pressure waves are observed with initial manifold design. The initial intake manifold is not able to provide uniform distribution of air to all the cylinders. Due to this performance of the engine is poor. This is observed by an increase in the smoke level. Therefore the initial IM is optimized for uniform flow, by using CFD software. From the CFD results, 76% mass fraction of air is observed for all the three runners at 1800 rpm. Further experimentally air pressure inside the runners are investigated and increased air pressure of 13% shows that flow of air has increased inside the runner for the optimized IM design. The reduced smoke level indicates better air and EGR mixing inside the engine using optimized manifold (stage-II).
Reference
[1] Safari, M., Nasiritosi, A., Ghamari, M. “Intake Manifold Optimization by using 3D- CFD Analysis,” SAE paper 2003-32-0073, 2003 [2] Wangner Trindade. “Use of 1D-3D Coupled Simulation to Develop a Intake Manifold System,” SAE paper 2010-01-1534
[3] Marcelo R. C., Thomas M.M., “Correlation between Numeric Simulation and Experimental Results on Intake Manifold Development,” SAE paper 2009-36-0274
[4] Negin M., Reza E., Siamac H., “The Effect of Intake Manifold Runners Length on the Volumetric Efficiency by 3-D CFD Model,” SAE paper 2006-32-0118
[5] M. Safari., “Intake Manifold Optimization by Using 3-D CFD Analysis.,” SAE paper 2003-32-0073