Abstract—This study comprises finite element simulations and experimental studies of the shape memory effect due to the presence of SMA (shape memory alloy) wires in composite materials. FEA was performed using ANSYS, where the prestrain was modelled by equivalent changes in the expansion coefficient of the SMA. Three case-studies were simulated and their predictions were compared with experimental data: (a) the heating of a prestrained SMA ribbon in epoxy; (b) the heating of a 4 ply 0o/90o/0o/90o fibre composite (without SMA wires), which causes deflection due to the difference in the expansion coefficients of matrix and fibres and (c) the heating of a 4 ply 0o/90o/0o/90o fibre composite with SMA wires, which included the synergy of the shape memory effects of the matrix/fibre system and SMA wires.
Index Terms—adaptive, composites, shape memory effect, SMA
I. INTRODUCTION
Shape memory alloys (SMAs) have the ability to return to a predetermined shape when heated past the martensitic transformation, with the potential of reversible strains of several percent, generation of high recovery stresses and high power/weight ratios. The integration of thin SMA wires in fibre reinforced composite materials leads to so-called adaptive composite materials. Such SMA composites can be used to actively control elastic modulus, internal stress state and natural vibration frequencies in the case of hard matrices and change shape in the case of soft matrices [1,2].
II. FEA SIMULATION OF THE SHAPE MEMORY EFFECT OF AN SMA RIBBON EMBEDDED IN EPOXY The interaction between the embedded SMA and the host material is critical since most applications require transfer of load or strain from the wire to the host. In addition, the host material may have a pronounced effect on the local stress state
Manuscript received March 20, 2007
All authors: School of Engineering, University of Surrey, Guildford, Surrey GU2 7XH, UK
and consequently the transformation behaviour of the embedded SMA wires. This case-study is based on the experiments of Jonnalagadda et al [3] who measured the stress distribution during the SMA transformation by using the photoelastic technique.
In the fabrication stage, they embedded a single NiTi ribbon of 1.22 mm width and 0.3 mm thickness in an epoxy matrix which cured at room temperature. The ribbon was annealed at 600° C and then sandblasted in order to maximize the adhesion with the matrix. Before it was embedded into the epoxy, a uniform 1 % strain was applied on it. The main problem seemed to be debonding where, even with careful sample preparation, small debonds of approximately 1 mm in length formed at the right and left edges of the sample where the ribbon emerged from the polymer block.
The current study, first involved the construction of the 3-D model of the experimental case, using ANSYS. It included two types of materials, the EPON 828 epoxy matrix and the SMA NiTi ribbon and the data for their properties are presented in Table 1. The disadvantage of using this epoxy was that the room temperature cure epoxies have low glass transition temperature (Tg) and for this reason the heating cycle was stopped at 45° C, although the austenite finish temperature (Af = 57° C) of the ribbon is higher than the Tg of the epoxy. The experiment started at 25 °C at which the NiTi ribbon was in martensite state until 35 °C, then the phase transformation started from 36 °C (As) and the experiment stopped at 45 °C. The Young’s modulus of the ribbon was calculated from linear interpolation in the transition between martensitic to austenitic phases. During the experimental procedure, in order to heat up the ribbon, the exposed edges of the ribbon were connected to a power supply and heated resistively with a current of 1.55 A, which generated a steady state temperature of 45 °C inside the ribbon in approximately 200 seconds.
FEA and Experimental Studies of Adaptive
Composite Materials with SMA Wires
Table 1 Material Properties of EPON 828 Epoxy Matrix and NiTi, where E is the Young’s modulus, ν is the Poisson’s
ratio, α is the thermal expansion coefficient, Κ is the thermal conductivity, ρ is the density of the material, Tg is the glass transition temperature and cp is the specific heat capacity of the material, As is the Austenite start Temperature, Af is the Austenite finish Temperature, Ms is the start Temperature of the Martensite phase and Mf is the end Temperature of the Martensite phase.
Property Epoxy EPON
828
NiTi Austenit
e
NiTi Martensite
E(GPa) 2.5 49 10.9
Ν 0.33 0.3 0.3
α (x 10-6
K-1) 57.0 12 12
K (W/m°C) 0.18 18 8.5
ρ (kg/m3) 1350 6450 6450
Tg (oC) 56 - -
Af (°C) - - 57
As (°C) - - 35
Ms (°C) - 21 -
Mf (°C) - -12 -
cp (J/kg K) 1050 322 322
The FEA simulations consisted of a sequence of transient thermal and structural analyses using ANSYS. In the former, it was assumed that the temperature inside the ribbon was increasing at 1 °C/min. The solid, brick, 20 node elements SOLID90 and SOLID95 were selected for the thermal and structural analysis, respectively. The most difficult part of the structural analysis was to import into the ANSYS software the 1 % pre-strain that the ribbon had. Fig.1 presents a stress-strain graph, including the prestraining stage. This involves an initial application of stress on the martensitic phase at room temperature, exceeding the yield stress. Upon release of the stress, some of the strain is recovered but the plastic strain, εo = 0.01, remains.
Fig. 1 Stress-strain graph for the prestraining stage
From the graph in Fig. 1 and given that ANSYS was not able to incorporate initial strain conditions, an equation for the total strain was generated:
εTOT = εANSYS + εο (1)
The equation for the total stress is:
σ = ΕεANSYS + E εο (2)
If it is assumed that the initial stress is equal to zero and equation 2 is interpolated for εANSYS between the two phases (Martensite and Austenite), it yields
εANSYS =
(
)
(
57 35)
35 −
− × ⎟⎟ ⎠ ⎞ ⎜⎜
⎝ ⎛
−
− T
E E
E
Mart Aust
o Austε σ
σ
(3)
Equation 3 produces an equivalent expansion coefficient (negative as it really represents shrinkage), which is related to the shape memory effect between 35 and 57 °C and is given by αx = ε + 12 x 10-6 (4) The results of the equivalent expansion coefficient for the NiTi ribbon between the two phases are presented in Table 2. The fact that the expansion coefficient, α, now incorporates the prestraining effect, effectively makes α anisotropic, depending on the prestrain direction.
Table 2. Expansion coefficient of prestrained NiTi ribbon used in the ANSYS simulations for the first case-study.
Temp. °C αx αy αz
35 12 x 10-6 12 x 10-6 12 x 10-6 36 -4.38 x 10⁻⁴ 12 x 10-6 12 x 10-6 37 -8.98 x 10⁻⁴ 12 x 10-6 12 x 10-6 38 -1.348 x 10⁻³ 12 x 10-6 12 x 10-6 39 -1.808 x 10⁻³ 12 x 10-6 12 x 10-6 40 -2.258 x 10⁻³ 12 x 10-6 12 x 10-6 41 -2.718 x 10⁻³ 12 x 10-6 12 x 10-6
The change of the expansion coefficient αx stops at 41 °C, because the aim of the 1% strain in the ribbon was achieved, so from 41 °C to 45 °C it is again 12 x 10-6 for all axes.
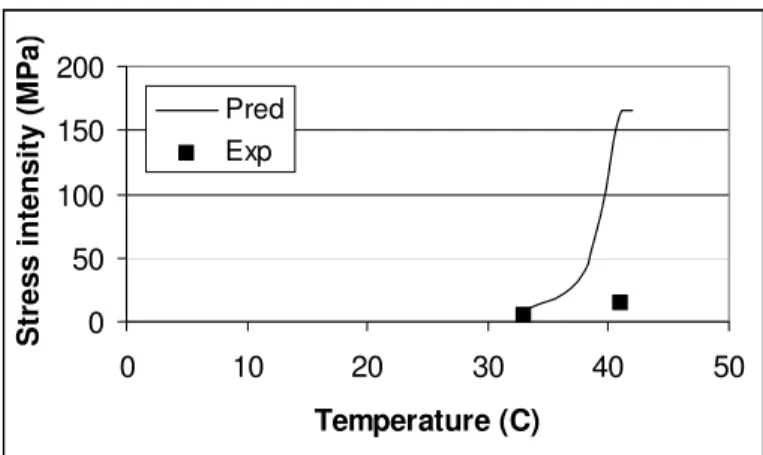
1200 sec and it was carried out in 20 steps. The air around the plate was maintained at 25 oC while a heat transfer coefficient was assigned between the epoxy block and the air. The thermal analysis was followed by a transient structural analysis. Fig.2 displays the stress intensity (SINT) results according to the Tresca Failure Criterion for multi-axial stresses at the final step of the structural thermal analysis. At this stage the ribbon has reached 45 °C and the maximum stress intensity in the center of the ribbon is 168 MPa. The stress intensity seems to be maximum in the central region of the ribbon as expected from the experimental data.
Fig.2 Predictions of the stress intensity at the final step of the thermal-structural analysis
Fig.3 presents the corresponding graph of predicted maximum stress intensity as a function of temperature in the SMA ribbon as well as the comparison with the experiment. The experimental data [3] have only two contours for the intensity stress at 5.2 MPa and at 15.6 MPa during the first 240 seconds of the experiment. In the postprocessing of the results in ANSYS a whole range of contours was obtained from which the maximum value is presented in Fig.3. In general, it can be seen that it compares well with the experimental data at 33 oC, but the predicted stress intensity values thereafter are much larger that the experimental data. This could be attributed to the fact that the FEA analysis did not take into account any debonding between the SMA ribbon and the epoxy matrix, whereas Jonnalagadda et al [3] reported that in their experiment they observed small debonds of approximately 1 mm in length at the edges of the sample that would have lowered the value of the principal stress difference.
0 50 100 150 200
0 10 20 30 40 50
Temperature (C)
Stress intensity (MPa
)
Pred Exp
Fig.3 Structural analysis results of maximum stress intensity as a function of temperature in the SMA ribbon
III. FEA SIMULATIONS AND EXPERIMENTAL STUDIES OF THE SHAPE MEMORY EFFECT IN A MULTILAYER FIBRE COMPOSITE LAMINATE WITH AND WITHOUT
SMA WIRES
First of all, the shape memory effect induced by the residual thermal stresses in the plies of multilayer fibre composite laminates was studied, before any SMA wires were introduced. In general in composites, the thermal expansion coefficient of the fibres is smaller than that of the matrix causing differential expansion in multilayer laminates with the different layers oriented in different directions, which ultimately causes warpage in the laminate. This warpage could also be used as a shape memory effect and its magnitude will be investigated in this study.
The model laminate consisted of a glass fibre/polyester resin 0°/90°/0°/90° composite with or without SMA wires. This analysis was separated into two, one without SMA wires and one with SMA wires, in order to see the difference between the shape memory effect due to the multiple fibre orientation in the asymmetric laminate and that due to the SMA wires. The FEA analysis was coupled with a corresponding experimental study. The laminate consisted of 4 plies of 0.35 mm thickness for each ply and a fibre volume fraction, Vf = 0.40. Table 3 presents the properties of the matrix and fibre materials.
Table 3Properties of E-glass fibre and Crystic 2-406Pa, where ρ is the density, cp is the specific heat capacity, K is the thermal conductivity, ν is the Poison’s ratio, α is the expansion coefficient and E is the Young’s Modulus.
Property E-glass fibre Crystic 2-406Pa
ρ (kg/m3
) 2450 1200
cp (J/kg K) 800 1200
K (W/m K) 1.04 0.2
ν 0.2 0.33
E (GPa) 75 3
parallel to the fibres, Young’s modulus parallel to the fibres and ν. For heat conduction in the direction perpendicular to the fibres, the situation is more complicated since the thermal conductivity then depends on the fibre arrangement which may be considered as square or hexagonal, for example. For parallel fibres in a square array, the composite thermal conductivity perpendicular to the fibres is given by [4]:
f V ) m K f K ( ) m K f K ( f V ) m K f K ( ) m K f K ( m K K − − + − + + =
⊥ (5)
The Young’s Modulus of the composite in the direction perpendicular to the fibres is given by
(
)
1 m E f V 1 f E f V E − ⎥ ⎦ ⎤ ⎢ ⎣ ⎡ − + =⊥ (6)
The expansion coefficient parallel and perpendicular to the fibre direction, is given by the relations
II E f V m E m f V f E f II ) 1 ( − +
=α α
α (7)
ν
α
α
ν
α
ν
α
⊥ =Vf(1+ f) f +(1−Vf)(1+ m) m − II (8)A transient thermal and structural analysis (in sequential form) was applied to the 4-crossply laminate. The temperature was raised from 25 oC to 80 oC at 1 oC/min in 55 steps for a total of 110 min. Predictions were needed at 26, 35, 55, 75 and 80°C to compare with the experimental data at these temperatures, and hence the appropriate predictions were estimated by linear interpolation between the closest corresponding steps. Fig.4 presents the deflection in the y direction as predicted by ANSYS at 26 °C, which shows that the maximum deflection occurs at the centre of the composite beam.
Fig.5 presents a plot of predictions of this maximum central y-deflection as a function of temperature, corresponding to different time-steps in the structural analysis by ANSYS. As the multiplayer laminate is heated, its matrix expands, which affects mainly the 90 o plies, and causes bending of the laminate. The predicted values of maximum deflection increase almost linearly up to 70 oC. The experimental data follow the same trend where there is a predicted maximum displacement of 0.8 mm at 70 oC against a maximum experimental displacement of 0.756 mm, which is very close to the prediction within the expected experimental error. The deformation in the y-direction is reversed in the experimental results after a maximum at 65 oC.
Fig.4 Deflected composite beam (without SMA wires) as predicted by ANSYS at 26 oC.
0 0.2 0.4 0.6 0.8 1
0 20 40 60 80 100
Temperature (C)
Max d
isp
lacemen
t (mm) Exp.
Pred.
Fig.5 Maximum central displacement of the 4 ply 0o/90o/0o/90o fibre composite (without SMA wires), as predicted by ANSYS
and experimental data during the heating cycle The shape memory effect due to different fibre orientations in the multilayer fibre composite is of the order of 1 mm deflection for the studied composite beam and for the polyester matrix. It is expected to be smaller in an epoxy matrix composite beam, due to the much lower thermal expansion coefficient of epoxy.
Fig.6. 3-D ANSYS model of the 4 ply 0o/90o/0o/90o fibre composite with 5 SMA wires.
From the previous analysis of the 4 ply fibre composite (without wires), it was concluded that when the laminate was heated externally at 0.5 oC/min, the temperature reached this value homogeneously throughout the laminate at the end of each step, so this temperature rise (from 25 oC to 80 oC at 0.5 o
C/min) was applied as thermal condition in the present case-study for the transient structural analysis, without subjecting the model to a thermal analysis.
The material properties for each composite ply were set up as in the previous case study and the properties for the SMA NiTi wires as in section II, where a 3% pre-strain was applied. The FEA model (see Fig.6) used SMA wires of cuboid shape to be able to construct a mesh which would be compatible with the rest of the geometry. Also, an 8 node, solid brick element, SOLID45, was used instead of the 20 node brick element, to reduce computer memory requirements, which were enormous due to the small diameter of wires. A transient structural analysis was performed using ANSYS in the temperature range of 25 to 45 oC, similarly to the first case-study with the SMA ribbon.
Fig.7 illustrates the experimental results where the composite beam already has a certain degree of bending (warpage from the manufacturing stage) before the heating cycle starts. As the temperature was increased the initial displacement of the specimen was reduced due to the matrix expansion in the 90 o plies. At the same time, the shrinkage of SMA wires starts at 35 o
C and contributes to flattening the specimen earlier (at 43 oC) than in the case without the SMA wires. Then the specimen curved in the inverse direction, reaching a maximum at about 45 °C. Thereafter, the specimen reversed back to its original position and continued bending in this manner due to the shrinkage of the SMA wires as they recovered their original dimensions.
-0.4 -0.2 0 0.2 0.4 0.6 0.8 1
0 50 100
Temperature (C)
D
is
p
la
cemen
t (
m
m)
Fig.7 Experimental results of maximum central beam displacement in the y direction during heating of the 4 ply 0o/90o/0o/90o fibre composite with the SMA wires from 25 to
80o C.
0 0.02 0.04 0.06 0.08 0.1 0.12 0.14
0 10 20 30 40 50
Temperature (C)
Max displacement (mm)
Fig.8 Maximum central displacement of the 4 ply 0o/90o/0o/90o fibre composite with the SMA wires, as predicted by ANSYS
Fig.8 displays the predictions by ANSYS; in this there is an initial bending of the beam up to a maximum displacement of 0.13 mm at 35 oC, due to the matrix expansion in the 90o ply, although not as much as the fibre composite without the SMA wires (0.2 mm at 35 oC), due to the counteraction of the SMA wires, which start shrinking at 35 oC. The SMA wires continue shrinking in their shape memory recovery stage as the specimen is heated further, and as a result they completely balance the matrix expansion effect at 45 oC, leading to the flattening of the laminate beam.
IV. CONCLUSIONS
The technique of employing a varying expansion coefficient to simulate the effects of prestrain in SMA wires has been applied successfully in finite element analyses of the shape memory effect. The first case-study involved the shape memory effect of an SMA ribbon embedded in epoxy and demonstrated the problem of debonding between the SMA ribbon and the matrix, which was demonstrated by reduced stress intensity values. The second case-study involved SMA wires embedded in a 4 ply 0o/90o/0o/90o fibre-polyester composite in which the shape memory effect of the SMA wires with regards to strain was of similar order of magnitude as the warpage effect due to the multiple orientation of the fibre plies, in which case the two effects would either combine or counter balance each other. The shape memory effect of the SMA wires produced large stress intensity values, which means that these composites can be used as force or deflection actuators.
ACKNOWLEDGMENTS
The authors would like to acknowledge Dr S.L.Ogin for useful discussions.
REFERENCES
1. Balta J.A., Parlinska M, Michaud V., Gotthardt R., Manson J.-A.E Adaptive composites with embedded shape memory alloy wires, Proc. of the MRS Fall Meeting, Boston, 1999.
2. Friend C.M., Morgan N. The actuation response of model SMA hybrid laminates, J. de Physique, 1995, 5, C2 : 415-420
3. Jonnalagadda K.D., Sottos N.R., Qidwai M.A. and Lagoudas D.C. Transformation of embedded shape memory alloy ribbons, J. Intel. Mater. Sys. & Struct., 1998, 9(5): 379-390.