Translational Arrest Due to Cytoplasmic
Redox Stress Delays Adaptation to Growth on
Methanol and Heterologous Protein
Expression in a Typical Fed-Batch Culture of
Pichia pastoris
Bryn Edwards-Jones1, Rochelle Aw1, Geraint R. Barton1, Gregory D. Tredwell2, Jacob G. Bundy2, David J. Leak1,3*
1Department of Life Sciences, Faculty of Natural Sciences, Imperial College London, London, SW7 2AZ, United Kingdom,2Department of Surgery & Cancer, Faculty of Medicine, Imperial College London, London, SW7 2AZ, United Kingdom,3Department of Biology & Biochemistry, University of Bath, Claverton Down, Bath BA2 7AY, United Kingdom
*d.j.leak@bath.ac.uk
Abstract
Results
We have followed a typical fed-batch induction regime for heterologous protein production under the control of theAOX1promoter using both microarray and metabolomic analysis. The genetic constructs involved 1 and 3 copies of theTRY1gene, encoding human trypsino-gen. In small-scale laboratory cultures, expression of the 3 copy-number construct induced the unfolded protein response (UPR) sufficiently that titres of extracellular trypsinogen were lower in the 3-copy construct than with the 1-copy construct. In the fed-batch-culture, a similar pattern was observed, with higher expression from the 1-copy construct, but in this case there was no significant induction of UPR with the 3-copy strain. Analysis of the microarray and metabolomic information indicates that the 3-copy strain was undergoing cytoplasmic redox stress at the point of induction with methanol. In this Crabtree-negative yeast, this redox stress appeared to delay the adaptation to growth on methanol and supressed heterologous protein production, probably due to a block in translation.
Conclusion
Although redox imbalance as a result of artificially imposed hypoxia has previously been de-scribed, this is the first time that it has been characterised as a result of a transient metabolic imbalance and shown to involve a stress response which can lead to translational arrest. Without detailed analysis of the underlying processes it could easily have been mis-inter-preted as secretion stress, transmitted through the UPR.
OPEN ACCESS
Citation:Edwards-Jones B, Aw R, Barton GR, Tredwell GD, Bundy JG, Leak DJ (2015) Translational Arrest Due to Cytoplasmic Redox Stress Delays Adaptation to Growth on Methanol and Heterologous Protein Expression in a Typical Fed-Batch Culture ofPichia pastoris. PLoS ONE 10(3): e0119637. doi:10.1371/journal.pone.0119637
Academic Editor:Anil Kumar Tyagi, University of Delhi, INDIA
Received:May 15, 2014
Accepted:February 1, 2015
Published:March 18, 2015
Copyright:© 2015 Edwards-Jones et al. This is an open access article distributed under the terms of the Creative Commons Attribution License, which permits unrestricted use, distribution, and reproduction in any medium, provided the original author and source are credited.
Data Availability Statement:Microarray data are available in the ArrayExpress database (www.ebi.ac. uk/arrayexpress) under accession number E-MTAB-2530.
Funding:The authors are grateful to the
Introduction
The methylotrophic yeast,Pichia pastorisis a commonly used host for protein expression [1,2]. High volumetric productivities of both secreted and intracellular proteins can be pro-duced, largely because of the high cell densities achievable in fed-batch fermentation. Specific productivities, particularly of secreted proteins, are, in fact, relatively modest [3] because of the limited flux through the eukaryotic protein export system. However, as growth and induction is typically done in a minimal medium and the host strain naturally secretes very little protein, this protein is usually fairly pure.
Expression typically uses the very strong methanol-inducible alcohol oxidase promoter
AOX1which, in the parental strain, is capable of inducing alcohol oxidase production up to 30% of the total intracellular protein [1,4]. Genes to be expressed are chromosomally integrat-ed downstream ofAOX1by either recombination at a single site, generating a mut+(methanol utilisation positive) strain, in which a functional copy of theAOX1gene is retained, or transpla-cement, in which theAOX1gene is disrupted. This can yield a muts(slow) or mut-strain de-pending on the availability of a functionalAOX2gene which encodes a second alcohol oxidase with allows slow growth on methanol [5]. Production is usually done in fed-batch in which cells are grown to high densities using glycerol as the carbon source, induced initially with a pulse of methanol and then switched to a continuous methanol feed which may be maintained for up to 96h [1].
Despite the impressive track record of this expression system and occasional high titres re-corded, the levels of expression are relatively poor compared to the evident strength of the
AOX1promoter [1], and lengthy induction periods are needed to give good protein yields. With secreted proteins, which form the bulk of the examples in the literature, at least part of the problem has been ascribed to the effects of exceeding the secretory capacity of the cell [6,7]. The folding of secreted proteins in the ER is assisted by chaperones such as Kar2p and Pdi. High demand for Kar2p caused either by relatively high rates of transit or poor folding, as is frequently found with heterologous proteins, induces the unfolded protein response (UPR), which increases chaperone production [8]. However, exceeding the capacity of the UPR to ben-eficially affect secretion leads to increased ER associated degradation (ERAD) of the heterolo-gous protein, which can actually reduce secretion to levels below those achieved at moderate levels of expression [6].
One problem with theAOX1induction system is that, particularly in mut+ strains, induc-tion coincides with a major reorganisainduc-tion of metabolism, not only requiring novel catabolic functions for assimilation of formaldehyde, but a massive proliferation of peroxisomes [9] which are the location of alcohol oxidase and catalase (which breaks down the H2O2generated
by alcohol oxidase). Until the methanol metabolic machinery is in place and even beyond this point if cell proliferation continues, the production of peroxisomes in particular is likely to act as a drain on cellular resources. Recently, a few studies have compared the transcriptomes of recombinant (expressing) and non-recombinantP.pastoriscells sampled either at single time points after induction of expression [10] or grown in chemostat culture [11,12]. While the comparison is informative, the use of chemostat culture (primarily for better reproducibility of data) does not capture the dynamics of a typical industrial production process. Therefore, al-though the data obtained is inherently more noisy, in order to explore the events occurring during the early stages of induction both in wild type and recombinant strains we have fol-lowed a typical fed-batch induction regime using transcriptomic and metabolomic analyses. This was done using human trypsinogen as the recombinant protein as this has previously been characterised as producing copy-number dependent UPR and enhanced ERAD [6]. This
Diosynth Biotechnologies) CASE studentship support to RA. The funders had no role in study design, data collection and analysis, decision to publish, or preparation of the manuscript.
Competing Interests:Funding for this research was provided by BBSRC with guidance from the "Bioprocessing Research Industry Club" (BRIC). BRIC is an umbrella organisation founded by member companies in order to target research funding into critical aspects of (biopharmaceutical) bioprocessing. None of the BRIC member companies have any vested interest in the contents of this manuscript and it has been approved by BRIC for publication. RA received partial funding for her PhD studies from Avecia Biologics (now Fujifilm Diosynth
facilitated both a progressive time course analysis for each strain and side by side comparisons between wild-type and recombinant strains at the same times post-induction.
Materials and Methods
Strain construction
P.pastorisGS115 (HIS4-91), recently reclassified asKomagataella phaffii[13], was obtained from Invitrogen, Paisley, UK. A 5’truncated gene encoding 722bp of the human trypsinogen-1 gene (TRY1) starting at base 63 of the coding region after the signal peptide sequence and flanked by SfiI sites, was synthesized by Genscript (Piscataway, NJ, USA) and supplied in pUC57.TRY1was released from pUC57 with SfiI, gel purified and inserted into the SfiI site of pPICzαB (Invitrogen) placing the gene in frame with theα-factor signal peptide in the vector. A stop codon had been inserted into the synthetic gene so that translation did not read through into the vectorHISandMYCtag sequences. Recombinants were initially selected inE coli
JM109 grown on LB containing 100μg ml−1Zeocin and authenticity confirmed by sequencing. For cloning intoP.pastoris, recombinant plasmid was isolated fromE coli, linearised by digestion with PmeI, which cuts in the 5’AOX1promoter region and electroporated intoP.pastorisGS115. Recombinant colonies were selected after 4 days incubation on YPD containing 100μg ml−1 Zeo-cin, grown on YPD plates without Zeocin then on YPD containing ZeoZeo-cin, to ensure that Zeocin resistance was not transient. The presence of a singleTRY1vector insert in selected clones was confirmed by Southern blotting of BamHI digested DNA separated on a 1% agarose gel, with a DIG labelledTRY1probe.
Two and threeTRY1gene copy recombinant strains were made using the BglII and BamHI sites which flanked the pPICzαBTRY1expression cassette (promoter, alpha factor signal pep-tide,TRY1and 3' UTR region). Thus, pPICzαBTRY1was digested with BglII and BamHI and the 2.5kb expression cassette fragment gel purified and ligated together in the absence of vector to form multimers. The ligation products were cut with BglII and BamHI to remove any“head to head”or“tail to tail”fragments and products of sizes consistent with containing 2 and 3 cop-ies of theTRY1cassette were separated on a 1% agarose gel and purified. Individual purified products were then ligated into BglII and BamHI digested pPICzαB, before transformation intoE coli. Confirmation of vector construction was done by restriction digestion with BglII and BamHI to release the vector backbone andTRY1expression cassettes. The 2 and 3 copy TYRY1 expression vectors were introduced intoP.pastorisGS115 as described above and con-firmed by Southern blotting with a DIG labelledTRY1probe.
Expression in tubes
Single colonies were inoculated into 5 mL of BMGY (1% (w/v) Yeast Extract, 2% (w/v) Pep-tone, 100mM potassium phosphate, pH6.0, 1.34% (w/v) Yeast Nitrogen Base (YNB), 4 x 10⁻⁵% (w/v) d-Biotin, 1% (v/v) glycerol) in 50ml centrifuge tubes and grown at 30°C, 250 rpm for 24 hours, with the tube lid loosely attached for gas exchange. The OD600 was measured and cul-tures normalised by taking a volume of cells equivalent to that contained in 5 ml of OD600 10. Cells were centrifuged for 5 minutes at 4000 rpm at room temperature and the supernatant re-moved. The cultures were then resuspended in methanol containing BMMY (as BMGY but with 0.5% (v/v) methanol replacing glycerol) and left to grow for a further 24 hours.
Fed-batch culture
in fed-batch culture and each strain was grown in duplicate. The initial glycerol batch phase was performed in basal salts medium, which was inoculated from a 30 ml overnight YPD culture. Upon depletion of the glycerol a 50% v/v glycerol feed was initiated at 0.06 L/hr until the culture reached OD60080 which triggered the end of the glycerol feed and a 0.5% v/v bolus addition of
methanol. The methanol feed was controlled by a Raven methanol probe (Raven Biotech Inc, Canada) which maintained the methanol concentration at 0.5% and was maintained for 24hrs after the bolus addition.
Media
Basal salt medium contained per litre: 9 ml phosphoric acid (85%), 0.2 g CaSO4, 6 g K2SO4,
4.7 g MgSO4.7H2O, 7.5 g KOH, 5 g (NH4)2SO4, 20 ml glycerol, 1 ml Acepol-83E (10%
solu-tion), 3 ml PTM4, 20 ml 2% w/v histidine. The basal media was heat sterilisedin situand the PTM4 and histidine added as a post sterile addition. PTM4 Trace Elements Solution contained per litre 2 g CuSO4.5H2O, 0.08 g NaI, 3 g MnSO4.4H2O, 0.2 g Na2MoO4.2H2O, 0.02 g boric
acid, 0.5 g CaSO4.2H2O, 0.5 g CoCl2, 7 g ZnCl2, 22 g FeSO4.7H2O, 0.2 g biotin, and 1ml
con-centrated sulphuric acid. On starting the glycerol feed the medium was supplemented with (per L) 2.5 ml 2% w/v histidine and 1 ml PTM4. The methanol feed bottle contained 400ml methanol and 4.8ml of PTM4. pH was controlled at pH5 with 28% (w/v) ammonium hydrox-ide, stirrer speed at 1000rpm and dissolved oxygen tension at 35% using air mass flow control from 1.3L/min to 8L/min.
Sampling
The fed-batch culture was sampled at 0h (pre-induction), 0.5h, 1h, 2h, 3h, 4h, 5h, 7h and 24h post-introduction of the methanol feed. All samples were used for metabolomics analysis, but only samples taken at 0h, 2h, 4h and (TRY1-1 strains only) 24h were used for microarray anal-ysis. Time zero sample was taken before the glycerol feed was stopped and immediately before the addition of methanol.
For transcriptome analysis 1ml of culture was added to 9 ml RNA-later (Ambion) in order to stabilise the transcripts. This mixture was then centrifuged at 4000 rpm (Eppendorf 5810R) for 5 mins and the pellets re-suspended in 1 ml RNA-later and stored at−80°C until required.
Sampling from the bioreactor for metabolomics samples was performed as previously de-scribed, using a total culture extraction [14]. Briefly, a cell suspension (*2 ml) from the
biore-actor was sampled rapidly (under reduced pressure) into a cold (<−50°C) aqueous methanol
(60% v/v final conc., 13 ml). The solutions were mixed thoroughly and frozen in liquid nitro-gen. The sample was then thawed in an ultrasonic bath for 15 min and centrifuged for 5 min at 5000 g. The extract supernatant was concentrated under reduced pressure and samples were stored at−80°C until analysis. At the same sampling time 1 ml of the cell suspension from the
bioreactor was sampled into a 1.5ml centrifuge tube to collect the extracellular metabolites. The sample was immediately centrifuged for 5 min at 16000 g and the supernatants were trans-ferred to a new tube, concentrated under reduced pressure and stored at−80°C until analysis.
NMR analysis
sequence was used for water suppression; data were acquired into 64 K data points over a spec-tral width of 12 KHz, with 8 dummy scans and 512 scans per sample. In addition, 2D1H-1H COSY were acquired. Data were acquired into 512 × 4096 data points covering 6 × 6 KHz, with 3 scans for each increment.
Spectra were processed in iNMR 2.6.3 (Nucleomatica, Molfetta, Italy). Fourier transform of the free-induction decay was applied with a line broadening of 0.5 Hz. Spectra were manually phased and automated first order baseline correction was applied. Metabolite assignments were based on Tredwell et al [14]. Metabolite concentrations from 2D spectra, relative to the internal standard TSP were calculated using rNMR [16], and data were normalised by the probabilistic quotient normalisation method described by Dieterle et al [17].
Array design
An Agilent (Agilent, Santa Clara) 4 × 44,000 probe custom microarray was designed by Oxford Genome Technologies (OGT, Oxford, UK) based on the Integrated GenomicsP.pastoris
GS115 genome, which contained 5195 open reading frames (ORFs). Where possible, 9 non-overlapping probes per ORF were designed, taking into account uniqueness, GC content, pre-dicted hybridisation conditions and minimizing G-spots [18], seeTable 1for summary of the number of probes per gene. In the cases where only a single unique probe could be designed, further overlapping probes were designed. 5168 out of the 5195 ORFs had at least one unique probe mapping to it. It was not possible to design at least one unique probe for 27 of the ORfs. Blasting all probes against the genome revealed 384 of the designed probes had the potential to cross hybridise. These probes have been highlighted with an‘ortho’appended to the identifier. The array includes positive spike-in control probes and negative probes. In total 39,412 probes were designed.
Subsequent to the design of the array presented here, De Schutteret al[19] published a ver-sion of theP.pastorisgenome. A comparative analysis was performed to determine how well the probes from this array matched the De Schutter genome using Blast. Out of the 39,412 probes, 38,552 (97.8%) mapped to one position, 845 (2.1%) did not map anywhere, and 15 (0.04%) mapped at two or more loci.
Table 1. The number of unique probes on the micro-array per gene.
Number of Genes Number of Probes Avg. Gene Length
78 1 158
183 2 224
197 3 329
210 4 430
281 5 519
275 6 615
275 7 712
298 8 808
3371 9 1844
A total of 3371 genes were targeted by 9 unique probes, with the average length of these genes being 1844 bases.
Sample processing for microarray analysis
RNA was prepared using RiboPure Yeast RNA kit (Ambion) according to the manufacturer’s in-structions using 200μl of the stored sample. The samples were treated with the supplied DNAse and the absence of genomic DNA was confirmed by qPCR using primers toACT1and the 2X SYBR Green JumpStart Taq Ready Mix (Qiagen, Crawley, UK) qPCR kit. RNA quantity and quality was assessed using the Bio-Rad Experion system and the Stdsens kit. RNA of>200μg/ml,
RQI of>7 and OD260/280ratio>1.8 and OD260/230ratio>1.5 were submitted for transcriptomic
analysis.
Analysis of microarray data
Microarray data are available in the ArrayExpress database (www.ebi.ac.uk/arrayexpress) under accession number E-MTAB-2530. Analysis was carried out in the R programming lan-guage using Bioconductor package to identify differentially expressed genes. Each of the time point samples for a particular strain was contrasted to the time zero sample for that strain and, additionally, samples of theTRY1-3 andTRY1-1 strains taken at a fixed time point were con-trasted to each other and the non-recombinant GS115 in order to reveal any statistically signifi-cant differences. The Empirical Bayes method was applied to identify statistical significance in contrast between gene expression profiles [20]. The false discovery rate (fdr) based on Benja-mini and Hochberg’s method, which assumes that all genes are statistically different from one another was set to be less than 5% [21]. Gene functionality was assigned with reference to a cu-ratedP.pastorisgenome which can be viewed in a gBrowse [22] instance hosted by the Bioin-formatics Support Service, Imperial College London (www.blugen.org/gbrowse-bin/gbrowse/ Pichia/).
Heat Maps and Pathway Analysis
Heat maps of log 2 normalised expression levels were generated using the Heatplus.2 function from the R-bioconductor package. Genes with similar expression levels were clustered and pre-sented as trees, using the same package. Pathway analysis was also used to identify sequential metabolic processes, which were significantly up or down-regulated in accordance with the gene expression data. Initially significantly up- or down-regulated genes were run through KOBAS (KEGG Orthology Based Annotation System), which assigned genes to pathways based on the KEGG maps specifically forP.pastoris[23–25]. Once pathways had been identi-fied the KEGG Search & Colour pathway was used to visually map the differentially expressed genes [26,27]. Given the inherent noise in the system, discussion of regulation focuses on those pathways in which all/virtually all changes were in a consistent direction (up or down-regulation).
Results
Preliminary tests of genetic constructs
induction of UPR was also demonstrated by qRT-PCR ofHAC1expression [28] which was 3–4 fold higher in the 3 copy number strains than in 1 copy number strains) (S1).
Growth characteristics in fed-batch culture
GS115 and recombinant strains carrying 1 (TRY1-1) and 3 (TRY1-3) copies ofTRY1were grown in duplicate fed-batch cultures involving initial growth on glycerol to increase biomass, followed by a switch to methanol fed-batch growth, with methanol concentration measured with a dedicated probe and controlled at approximately 0.5% (v/v), throughout in order to avoid the metabolic stress that has been associated with high methanol concentrations [29]. Aeration was started at 1L/min and the dissolved oxygen concentration allowed to drop to 30% (saturation = 100%) where it was maintained by increasing the aeration rate. For GS115 this produced a biphasic growth profile with oxygen demand increasing rapidly after the addition of methanol to a maximum level between 3 and 7h after induction. The profile forTRY1-1 was characterised by a reduced rate of biomass increase in the second phase, after addition of meth-anol, whileTRY1-3 exhibited virtually no biomass increase for at least 24h after addition of methanol, although methanol metabolism was clearly occurring.
Samples for both microarray and metabolomic analysis were taken as described in methods. The time zero sample was taken prior to the addition of methanol, when cells were growing in fed-batch on limiting amounts of glycerol. The experimental design allowed insight into four underlying processes: 1) the changes occurring in GS115 during the switch from glycerol to methanol; 2) comparison betweenTRY1-1 and GS115 during induction of heterologous pro-tein expression; 3) the consequence of massive secretion stress on induction inTRY1-3, and 4) comparison ofTRY1-1 and GS115 pre-induction. In this paper we focus on the significant major processes and differences between constructs and time points. Additional information is provided as supplementary data.
Transcriptional and metabolomic profiles in methanol fed-batch culture
Characterisation of the underlying effect of growth rate changes. Even in the wild-type GS115 the switch from glycerol to methanol as the sole carbon substrate involves a reduction in growth rate, which was more marked in theTRY1-1 andTRY1-3 strains. InS.cerevisiae re-duction of growth rate has been shown to induce transcriptional responses similar to those in-duced by nutritional starvation [30]. This includes reduction in protein synthesis capability and DNA replication, and an increase in autophagy. Ribosome production has been estimated to use approx. 90% of the total cell energy in exponentially growing yeast [31] so it is not sur-prising that this is rapidly down-regulated in response to a reduction in growth rate. Binding sites for RNA polymerases I (A) and III (C) are upstream of ribosome biogenesis (Ribi) genes and the down-regulation of expression of these polymerases could partly account for reduced Ribi gene expression [32].
protein production there was little difference in the down-regulation in ribosomal protein pro-duction (S3 Fig.) and ribosomal biogenesis (S2 Fig.) betweenTRY1-1 and GS115, when the two were directly compared at 2h post-methanol addition. However, consistent with the complete cessation of growth, ribosomal protein gene expression inTRY1-3 was lower than bothTRY1 -1 and GS-1-15, 2h after methanol addition (S3 Fig.). The same pattern was also observed with nuclear pore transport and some translation initiation factors. This pattern of reduced expres-sion inTRY1-3 was similar after 4h, with ribosomal biogenesis and ribosomal protein synthesis being down-regulated in comparison toTRY1-1.
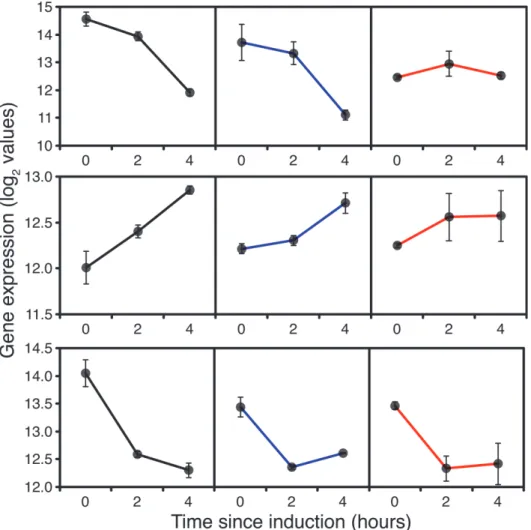
Surprisingly, in addition to the down-regulation of expression of RNA pol I and III sub-units, some RNA pol II core and specific subunits were down-regulated in all strains 2h after switching to methanol (S4 Fig.PAS_chr2-1_0125, chr4_0906, chr3_0244, chr1-4_0359), indi-cating a reduction in net protein synthesis. This is not typically linked to growth rate [33] but significant in the context of heterologous protein expression. However, by 4h expression of all RNA polymerase genes was starting to pick up in GS115, consistent with adaptation to a lower growth rate on methanol in GS115. Compared to their levels at 2h of induction many of the tRNA synthases were also up-regulated at 4h supporting the indication from pol II dynamics for a greater demand for net protein synthesis. However, inTRY1-3 in addition to reduction in expression of RNA polymerase I and III subunits, some core and specific RNA polymerase II subunits (Fig. 1) and tRNA synthases (S5 Fig.) remained down-regulated in comparison with
Fig 1. Expression of RNA polymerase I, II and III core function genes, 0 (before), 2 and 4 hours after the start of methanol addition to wild-type GS115 (black),TRY1-1(blue) andTRY1-3(red), strains containing 1 and 3 gene copies of the human typsinogen gene, respectively, under the control of the
AOX1promoter.From top to bottom, panels representRPA1,RPB2andRPC2. Error bars show SEM.
GS115 after 4h. Not only does this reflect the complete cessation of growth but a significant down-regulation of the potential forde-novoprotein synthesis.
Membrane remodelling. The switch to methylotrophy requires biogenesis of peroxi-somes; the location of the first steps in methanol oxidation. InS.cerevisiae PEX3andPEX19
are essential for early stage biogenesis [34], with Pex3p being secreted into the ER and together with Pex19p being critical for the formation of pre-peroxisomal vesicles [35]. This falls into 2 distinct families inS.cerevisiae, one containing the RING finger peroxisome membrane pro-teins (PMPs,) Pex2p, Pex10p and Pex12p, and the other docking PMPs, Pex13p and Pex14p, which are subsequently fused together through the action of Pex1p and Pex6p to form a func-tional translocon for matrix proteins, with translocation being aided by Pex5p. Expression of theP.pastorishomologues was strongly induced within 2h of methanol addition in GS115 (S6 Fig.PAS_chr4_0794, chr3_0043, chr4_0759, chr_1073, 1_0715, 2_0207, chr2-2_0186). The expression ofSEC61in GS115 was down-regulated within 2h of methanol addi-tion (S16 Fig.PAS_chr1-3_0202), which is surprising as the ER translocon formed by Sec61p has been shown to be essential for import of the peroxisomal membrane proteins into the ER. However, due to the transient and long term effects of switching to a poorer substrate peroxi-some biogenesis coincides with a starvation response typified by an increase in autophagy (S7 Fig.). Thus, reduction of expression ofSEC61has to be seen in the light of declining ER ca-pacity. Expression of genes associated with autophagy (S7 Fig.), proteasomal activity (S8 Fig.) and ubiquitin mediated proteolysis (S9 Fig.) were strongly induced in all three strains within the first 2 hours of methanol addition, consistent with a period of extensive membrane remod-elling, with some returning to near basal levels within 4h.
Energy metabolism and biosynthesis. On top of the expected induction of methanol utili-sation gene expression, the transient starvation response, evident from the effects on macro-molecule synthesis, was expected to have a significant effect on general energy metabolism. In GS115 and to a lesser extentTRY1-1, within the first 2 hours there was an increase in expres-sion of numerous respiratory chain components and the F-type ATPase (S10 Fig.), most of which returned to basal levels of expression after 4h. However, with TRY1-3, most genes re-tained their 2h expression levels or gradually increased in expression over 4h (eg succinate de-hydrogenase/fumarate reductase PAS_chr2−2_0283). Clearly, during this time cells were going
through a major reprogramming so, despite the reduction in growth rate, there was an in-creased energy demand from both methanol and endogenous energy sources. All of the key genes encoding steps in methanol metabolism and assimilation (e.g.AOX1, catalase,FDH,
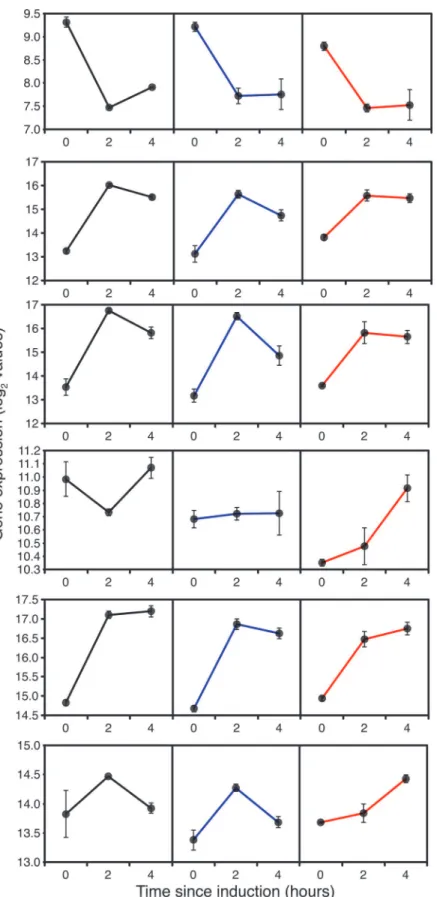
DAK2,TPI1) including riboflavin biosynthesis (RIB1) showed significant induction over the first 2 hours after methanol addition (Fig. 2) in all strains.AOX1expression increased 8 fold between t = 0 and t = 2h. AlthoughAOX1expression levels fell slightly between 2 and 4 hours, expression of most of the other genes was maintained at the 2h level indicating that cells should have adapted to growth on methanol by that point.
Fig 2. Expression of genes associated with methanol oxidation and assimilation during fed-batch culture, 0 (before), 2 and 4 hours after the start of methanol addition to wild-type GS115 (black), TRY1-1(blue) andTRY1-3(red), strains containing 1 and 3 gene copies of the human typsinogen gene, respectively, under the control of theAOX1promoter.From top to bottom, panels representAOX1,FDH1,
FGH1,DAS1,DAK2,TPI1andRIB1. Error bars show SEM.
Glycolysis/gluconeogenesis (S12 Fig.) and pentose phosphate (S13 Fig.) pathways displayed broadly the expected patterns, with upregulation of steps associated with the xylulose mono-phosphate pathway (XMP) and associated carbon skeleton rearrangements (eg PAS_chr2-2_0337 and PAS_chr3_0868). However, given that the cells were growing on glycerol and the output from the XMP is glyceraldehyde-3-phosphate, significant changes in hexose metabo-lism were not expected. Therefore, transient induction of hexokinase (PAS_chr1-4_0447, PAS_chr3_1192, PAS_chr4_0561 and PAS_chr4_0624), phosphoglucomutase (PAS_chr 1-4_0264), glucose-6-phosphate dehydrogenase (PAS_chr 2-1_0308) suggest that during adapta-tion to growth on methanol, metabolic reserves of glycogen, trehalose and cell wallβ,D glucans (see below) were being degraded. An additional feature was the induction of mitochondrial al-cohol (PAS_chr2–1_0472) and aldehyde dehydrogenases (PAS_chr2–2_0853 and
PAS_chr3_0987). The former could have been involved in redox shuttling across the mito-chondrial membrane [36], while the latter might be supplying acetate for histone acetylation which must have increased following the massive induction of the nuclear acetylCoA synthase 2 (PAS_chr3_0403)
Fig 3. Expression ofPCK1,PYCandPYKduring fed-batch culture, 0 (before), 2 and 4 hours after the start of methanol addition to wild-type GS115 (black),TRY1-1 (blue) andTRY1-3 (red).Error bars show SEM.
At a metabolomic level, induction of methanol oxidation was characterised by increased ex-tracellular production of 3-hydroxybutyrate and an inex-tracellular and exex-tracellular spike in for-mate (Fig. 4A), which were more pronounced in GS115 thanTRY1-1. As the former was not observed withTRY1-3, evidence that acetylCoA acetyltransferase activity was enhanced in GS115 compared to the recombinant may be significant. Because metabolite profiles may lag transcriptional induction, the formate spike is difficult to track but the increased expression of S-(hydroxymethyl)glutathione dehydrogenase and S-formyl glutathione hydrolase without in-creased formate dehydrogenase activity in the 0–2h and 0–4h post-induction profiles (results not shown) suggests that there may have been some imbalance. Taken together, these two pro-files suggest a possible redox imbalance in cells adapting to growth on methanol, inhibiting the induction of formate dehydrogenase and using acetoacetate as a redox sink.
However, this transcriptional and metabolomic pattern was different withTRY1-3 where, at 4h, glycolysis (S12andS15Figs.) and a classic TCA cycle (S11andS14Figs.) remained up-reg-ulated compared to GS115. This is consistent with the up-regulation of glycogen breakdown at both 2h and 4h inTRY1-3 (compared to GS115), suggesting greater starvation (lack of metha-nol derived energy). This pattern is also clear from aTRY1-3 time course where mobilisation of carbohydrate reserves was evident within 1h of induction. The first 4h of induction after meth-anol addition were characterised by a transient rise in extracellularα- and/orβ-D-glucose (the two mutarotate in solution) accumulation in all strains, but which was particularly pronounced inTRY1-3 (Fig. 4D).α-D-glucose production could reflect the breakdown of trehalose,β -D-glucose on the other hand would be derived fromβ-D-glucans present in the yeast cell wall, in-dicating an active breakdown process. Between 0 and 1h, the gene encodingβ,1,4-D glucanase was significantly induced, consistent with the latter, while at 2h the relevant (αandβ) hexoki-nases (PAS_chr1–4_0447, PAS_chr3_1192) were up-regulated inTRY1-3 compared to GS115, indicating that the cells were trying to actively scavenge and import this glucose.
By 4h, both GS115 andTRY1-1 were recovering from the initial shock of transfer from glyc-erol to methanol and tRNA synthases were up-regulated compared to their expression levels at 2h. Comparison withTRY1-3 shows that the tRNA synthases were neither significantly upre-gulated in a 0–4h time course comparison and were significantly down-reupre-gulated (or less up-regulated) in a 4h comparison betweenTRY1-3 and GS115 orTRY1-1. Thus, this recovery was happening much more slowly inTRY1-3, consistent with the delay in the characteristic spike in formate accumulation inTRY1-3 cultures (Fig. 4A).
Expression associated with heterologous protein production. InTRY1-1 andTRY1-3 the switch to methanol as a substrate induces heterologous protein production and, as revealed above, this is against a background of cells undergoing transient (in the case ofTRY1-1) or pro-longed starvation. A number of responses associated with the switch from glycerol to methanol could clearly have a significant effect on secretion. In particular, in GS115 there was an increase in expression of ER specific ubiquitin ligase (PAS_chr3_0924) and ER associated degradation (ERAD, PAS_chr1-1_0084), together with a decrease in the expression of some key ER associ-ated protein export proteins such as Sec61 (PAS_chr2-2_210, PAS_chr1-3_0202) and Hsp40 (S16 Fig.). Together with increased proteasomal activity and autophagy, this indicates that the switch to methanol utilisation actually results in degradation and recycling of some of the ER at a time when the demand for heterologous protein secretion is increasing.
Sec61 translocon (SEC61αandγ,SEC62andSEC63PAS_chr2–2_210, PAS_chr1-3_0202, PAS_chr3_1014), the ER Kar2p chaperone complex (KAR2/BiPPAS_chr2–1_0140,HSP40) and protein disulphide isomerase (PDIPAS_chr4_0844), both key components of the ER
Fig 4. Metabolite accumulation profiles during fed-batch culture from 0 (before) to 24 hours after the start of methanol addition to wild-type GS115 (black),TRY1-1(blue) andTRY1-3(red), strains containing 1 and 3 gene copies of the human typsinogen gene, respectively, under the control of the
AOX1promoter.From top to bottom, panels represent a) formate (external), b) arabitol (external), c) trehalose (external), d)α/β-D-glucose (external), e) lactate (internal). Error bars show SEM.
protein folding machinery, dolichyl-diphosphooligosaccharide-protein glycosyltransferase (STT), oligosaccharide transferase (OSTPAS_chr2–1_0423, PAS_chr3_0741,
PAS_chr4_0610), the glycoprotein chaperone calnexin (CNX) together withSEC23/24(COPII related). The ERAD pathway and proteasome biogenesis were not significantly different from GS115, although both of these pathways were up-regulated between 0 and 2h in GS115. Some heterologous protein expression and secretion related activities were clearly induced at time 0 (see below). Nonetheless, time course comparison ofTRY1-1 between 0 and 2h shows that
SEC61,OST,CNXandPDIwere also further up-regulated by induction ofTRY1-1 expression, compared to GS115; after 4h induction, the pattern was clearly retained, with no relative up-regulation of the ERAD pathway.
Induction of the unfolded protein response, characterised by increased expression of the chaperones Kar2p and Pdi is controlled by the production of Hac1p, the product of a spliced
HAC1mRNA. InP.pastoris, control of Hac1p expression appears to be via up-regulation of
HAC1expression rather than control of the splicing reaction [28] Consistent with this, the ex-pression ofHAC1increased approximately 5 fold in the first 2h of induction ofTRY1-1, where-as it barely changed in GS115 (Fig. 5). Significantly, the lack of further induction of ERAD suggests that, with a single copy ofTRY1, the increased traffic through the ER is managed adequately.
Based on the tube culture results we would have expected that the ER related chaperones would have been further up-regulated inTRY1-3 compared to the situation withTRY1-1 at 2h, and ERAD-related activities would also have been stimulated. Surprisingly, although both sets of activities were elevated compared to GS115 at the same time points, they were significantly lower than inTRY1-1. Significantly, this lack of induction of UPR inTRY1-3 correlated with a relatively minor increase in expression ofHAC1, compared to that observed withTRY1-1, indi-cating that the complete cessation of growth was not the result of secretion stress (Fig. 5). One of the few secretion related functions that was up-regulated inTRY1-3 compared toTRY1-1 wasGLCII, the product of which catalyses both glycosylation and deglycosylation, so could have a scavenging function.
Evidence of metabolic stress inTRY1-3. Even before detailed analysis of the microarray data it was clear thatTRY1-3 cells were behaving differently from both GS115 andTRY1-1 cells. Notably, the switch to methanol led to a complete cessation of growth for an extended pe-riod and the metabolomics profile showed an initial accumulation of extracellular arabitol, fol-lowed by trehalose accumulation (Fig. 4B,C), both signs of metabolic, particularly oxidative stress. Arabitol production derives from reduction of intermediates in the pentose phosphate pathway, such as xylulose or ribulose. The only gene directly identifiable as catalysing this
Fig 5. Expression ofHAC1during fed-batch culture, 0 (before), 2 and 4 hours after the start of methanol addition to wild-type GS115 (black),TRY1-1(blue) andTRY1-3(red), strains containing 1 and 3 gene copies of the human typsinogen gene, respectively, under the control of theAOX1promoter. Error bars show SEM.
function was "D-arabitol-2-dehydrogenase”, which is clearly strongly induced inTRY1-3. However, the timescale of induction (Fig. 6) suggests that it may be responding to the presence of arabitol and be involved in conversion back to ribulose (note that production and uptake are catalysed by different enzymes inC.albicans[37]). Baumannet al[38] suggested that arabitol production was due to the activity of“YDL124W”, which is certainly expressed at a higher level inTRY1-3 than the other strains at 0h (Fig. 6). However, the subsequent induction of this activity in GS115 andTRY1-1 does not coincide with increased arabitol production in these strains, so the origin of arabitol accumulation inP.pastorisremains uncertain.
Expression prior to induction with methanol
Excess glycerol is a catabolite repressor ofAOX1expression but induction has been observed when methanol was added to cultures growing on limiting glycerol concentrations [39]. Fur-thermore, a low level (compared to fully induced) ofAOX1de-repression has been observed when cells are starved of a carbon source and therefore reliant on breakdown of endogenous re-serves, and also in glycerol limited continuous cultures [40]. While methanol utilisation path-ways genes were clearly induced after addition of methanol, it is apparent (Fig. 2) that all of these steps were being expressed prior to the addition of methanol in GS115 and the recombinant cells.
Significantly, in the context of de-repression ofAOX1expression, bothTRY1-1 andTRY1-3 showed up-regulation of both cytoplasmic and ER lumen based protein glycosylation activities associated with core N-glycosylation (S17 Fig.eg PAS_c121_0002, PAS_chr3_0944), consistent with the expression of a glycosylated heterologous protein. So, at this stage it was clear that
TRY1was being expressed, seemingly in a manner which reflected gene copy number (eg PAS_chr3_0944). However, this clearly had a cost to the host cell. Compared to GS115,TRY1 -1 showed some down-regulation of ribosomal protein synthesis and ribosomal biogenesis, whereas both of these were dramatically down-regulated (S1 Fig.) inTRY1-3 (the difference was also evident in a comparison ofTRY1-1 andTRY1-3). In additionTRY1-3 had reduced
Fig 6. Expression of the gene encoding D-arabitol-2-dehydrogenase (top) and“YDL124W”(bottom), 0 (before), 2 and 4 hours after the start of methanol addition to wild-type GS115 (black),TRY1-1(blue) andTRY1-3(red), strains containing 1 and 3 gene copies of the human typsinogen gene, respectively, under the control of theAOX1promoter.Error bars show SEM.
expression of RNA polymerase I and III, pol III associated tRNA 5’and 3’end cap processing, purine and pyrimidine biosynthesis, DNA replication and translation initiation factors, and even showed an increase in autophagy (S7 Fig.), ubiquitin ligase (S9 Fig.) and proteasomal ac-tivity (S8 Fig.), in comparison with GS115. Increased autophagy and proteasomal activities are similar to the pattern seen when comparing induction in GS115 between 0 and 2h. However, while at t = 0, there may also have been some peroxisome biogenesis associated with the de-pression of methanol oxidation genes, nutritional starvation responses/growth rate reduction was also greater inTRY1-3 than GS115.
Discussion
TheAOX1induction system is described as tightly controlled and dependent on methanol for induction but the level of control is substrate and condition dependent [39]. While excess glyc-erol is a strong catabolite repressor, starvation or limiting concentrations of glycglyc-erol allow de-repression ofAOX1gene expression. This means that it is possible to obtain growth in continu-ous culture on glycerol-methanol or glucose-methanol combinations so long as the multi-car-bon substrate is in limiting amounts [40]. In a typical induction regime, during the early stage of fed-batch growth on glycerol, the glycerol concentration in the culture will be high, but as the cell density increases, just before induction with methanol the glycerol concentration will have become growth limiting (1) (ie the concentration in the culture will be very low). Thus, it is not surprising that heterologous protein expression will have started prior to the addition of methanol. With the multiple gene-copy strains it is possible that de-repression occurs even ear-lier due to the change in stoichiometry of repressors and cognate binding site in theAOX1
promoter.
De-repression of heterologous protein synthesis prior to the switch to methanol clearly presents an additional metabolic load on the cells, which are already undergoing a decline in growth rate in a fed-batch regime with a constant supply of a growth limiting substrate. Com-parison between GS115,TRY1-1 andTRY1-3 at t = 0 confirms that heterologous protein ex-pression was accompanied by a typical starvation related down-regulation of ribosomal activity and up-regulation of autophagy and proteasomal activity in aTRY1copy-number-dependent pattern. It should be recognised that this scenario is fundamentally different from a typical tube or shake flask culture where cells are grown in an excess of an initial carbon source, har-vested and then transferred into a methanol medium.
The switch from glycerol to methanol clearly has further dramatic effects on growth rate, metabolic and energetic priorities of the cells and internal membrane organisation. While the expression of a single copy ofTRY1increased this burden, it was tolerated and in many ways exhibited a classical controlled UPR transcriptional profile, with little further induction of ERAD, although notably the level ofHAC1induction (Fig. 4) was higher in fed-batch than in the tube culture experiments. However, the presence of 3 copies ofTRY1, which gave a severe UPR response and reduced protein secretion in tube cultures, presumably due to the effects of ERAD [6], had a completely different profile in methanol-induced fed-batch culture. A high level ofAOX1induction accompanied by a low level ofHAC1induction indicates a disconnec-tion between transcripdisconnec-tion ofTRY1(under the control of theAOX1promoter) and protein ex-port. The most likely explanation for this is some form of translational arrest meaning that in
TRY1-3 theTRY1transcripts were not being quantitatively translated and therefore traffic through the ER was significantly less than withTRY1-1. This is consistent with the observation of similar levels of induction of the methanol dissimilation pathway genes inTRY1-3 and
Translational arrest can occur due to a variety of stress factors including high levels of UPR [41], heat shock [42], nutritional [43] and osmotic stress [44]. In the case ofTRY1-3, high levels of UPR were clearly not the cause, and differences in heterologous protein expression were un-likely to cause osmotic stress. Stress-related translational arrest occurs through interference with one of two stages of the assembly of a functioning ribosomal translation initiation com-plex. This leads to the formation of stress bodies which sequester specific mRNAs and certain initiation factors meaning that only a selective subclass of mRNAs can be translated [42,45]. Several stress factors stimulate Gcn2p to phosphorylate eIF2αwhich inhibits the GTP binding necessary for translational initiation. A later stage in initiation complex assembly is dependent on a functional TOR complex, which responds to the nutritional status of the cell. Under gen-eral nutritional starvation the function of Tor2p is compromised which indirectly leads to the degradation of eIF-4G [46], which normally serves as a scaffold for late stage assembly of the translation initiation complex.
The most likely stress factor which could give rise to translational arrest was a nutritional imbalance resulting from the demands for a high level of protein synthesis in cells undergoing nutritional limitation. It is evident that the TOR system must have been responding to general starvation in GS115 and theTRY1constructs, as this is the master repressor of autophagy [47] and also indirectly controls ribosomal protein production [48]. However, if translational arrest occurred in GS115 andTRY1-1 it was short lived, compared to the situation withTRY1-3, which indicates that other factors may have been involved. Given the higher demand for pro-tein synthesis inTRY1-3, it was possible that, combined with general starvation, this led to an effective starvation for amino acids (ie demand outstripped supply). This has a dedicated con-trol mechanism (general amino acid concon-trol responding to the presence of uncharged tRNAs) linked to phosphorylation of Gcn2p but also involving the (degree of starvation-dependent) control of translation of Gcn4p, a transcriptional activator of amino acid biosynthetic genes [49]. Although the activation of this pathway involves phosphorylation and translational con-trol (undetectable in a microarray), there was no evidence for higher levels of expression of amino acid biosynthetic genes inTRY1-3 compared to GS115 at any of the time points. Indeed, the transcriptional abundance ofGCN4inTRY1-3 at t = 0 was significantly below that of GS115 andTRY1-1, suggesting that whatever stress was leading to translational arrest was also limiting the possibility for activation of theGCN4dependent signal transduction pathway (Fig. 7). Interestingly, the profile ofGCN4expression reflects the changes in growth rate, with a reduction between 0 and 2h followed by an increase at 4h in both GS115 andTRY1-1, whereas inTRY1-3 that expression level stays low from 0–4h.
Major clues as to the likely cause of translational arrest come from the metabolomic profile ofTRY1-3, with a spike of intracellular and extracellular arabitol between 0–4h being consis-tent with cells being stressed either before or during induction with methanol. Yeasts character-istically produce polyols such as glycerol and arabitol [50] in response to a variety of
environmental stresses (osmotic, temperature, oxidative). InS.cerevisiae, glycerol appears to be the major stress-related polyol, with arabitol playing a minor role, whereas inP.pastorisand inP.anomalathe predominant polyol appears to be arabitol [51,52]. In the closely related
Candidaspp, glycerol is produced in response to osmotic stress, whereas production of arabitol results from either temperature stress or oxidative stress [53]. In our case, oxidative stress was unlikely to be the cause given thatTRY1-3 showed a lower induction of respiratory activity 2h after methanol addition compared to GS115. Additionally, oxidative stress has characteristic transcriptional induction signatures [54], with hydrogen peroxide (egTRX2,TRR1,TSA1and
growth on methanol there was no significant difference betweenTRY1-1 andTRY1-3 in any of these signatures (Fig. 7), suggesting that they were managed, rather than stress responses.
Even before methanol additionTRY1-3 had elevated levels of intracellular lactate (Fig. 3E) which suggests a) that glycogen derived glucose was already a significant energy source (lactate production from glycerol would have no metabolic advantage) but b) there was an imbalance between the NADH generation in the cytosol and transfer or use in the mitochondria. Com-bined with evidence for a restricted increase in respiratory activity after methanol addition (compared to GS115), the production of arabitol can be seen, not as a general stress response, but as a response to redox imbalance in the cytosol. InS.cerevisiae, cytoplasmic redox stress is known to induce glycerol production in a pathway which is regulated separately from the gen-eral stress response pathway [55]. Even though a high dissolved oxygen tension was main-tained through control of aeration, limitation of mitochondrial capacity to exchange reducing equivalents with the cytosol would have the same physiological consequences as hypoxia, in which arabitol production has also been observed [38]. Similarly, the filamentous fungus As-pergillus nigerproduces large amounts of polyols, principally mannitol, in response to low oxy-gen levels, to oxidize the NADH that would otherwise accumulate as a consequence of reduced oxidative metabolism [56,57]. Given that the de-repressed expression ofTRY1appeared to be following the expected profile based on copy number, this suggests that the high metabolic de-mands of heterologous protein production in theTRY1-3 strain, combined with the metabolic stress of a classical glycerol to methanol fed-batch regime resulted in a severe cytosolic-mito-chondrial redox imbalance, sufficient to cause a stress response which appears to have resulted in translational arrest. While the effects of redox stress on polyol production have previously been demonstrated in bothS.cerevisiaeandP.pastoris, this has not previously been character-ised as a major stress response that can lead to translational arrest. InS.cerevisiaethis may not have been observed because, as a Crabtree-positive yeast, physiologically relevant redox stress can be resolved by the production of ethanol.
Examination of the metabolomic profile of all of the strains suggests that a degree of redox stress is characteristic of the switch from glycerol to methanol even in the absence of heterolo-gous protein synthesis. All strains start to accumulate some arabitol andβ-hydroxybutyrate (less inTRY1-3 until 4h after induction) after the addition of methanol and also have a charac-teristic formate spike, where formate accumulates transiently, presumably due to a redox im-balance reducing the rate of formate oxidation. However, inTRY1-3 arabitol accumulation is higher, the formate spike appears later and only in this strain is there a significant production ofα,αtrehalose, the production of which coincides with the peak of arabitol production. Tre-halose is a classic stress response molecule which can have a number of functions including providing protection of proteins and membranes after heat shock and control of glycolysis. In-tracellular accumulation appears to be the result of an imbalance between synthesis and degra-dation, resulting primarily from post-translational control of the different activities.
A clear and unexpected pattern has emerged from this data which provides an additional explanation for poor secreted heterologous protein production in bioreactors, where results sometimes differ from those obtained in shake flasks. The standard fed-batch production re-gime leads to de-repression of heterologous protein production before methanol induction, and this is in a background of metabolic stress caused by declining growth rate. With the addi-tion of methanol, cells with a high existing metabolic load due to heterologous protein produc-tion undergo a stress response caused by a redox imbalance between the cytosol and
Supporting Information
S1 Fig. Expression levels of Try1p in tube cultures.Try1p levels (arbitrary scale) in the cul-ture supernatant of 50ml tube culcul-tures of recombinant strains containing 1, 2 and 3 copies of theTRY1grown for 24h in BMMY analysed on an Experion Pro260 protein analysis chip (BioRad). The same volume of supernatant was applied to each lane.
(TIF)
S2 Fig. Expression levels of ribosome biogenesis genes.Log 2 normalised expression levels of ribosome biogenesis genes grouped according to KEGG pathways. Genes are uniquely identi-fied by PAS (PAStoris) codes and expression was determined at 0, 2 and 4h after methanol ad-dition in fed-batch cultures of GS115, TRY1-1 and TRY1-3.The associated trees cluster genes with similar expression profiles across all conditions.
(PDF)
S3 Fig. Expression levels of ribosomal protein biosynthesis genes.Log 2 normalised expres-sion levels of ribosomal protein biosynthesis genes grouped according to KEGG pathways. Genes are uniquely identified by PAS (PAStoris) codes and expression was determined at 0, 2 and 4h after methanol addition in fed-batch cultures of GS115, TRY1-1 and TRY1-3.The asso-ciated trees cluster genes with similar expression profiles across all conditions.
(PDF)
S4 Fig. Expression levels of genes encoding RNA Polymerase I, II and III associated pro-teins.Heat maps of log 2 normalised expression levels of genes encoding RNA Polymerase I, II and III associated proteins grouped according to KEGG pathways. Genes are uniquely identi-fied by PAS (PAStoris) codes and expression was determined at 0, 2 and 4h after methanol ad-dition in fed-batch cultures of GS115, TRY1-1 and TRY1-3.The associated trees cluster genes with similar expression profiles across all conditions.
(PDF)
S5 Fig. Expression levels of tRNA synthase genes.Heat maps of log 2 normalised expression levels of tRNA synthase genes. Genes are uniquely identified by PAS (PAStoris) codes and ex-pression was determined at 0, 2 and 4h after methanol addition in fed-batch cultures of GS115, TRY1-1 and TRY1-3.The associated trees cluster genes with similar expression profiles across all conditions.
(PDF)
S6 Fig. Expression levels of genes encoding proteins involved in peroxisomal biogenesis. Heat maps of log 2 normalised expression levels of genes encoding proteins involved in peroxi-somal biogenesis grouped according to KEGG pathways. Genes are uniquely identified by PAS (PAStoris) codes and expression was determined at 0, 2 and 4h after methanol addition in fed-batch cultures of GS115, TRY1-1 and TRY1-3.The associated trees cluster genes with similar expression profiles across all conditions.
(PDF)
S7 Fig. Expression levels of genes associated with autophagy.Heat maps of log 2 normalised expression levels of genes associated with autophagy, grouped according to KEGG pathways. Genes are uniquely identified by PAS (PAStoris) codes and expression was determined at 0, 2 and 4h after methanol addition in fed-batch cultures of GS115, TRY1-1 and TRY1-3.The asso-ciated trees cluster genes with similar expression profiles across all conditions.
S8 Fig. Expression levels of genes associated with proteasomal activity.Heat maps of log 2 normalised expression levels of genes associated with proteasomal activity, grouped accord-ing to KEGG pathways. Genes are uniquely identified by PAS (PAStoris) codes and expres-sion was determined at 0, 2 and 4h after methanol addition in fed-batch cultures of GS115, TRY1-1 and TRY1-3.The associated trees cluster genes with similar expression profiles across all conditions.
(PDF)
S9 Fig. Expression levels of genes associated with ubiquitin mediated proteolysis.Heat maps of log 2 normalised expression levels of genes associated with ubiquitin mediated proteol-ysis, grouped according to KEGG pathways. Genes are uniquely identified by PAS (PAStoris) codes and expression was determined at 0, 2 and 4h after methanol addition in fed-batch cul-tures of GS115, TRY1-1 and TRY1-3.The associated trees cluster genes with similar expression profiles across all conditions.
(PDF)
S10 Fig. Expression levels of genes encoding proteins involved in oxidative phosphoryla-tion.Heat maps of log 2 normalised expression levels of genes encoding proteins involved in oxidative phosphorylation, defined by KEGG families, at 2h and 4h after methanol addition in fed-batch cultures of GS115, TRY1-1 and TRY1-3, compared to those of GS115 before methanol addition. The associated trees cluster genes with similar expression profiles across all conditions.
(PDF)
S11 Fig. Expression levels of genes encoding proteins involved in TCA Cycle.Heat maps of log 2 normalised expression levels of genes encoding proteins involved in the TCA Cycle, de-fined by KEGG families, at 2h and 4h after methanol addition in fed-batch cultures of GS115, TRY1-1 and TRY1-3, compared to those of GS115 before methanol addition. The associated trees cluster genes with similar expression profiles across all conditions.
(PDF)
S12 Fig. Expression levels of genes encoding proteins involved in Glycolysis/gluconeogene-sis.Heat maps of log 2 normalised expression levels of genes encoding proteins involved in gly-colysis/gluconeogenesis, defined by KEGG families, at 2h and 4h after methanol addition in fed-batch cultures of GS115, TRY1-1 and TRY1-3, compared to those of GS115 before metha-nol addition. The associated trees cluster genes with similar expression profiles across all condi-tions.
(PDF)
S13 Fig. Expression levels of genes encoding proteins involved in pentose phosphate cycle. Heat maps of log 2 normalised expression levels of genes encoding proteins involved in the pentose phosphate cycle, defined by KEGG families, at 2h and 4h after methanol addition in fed-batch cultures of GS115, TRY1-1 and TRY1-3, compared to those of GS115 before metha-nol addition. The associated trees cluster genes with similar expression profiles across all condi-tions.
(PDF)
different are highlighted in green. (TIF)
S15 Fig. KOBAS comparisons between glycolysis/gluconeogenesis gene expression levels in TRY1-3 and GS115, 4 hours after addition of methanol.Comparisons are based on KEGG
pathways. Genes where expression is significantly up-regulated (red) or down-regulated (blue) inTRY1-3 compared to GS115 are highlighted.P pastorisgenes where expression is not signifi-cantly different are highlighted in green
(TIF)
S16 Fig. Expression levels of genes associated with protein processing in the ER.Heat maps of log 2 normalised expression levels of genes associated with protein processing in the ER, grouped according to KEGG pathways. Genes are uniquely identified by PAS (PAStoris) codes and expression was determined at 0, 2 and 4h after methanol addition in fed-batch cultures of GS115, TRY1-1 and TRY1-3. The associated trees cluster genes with similar expression profiles across all conditions.
(PDF)
S17 Fig. Expression levels of genes associated with N-glycan biosynthesis.Heat maps of log 2 normalised expression levels of genes associated with N-glycan biosynthesis, grouped accord-ing to KEGG pathways. Genes are uniquely identified by PAS (PAStoris) codes and expression was determined at 0, 2 and 4h after methanol addition in fed-batch cultures of GS115, TRY1-1 and TRY1-3. The associated trees cluster genes with similar expression profiles across all con-ditions.
(PDF)
Acknowledgments
The authors thank James Mansfield for technical support in running the bioreactors
Author Contributions
Conceived and designed the experiments: DJL JGB. Performed the experiments: BEJ GDT GRB. Analyzed the data: RA GRB GDT DJL. Contributed reagents/materials/analysis tools: GRB. Wrote the paper: BEJ RA GDT GRB JGB DJL.
References
1. Macauley-Patrick S, Fazenda ML, McNeil B, Harvey LM. Heterologous protein production using the Pichia pastoris expression system. Yeast. 2005 Mar; 22(4):249–70. PMID:15704221
2. Sreekrishna K, Flickinger MC. Pichia, Optimization of Protein Expression. Encyclopedia of Industrial Biotechnology: John Wiley & Sons, Inc.; 2009.
3. Krainer FW, Dietzsch C, Hajek T, Herwig C, Spadiut O, Glieder A. Recombinant protein expression in Pichia pastoris strains with an engineered methanol utilization pathway. Microb Cell Fact. 2012; 11:22. doi:10.1186/1475-2859-11-22PMID:22330134
4. Hartner FS, Glieder A. Regulation of methanol utilisation pathway genes in yeasts. Microb Cell Fact. 2006; 5:39. PMID:17169150
5. Cereghino JL, Cregg JM. Heterologous protein expression in the methylotrophic yeast Pichia pastoris. FEMS Microbiology Reviews 2000 24:45–66. PMID:10640598
6. Hohenblum H, Gasser B, Maurer M, Borth N, Mattanovich D. Effects of gene dosage, promoters, and substrates on unfolded protein stress of recombinant Pichia pastoris. Biotechnology and Bioengineer-ing. 2004 Feb 20; 85(4):367–75. PMID:14755554
8. Patil C, Walter P. Intracellular signaling from the endoplasmic reticulum to the nucleus: the unfolded protein response in yeast and mammals. Curr Opin Cell Biol. 2001 Jun; 13(3):349–55. PMID: 11343907
9. van der Klei IJ, Yurimoto H, Sakai Y, Veenhuis M. The significance of peroxisomes in methanol metab-olism in methylotrophic yeast. Biochim Biophys Acta. 2006 Dec; 1763(12):1453–62. PMID:17023065 10. Graf A, Gasser B, Dragosits M, Sauer M, Leparc GG, Tuchler T, et al. Novel insights into the unfolded protein response using Pichia pastoris specific DNA microarrays. Bmc Genomics. 2008 Aug 19; 9:390. doi:10.1186/1471-2164-9-390PMID:18713468
11. Liang S, Wang B, Pan L, Ye Y, He M, Han S, et al. Comprehensive structural annotation of Pichia pas-toris transcriptome and the response to various carbon sources using deep paired-end RNA sequenc-ing. BMC Genomics. 2012; 13:738. doi:10.1186/1471-2164-13-738PMID:23276294
12. Hesketh AR, Castrillo JI, Sawyer T, Archer DB, Oliver SG. Investigating the physiological response of Pichia (Komagataella) pastoris GS115 to the heterologous expression of misfolded proteins using che-mostat cultures. Appl Microbiol Biotechnol. 2013 Sep 11; 97(22):9747–62.
13. Kurtzman CP. Biotechnological strains of Komagataella (Pichia) pastoris are Komagataella phaffii as determined from multigene sequence analysis. J Ind Microbiol Biotechnol. 2009 Nov; 36(11):1435–8. doi:10.1007/s10295-009-0638-4PMID:19760441
14. Tredwell GD, Edwards-Jones B, Leak DJ, Bundy JG. The development of metabolomic sampling pro-cedures for Pichia pastoris, and baseline metabolome data. PLoS One. 2011; 6(1):e16286. doi:10. 1371/journal.pone.0016286PMID:21283710
15. Beckonert O, Keun HC, Ebbels TM, Bundy J, Holmes E, Lindon JC, et al. Metabolic profiling, metabolo-mic and metabonometabolo-mic procedures for NMR spectroscopy of urine, plasma, serum and tissue extracts. Nat Protoc. 2007; 2(11):2692–703. PMID:18007604
16. Lewis IA, Schommer SC, Markley JL. rNMR: open source software for identifying and quantifying me-tabolites in NMR spectra. Magnetic resonance in chemistry: MRC. 2009 Dec; 47 Suppl 1:S123–6. doi: 10.1002/mrc.2526PMID:19821464
17. Dieterle F, Ross A, Schlotterbeck G, Senn H. Probabilistic quotient normalization as robust method to account for dilution of complex biological mixtures. Application in 1H NMR metabonomics. 2006 Jul 01; 78(13):4281–90. PMID:16808434
18. Upton GJ, Langdon WB, Harrison AP. G-spots cause incorrect expression measurement in Affymetrix microarrays. BMC Genomics. 2008; 9:613. doi:10.1186/1471-2164-9-613PMID:19094220
19. De Schutter K, Lin YC, Tiels P, Van Hecke A, Glinka S, Weber-Lehmann J, et al. Genome sequence of the recombinant protein production host Pichia pastoris. Nat Biotechnol. 2009 Jun; 27(6):561–6. doi: 10.1038/nbt.1544PMID:19465926
20. Smyth GK. Linear models and empirical bayes methods for assessing differential expression in micro-array experiments. Stat Appl Genet Mol Biol. 2004; 3:Article3.
21. Smyth GK. Limma: linear models for microarray data R. Gentleman VC, Dudoit S., Irizarry R., Huber W. editor. New York: Springer; 2005.
22. Stein LD, Mungall C, Shu S, Caudy M, Mangone M, Day A, et al. The generic genome browser: a build-ing block for a model organism system database. Genome Res. 2002 Oct; 12(10):1599–610. PMID: 12368253
23. Xie C, Mao X, Huang J, Ding Y, Wu J, Dong S, et al. KOBAS 2.0: a web server for annotation and identi-fication of enriched pathways and diseases. Nucleic Acids Res. 2011 Jul; 39(Web Server issue): W316–22. doi:10.1093/nar/gkr483PMID:21715386
24. Mao X, Cai T, Olyarchuk JG, Wei L. Automated genome annotation and pathway identification using the KEGG Orthology (KO) as a controlled vocabulary. Bioinformatics. 2005 Oct 1; 21(19):3787–93. PMID:15817693
25. Wu J, Mao X, Cai T, Luo J, Wei L. KOBAS server: a web-based platform for automated annotation and pathway identification. Nucleic Acids Res. 2006 Jul 1; 34(Web Server issue):W720–4. PMID: 16845106
26. Kanehisa M, Goto S. KEGG: kyoto encyclopedia of genes and genomes. Nucleic Acids Res. 2000 Jan 1; 28(1):27–30. PMID:10592173
27. Kanehisa M, Goto S, Sato Y, Furumichi M, Tanabe M. KEGG for integration and interpretation of large-scale molecular data sets. Nucleic Acids Res. 2012 Jan; 40(Database issue):D109–14. doi:10.1093/ nar/gkr988PMID:22080510
29. Guarna MM, Lesnicki GJ, Tam BM, Robinson J, Radziminski CZ, Hasenwinkle D, et al. On-line monitor-ing and control of methanol concentration in shake-flask cultures of Pichia pastoris. Biotechnol Bioeng. 1997 Nov 5; 56(3):279–86. doi:10.1002/(SICI)1097-0290(19971105)56:3<279::AID-BIT5>3.0.CO;2-G PMID:18636643
30. Castrillo JI, Zeef LA, Hoyle DC, Zhang N, Hayes A, Gardner DC, et al. Growth control of the eukaryote cell: a systems biology study in yeast. J Biol. 2007; 6(2):4. PMID:17439666
31. Warner JR, Vilardell J, Sohn JH. Economics of ribosome biosynthesis. Cold Spring Harb Symp Quant Biol. 2001; 66:567–74. PMID:12762058
32. Zaman S, Lippman SI, Zhao X, Broach JR. How Saccharomyces responds to nutrients. Annu Rev Genet. 2008; 42:27–81. doi:10.1146/annurev.genet.41.110306.130206PMID:18303986
33. Brauer MJ, Huttenhower C, Airoldi EM, Rosenstein R, Matese JC, Gresham D, et al. Coordination of growth rate, cell cycle, stress response, and metabolic activity in yeast. Mol Biol Cell. 2008 Jan; 19 (1):352–67. PMID:17959824
34. Rucktaschel R, Girzalsky W, Erdmann R. Protein import machineries of peroxisomes. Biochim Biophys Acta. 2011 Mar; 1808(3):892–900. doi:10.1016/j.bbamem.2010.07.020PMID:20659419
35. van der Zand A, Gent J, Braakman I, Tabak HF. Biochemically distinct vesicles from the endoplasmic reticulum fuse to form peroxisomes. Cell. 2012 Apr 13; 149(2):397–409. doi:10.1016/j.cell.2012.01. 054PMID:22500805
36. Bakker BM, Overkamp KM, van Maris AJA, Kotter P, Luttik MAH, van Dijken JP, et al. Stoichiometry and compartmentation of NADH metabolism in Saccharomyces cerevisiae. Fems Microbiology Re-views. 2001 Jan; 25(1):15–37. PMID:11152939
37. Wong B, Leeson S, Grindle S, Magee B, Brooks E, Magee PT. D-arabitol metabolism in Candida albi-cans: construction and analysis of mutants lacking D-arabitol dehydrogenase. J Bacteriol. 1995 Jun; 177(11):2971–6. PMID:7768790
38. Baumann K, Carnicer M, Dragosits M, Graf AB, Stadlmann J, Jouhten P, et al. A multi-level study of re-combinant Pichia pastoris in different oxygen conditions. Bmc Syst Biol. 2010 Oct 22; 4:141. doi:10. 1186/1752-0509-4-141PMID:20969759
39. Inan M, Meagher MM. Non-repressing carbon sources for alcohol oxidase (AOX1) promoter of Pichia pastoris. J Biosci Bioeng. 2001; 92(6):585–9. PMID:16233151
40. Jungo C, Marison I, von Stockar U. Regulation of alcohol oxidase of a recombinant Pichia pastoris Mut (+) strain in transient continuous cultures. Journal of Biotechnology. 2007 Jun 30; 130(3):236–46. PMID:17566583
41. Harding HP, Novoa I, Zhang Y, Zeng H, Wek R, Schapira M, et al. Regulated translation initiation con-trols stress-induced gene expression in mammalian cells. Mol Cell. 2000 Nov; 6(5):1099–108. PMID: 11106749
42. Grousl T, Ivanov P, Malcova I, Pompach P, Frydlova I, Slaba R, et al. Heat shock-induced accumulation of translation elongation and termination factors precedes assembly of stress granules in S. cerevisiae. PLoS One. 2013; 8(2):e57083. doi:10.1371/journal.pone.0057083PMID:23451152
43. Barbet NC, Schneider U, Helliwell SB, Stansfield I, Tuite MF, Hall MN. TOR controls translation initia-tion and early G1 progression in yeast. Mol Biol Cell. 1996 Jan; 7(1):25–42. PMID:8741837
44. Uesono Y, Toh EA. Transient inhibition of translation initiation by osmotic stress. J Biol Chem. 2002 Apr 19; 277(16):13848–55. PMID:11796711
45. Kedersha N, Anderson P. Regulation of translation by stress granules and processing bodies. Prog Mol Biol Transl Sci. 2009; 90:155–85. doi:10.1016/S1877-1173(09)90004-7PMID:20374741
46. Berset C, Trachsel H, Altmann M. The TOR (target of rapamycin) signal transduction pathway regulates the stability of translation initiation factor eIF4G in the yeast Saccharomyces cerevisiae. Proc Natl Acad Sci U S A. 1998 Apr 14; 95(8):4264–9. PMID:9539725
47. Kamada Y, Yoshino K, Kondo C, Kawamata T, Oshiro N, Yonezawa K, et al. Tor directly controls the Atg1 kinase complex to regulate autophagy. Mol Cell Biol. 2010 Feb; 30(4):1049–58. doi:10.1128/ MCB.01344-09PMID:19995911
48. Xiao L, Grove A. Coordination of Ribosomal Protein and Ribosomal RNA Gene Expression in Re-sponse to TOR Signaling. Curr Genomics. 2009 May; 10(3):198–205. doi:10.2174/
138920209788185261PMID:19881913
49. Hinnebusch AG. Translational regulation of GCN4 and the general amino acid control of yeast. Annual review of microbiology. 2005; 59:407–50. PMID:16153175
51. Bellinger Y, Larher F. A 13C comparative nuclear magnetic resonance study of organic solute produc-tion and excreproduc-tion by the yeasts Hansenula anomala and Saccharomyces cerevisiae in saline media. Can J Microbiol. 1988 May; 34(5):605–12. PMID:3061619
52. Dragosits M, Stadlmann J, Graf A, Gasser B, Maurer M, Sauer M, et al. The response to unfolded pro-tein is involved in osmotolerance of Pichia pastoris. Bmc Genomics. 2010 Mar 26; 11:207. doi:10. 1186/1471-2164-11-207PMID:20346137
53. Kayingo G, Wong B. The MAP kinase Hog1p differentially regulates stress-induced production and ac-cumulation of glycerol and D-arabitol in Candida albicans. Microbiology. 2005 Sep; 151(Pt 9):2987–99. PMID:16151209
54. Morano KA, Grant CM, Moye-Rowley WS. The response to heat shock and oxidative stress in Saccha-romyces cerevisiae. Genetics. 2012 Apr; 190(4):1157–95. doi:10.1534/genetics.111.128033PMID: 22209905
55. Ansell R, Granath K, Hohmann S, Thevelein JM, Adler L. The two isoenzymes for yeast NAD+-depen-dent glycerol 3-phosphate dehydrogenase encoded by GPD1 and GPD2 have distinct roles in osmoa-daptation and redox regulation. EMBO J. 1997 May 1; 16(9):2179–87. PMID:9171333
56. Diano A, Bekker-Jensen S, Dynesen J, Nielsen J. Polyol synthesis in Aspergillus niger: influence of ox-ygen availability, carbon and nitrogen sources on the metabolism. Biotechnol Bioeng. 2006 Aug 5; 94 (5):899–908. PMID:16718677