Distinct Responses of
Mycobacterium
smegmatis
to Exposure to Low and High
Levels of Hydrogen Peroxide
Xiaojing Li1,2, Jun Wu1,2, Jiao Han1, Yongfei Hu1,2, Kaixia Mi1,2*
1CAS Key Laboratory of Pathogenic Microbiology and Immunology, Institute of Microbiology, CAS, Beijing, 100101, China,2Beijing Key Laboratory of Microbial Drug Resistance and Resistome, Beijing 100101, Beijing, China
Abstract
Hydrogen peroxide (H2O2) is a natural oxidant produced by aerobic organisms and gives
rise to oxidative damage, including DNA mutations, protein inactivation and lipid damage. The genusMycobacteriumutilizes redox sensors and H2O2scavenging enzymes for the
detoxification of H2O2. To date, the precise response to oxidative stress has not been fully
elucidated. Here, we compared the effects of different levels of H2O2on transcription in M.smegmatisusing RNA-sequencing. A 0.2 mM H2O2treatment had little effect on the
growth and viability ofM.smegmatiswhereas 7 mM H2O2was lethal. Analysis of global
transcription showed that 0.2 mM H2O2induced relatively few changes in gene expression,
whereas a large proportion of the mycobacterial genome was found to be differentially expressed after treatment with 7 mM H2O2. Genes differentially expressed following
treat-ment with 0.2 mM H2O2included those coding for proteins involved in
glycolysis-gluconeo-genesis and fatty acid metabolism pathways, and expression of most genes encoding ribosomal proteins was lower following treatment with 7 mM H2O2. Our analysis shows
thatM.smegmatisutilizes the sigma factor MSMEG_5214 in response to 0.2 mM H2O2,
and the RpoE1 sigma factors MSMEG_0573 and MSMEG_0574 in response to 7 mM H2O2. In addition, different transcriptional regulators responded to different levels of H2O2:
MSMEG_1919 was induced by 0.2 mM H2O2, while high-level induction of DevR occurred
in response to 7 mM H2O2. We detected the induction of different detoxifying enzymes,
including genes encoding KatG, AhpD, TrxB and Trx, at different levels of H2O2and the
detoxifying enzymes were expressed at different levels of H2O2. In conclusion, our study
reveals the changes in transcription that are induced in response to different levels of H2O2
inM.smegmatis.
Introduction
The genusMycobacteriumincludes pathogens, such asMycobacterium tuberculosisand non-pathogenic microorganisms, such asMycobacterium smegmatis. Mycobacteria are able to
OPEN ACCESS
Citation:Li X, Wu J, Han J, Hu Y, Mi K (2015) Distinct Responses ofMycobacterium smegmatisto Exposure to Low and High Levels of Hydrogen Peroxide. PLoS ONE 10(7): e0134595. doi:10.1371/ journal.pone.0134595
Editor:Dipankar Chatterji, Indian Institute of Science, INDIA
Received:February 10, 2015
Accepted:July 13, 2015
Published:July 30, 2015
Copyright:© 2015 Li et al. This is an open access article distributed under the terms of theCreative Commons Attribution License, which permits unrestricted use, distribution, and reproduction in any medium, provided the original author and source are credited.
Data Availability Statement:All relevant data are within the paper and its Supporting Information files. The dataset of RNA-sequencing has been submitted to ArrayExpress under the accession number E-MTAB-3594.
Funding:This work was supported by the National Basic Research Program of China (2012CB518700 and 2014CB744400) and the Key Program of the Chinese Academy of Sciences (KJZD-EW-L02).
respond to and survive under different stresses [1]. Hydrogen peroxide (H2O2) is a natural stressor that is produced by aerobic organisms and leads to oxidative damage, such as DNA mutations, protein inactivation and lipid damage [2]. In addition, whenM.tuberculosis, the pathogen which causes human tuberculosis (TB), infects a host, the production of H2O2is an important innate defense mechanism against infection. As a successful pathogen,M. tuberculo-sishas evolved redox sensors and H2O2scavenging enzymes for the detoxification of H2O2 damage [3,4], but the precise response to H2O2has not been fully elucidated. A number of studies have shown thatM.tuberculosiscontains several regulators that respond to H2O2and several enzymes that detoxify H2O2damage [5–7]. A recent study has reported different tran-scriptional profiles inM.tuberculosisin response to different H2O2concentrations [7]. How-ever, the transcriptional response ofM.smegmatisto different concentrations of H2O2has yet to be explored. A greater understanding of the differences between pathogenicM.tuberculosis
and nonpathogenicM.smegmatisin their response to H2O2will help us to understand the pathogenesis ofM.tuberculosis.
Transcriptional regulation in response to H2O2in theMycobacteriais complex compared to that inBacillusorEscherichia coli.M.tuberculosishas 13 sigma factors, andM.smegmatishas 28 sigma factors [8,9], of which SigE, SigH, SigL and SigF play important roles in oxidative stress [3]. As classical transcriptional regulators such as OxyR, FNR and FixL are absent inM. tubercu-losis, alternative transcriptional regulators have been suggested to be involved in oxidative stress, including FurA [10], IdeR [11], CarD [12], and the WhiB proteins [3]. In addition to transcrip-tional regulators involved in the response to H2O2, the signal transduction network including two-component systems, one-component systems, and serine/threonine kinases, is also involved in relaying and orchestrating the response to H2O2.M.tuberculosisencodes 11 serine/threonine kinases (STKs), of which PknB, PknF, and PknG have been shown to be involved in the oxidative stress response [13–15]. Park et al. showed that PknB phosphorylates both SigH and its anti-sigma factor RshA and causes its release from the complex of SigH and RshA. The phosphory-lated SigH then regulates the response to oxidative stress [14]. Similar to PknB, PknD was shown to phosphorylate anti-anti-sigma factor Rv0516c and then to activate Rv0516c, which changes the expression of the SigF regulon [13]. Moreover,M.tuberculosisproduces many enzymes that scavenge H2O2. Mycobacterial KatG is a multifunctional heme-dependent catalase-peroxidase-peroxynitritase [16] and efficiently protectsMycobacteriumfrom reactive oxygen species damage [17]. KatG is the target of the first-line drug isoniazid (INH) and is responsible for the conversion of the prodrug INH into active INH [18]. Clinical strains with decreasing KatG activity showed higher levels of AhpC [19], suggesting that AhpC contributes to defense against oxidative stress. The metabolic enzyme complex with Lpd, SucB, AhpC, and AhpD, is also involved in antioxi-dant defense [20]. Thiol-dependent peroxidase Tpx is an antioxidant protein against oxidative stress [21]. Voskuil et al. recently investigated whole genome expression in response to different levels of oxidative stress and showed that many genes related to oxidative stress are induced con-currently with the dormancy regulon at high concentrations of H2O2[7].
Materials and Methods
Bacterial strains and culture conditions
Liquid cultures of theM.smegmatismc2155 strain were grown in Middlebrook 7H9 medium (Becton Dickinson) supplemented with 0.2% (v/v) glycerol (Beijing Modern Eastern Fine-chemical), 0.05% Tween 80 (v/v) (Sigma) and 10% ADS (albumin, dextrose, and saline). Mid-dlebrook 7H10 medium (Becton Dickinson) supplemented with 10% ADS and 0.2% (v/v) glycerol was used as the solid medium forM.smegmatisgrowth.
Response of the
M.
smegmatis
mc
2155 strain to H
2O
2stress
Log phase cultures (OD600of 0.8–1.0) ofM.smegmatismc2155 were diluted 1:100 into 7H9 media and cultured for approximately 12 hours until the OD600reached 0.3. Re-inoculated cells were then treated with the indicated concentrations of H2O2(0, 0.2 and 7 mM) for periods of 30 min or 3 h, and surviving cells were grown on 7H10 media. Cells were collected after 30 min of 0.2 mM or 7 mM H2O2treatment, and total RNA was isolated from each sample and compared by RNA-sequencing to RNA from untreated cells that were prepared simultaneously.
RNA isolation for RNA-sequencing
Fifty milliliters of bacterial culture (OD600of ~ 0.3) was collected and total RNA was isolated using FastPrep Purification kits (MP Bio) according to the manufacturer’s instructions. Con-struction and sequencing of the cDNA libraries of the various mycobacterial strains was per-formed by BGI-Shenzhen (China). Briefly, total RNA from treated mc2155 strains was treated using a Ribominus Transcriptome Isolation Kit (Thermo Fisher Scientific) to remove rRNA contaminations. NEXTflex RNA Fragmentation Buffer (Bioo Scientific) was added to separate the mRNA into short fragments. Using these short fragments as templates, random hexamer-primers were used to synthesize the first strand of cDNA. The second strand of cDNA was syn-thesized using buffer, dNTPs, RNase H and DNA polymerase I. The short fragments were puri-fied with a QIAQuick PCR extraction kit (QIAGEN) and resolved with EB buffer for end reparation and addition of poly(A). The short fragments were subsequently connected with sequencing adaptors. For amplification by PCR, we selected suitable fragments as templates, based on results of agarose gel electrophoresis. The library was then sequenced using Illumina HiSeq 2000. Clean reads were mapped to the reference genome and the gene sequences using SOAP2 [22]. The RNA-sequencing dataset obtained has been submitted to ArrayExpress under the accession number E-MTAB-3594.
RNA-sequencing data analysis
The raw data were filtered to 1) remove reads with adaptors, 2) remove reads with more than 10% of unknown nucleotides, 3) remove low quality reads (in which more than half of the base quality scores were less than 5). The resulting cleaned paired-end reads were mapped to theM.
smegmatismc2155 reference genome (NC 008596.1) using SOAP2. Mismatches of no more than 5 bases were allowed in the alignment. We performed statistical analysis in read align-ments on the genome and genes for each sample. Randomness of the mRNA/cDNA fragmen-tation was evaluated using the reads distribution of reference genes.
"the significance of digital gene expression profiles" [25] based on the criteria FDR0.001 and a fold change larger than 4. STRING (9.1) [26] was used to analyze the interactions of differen-tially expressed genes and functional and pathway enrichment analysis. A p-value less than 0.05 was used as a threshold to indicate significant enrichment.
Quantitative PCR of selected genes
Log phase cultures (OD600= 0.8–1.0) of all the tested strains were diluted 1:100 in 7H9 media. The strains were cultured until the OD600reached 0.3 and then divided into control and treat-ment groups. In the treattreat-ment group, the cells were treated with 0.2 or 7 mM H2O2for 30 min and then collected by centrifugation at 12,000 x g. Bacterial pellets were resuspended in TRIzol (Invitrogen, USA), and RNA was purified according to the manufacturer’s instructions. cDNA was synthesized using the SuperScript III First-Strand Synthesis System (Invitrogen, USA). Quantitative real-time PCR (qRT-PCR) was performed in a Bio-Rad iCycler using a 2x SYBR real-time PCR pre-mix (Takara Biotechnology Inc., Japan). The following cycling program was used: 95°C for 1.5 min followed by 40 cycles of 95°C for 10 s, 60°C for 15 s, and 72°C for 15 s, followed by 72°C for 6 min. TheM.smegmatis rpoDgene encoding the RNA polymerase sigma factor SigA was selected as a reference gene for normalizing gene expression. The 2-ΔΔCT method was used [27] to evaluate relative gene expression in the different strains and/or differ-ent treatmdiffer-ents. All primers used are listed inS1 Table.
Statistical analysis
All statistical analyses were performed using GraphPad Prism 5.0c. Significant differences in the data were determined using t-tests.
Results and Discussion
Effects of H
2O
2on growth and viability
Hydrogen peroxide (H2O2) is a natural oxidant produced by aerobic organisms and can lead to oxidative damage, such as DNA mutations, protein inactivation and drug resistance [2]. In addition, increasing levels of toxic H2O2in the infected host is an important defensive mecha-nism against invading pathogens. Resistance to H2O2might increase bacterial survival in mycobacterial-infected macrophages. A previous study from our lab showed that increased resistance to H2O2in a mutant strain ofM.smegmatiscould lead to higher survival in infected macrophages [28].M.tuberculosiscan persist in macrophages for decades, partly because it possesses many regulators that respond to H2O2and many enzymes that detoxify H2O2[3,7]. A recent study analyzed genome-wide changes in gene expression in response to different lev-els of oxidative and nitrosative stresses inM.tuberculosis[7]. Responses to oxidative and nitro-sative stresses were compared and their results revealed a common genetic response used by
M.tuberculosisin response to these stresses. This study demonstrated that analyzing global transcription levels can help us understand the molecular mechanisms underlying the response of bacteria to H2O2. Here, we examined the global transcriptional response ofM.smegmatisto different levels of H2O2using RNA-sequencing.
Bacteria are most sensitive to environmental stresses at the early logarithmic phase [29]. We therefore chose to treat theM.smegmatisstrain mc2155 with H2O2when bacteria reached the early logarithmic phase of growth (optical density, OD600of ~ 0.3). We have previously reported that, under experimental conditions in our laboratory, the MIC to H2O2inM. smeg-matisis 0.039 mM [28] and that ofM.tuberculosisis 1mM. The ratio of the MIC to H2O2ofM.
tuberculosisto H2O2, we used concentrations of H2O2comparable to those used in Voskuil et al [7]. Here we used an H2O2concentration of 7mM forM.smegmatisto correspond to the 200 mM H2O2treatment used by Voskuil et al. inM.tuberculosis. Similarly, the 0.2 mM H2O2 treatment used here corresponded to the ~ 5 mM H2O2treatment used by Voskuil et al inM.
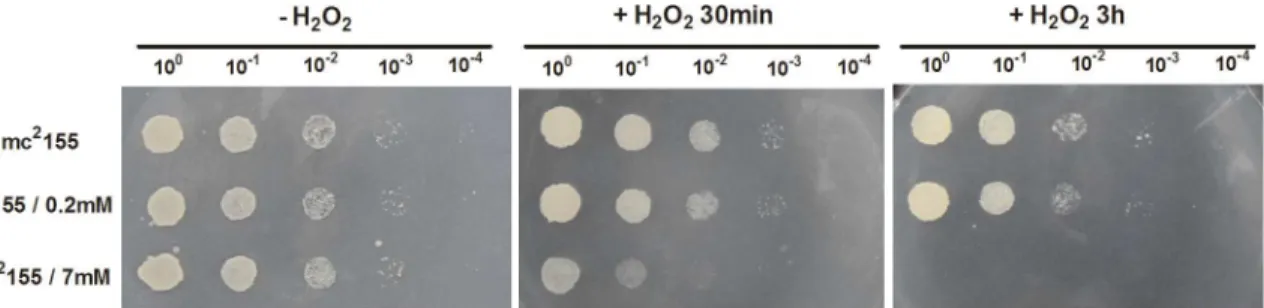
tuberculosis. When theM.smegmatismc2155 strain reached the early logarithmic phase, bacte-rial cultures were exposed to two different H2O2concentrations, namely 0.2 mM or 7 mM for either 30 min or 3 h, and cultures were then collected and spotted onto 7H10 media. As shown inFig 1, no growth differences were detected between the bacteria treated with 0.2 mM for 30 min or 3 h and untreated control bacteria, indicating that exposure to 0.2 mM H2O2had little effect on bacterial growth and viability. In contrast, when cultures were treated with 7 mM H2O2, we observed that exposure to 7 mM H2O2resulted in a significant decrease in cell sur-vival (Fig 1), indicating that 7 mM H2O2has a bactericidal effect inM.smegmatis. Moreover, the genes induced in response to H2O2(5–10 mM) in the Voskuil study were also found to be induced inM.tuberculosisduring infection of activated macrophages[30], indicating that a level of 5–10 mM H2O2is similar to that experienced by bacteria within infected macrophage. Here, the response of 7 mM of H2O2used to examine theM.smegmatisresponse might suggest the response of bacteria within infected macrophage.
The following experiments were performed to compare the transcriptional response ofM.
smegmatisexposed to 0.2 mM H2O2or 7 mM H2O2for 30 min when bacterial growth had reached an OD600of 0.3.
Expression profiles of
M.
smegmatis
in response to different levels of
H
2O
2Transcriptional reprogramming is a critical step in bacterial responses to various stress factors to ensure their survival. We therefore examined changes in mRNA expression following treat-ment with H2O2using RNA-sequencing. mRNA samples from ofM.smegmatismc2155 with or without H2O2treatment were prepared as described in the“Materials and Methods”.
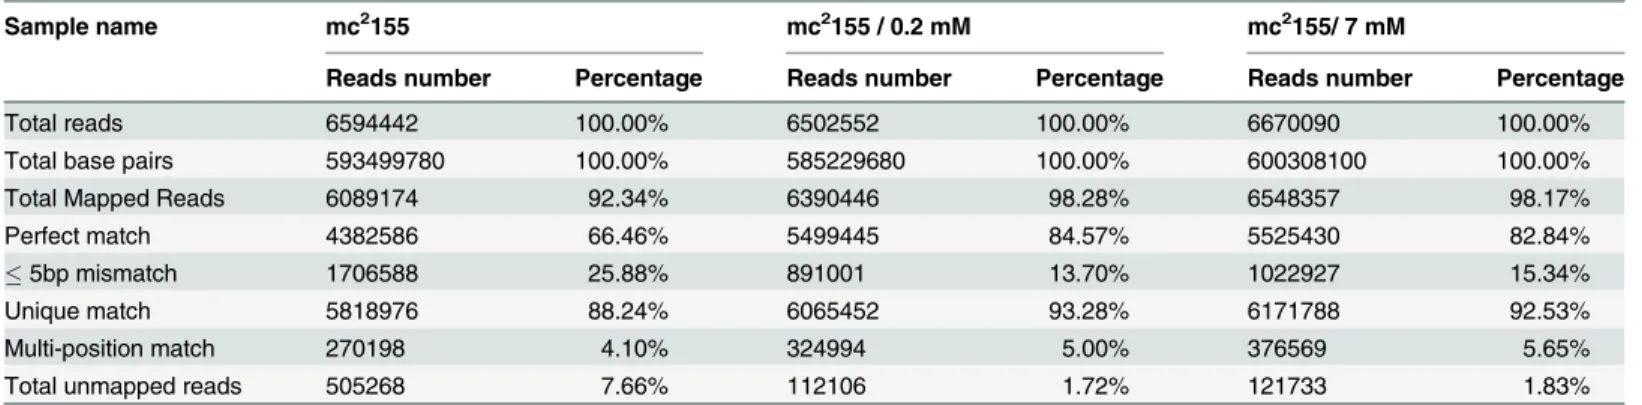
RNA-sequencing mapping statistics showed that approximately 96% of the sequencing reads could be mapped to theM.smegmatisreference genome (NC_008596.1) (Table 1). The percentage of unique mapped reads for untreated mc2155, mc2155 treated with 0.2 mM H2O2 and mc2155 treated with 7 mM H2O2were 92.34%, 98.28% and 98.17%, respectively and the number of reads mapped was 6089174, 6390446 and 6548357, respectively.
Fully annotated data are presented inS2–S4Tables. Genes were considered to be signifi-cantly differentially expressed if their changes in expression were>4-fold greater compared to
the non-treated wild type mc2155 strain, with a false discovery rate (FDR) corrected P-value
Fig 1. The effect of H2O2stress on the survival ofM.smegmatis.The panel represents serial dilutions (1:10) of mc2155 cultures treated with 0.2 mM or 7 mM H2O2for either 30 min or 3 hour. Three microliters of dilutedM.smegmatiscultures were spotted onto solid 7H10 medium. Images shown are
representative of at least 3 experiments.
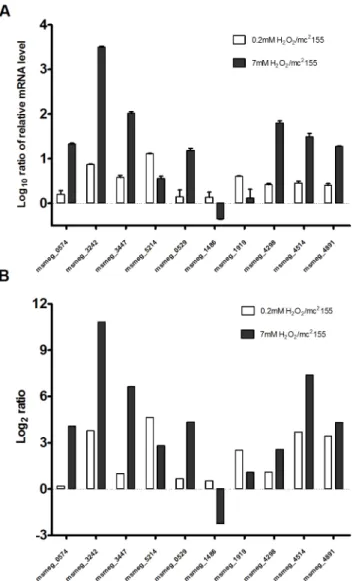
of<0.01. To confirm the results obtained from the RNA-sequencing analysis (Fig 2B), several
induced genes were examined by quantitative RT-PCR (qRT-PCR). In three independent experiments, total RNA was isolated fromM.smegmatisexposed to 0.2 mM or 7 mM H2O2for 30 min and relative levels of expression were analyzed by qRT-PCR. Results were consistent with those obtained from RNA-sequencing results, confirming the validity of our approach. For example,msmeg_0574exhibited a 21.17 ± 1.11-fold enhancement when induced by 7 mM H2O2, but little enhancement (1.61 ± 0.31-fold) when induced by 0.2 mM H2O2(Fig 2A), con-sistent with RNA-sequencing results (Fig 2B). In addition,msmeg_3242exhibited a
3116.9 ± 182.8-fold enhancement when induced by 7 mM H2O2and a 7.43 ± 0.11-fold enhancement when induced by 0.2 mM H2O2(Fig 2A).The relative expression levels of the genes we chose to test under 0.2 mM and 7 mM H2O2were also consistent with RNA-sequenc-ing results (Fig 2). In summary, these results support the fidelity of the RNA-sequencing results for the analysis below.
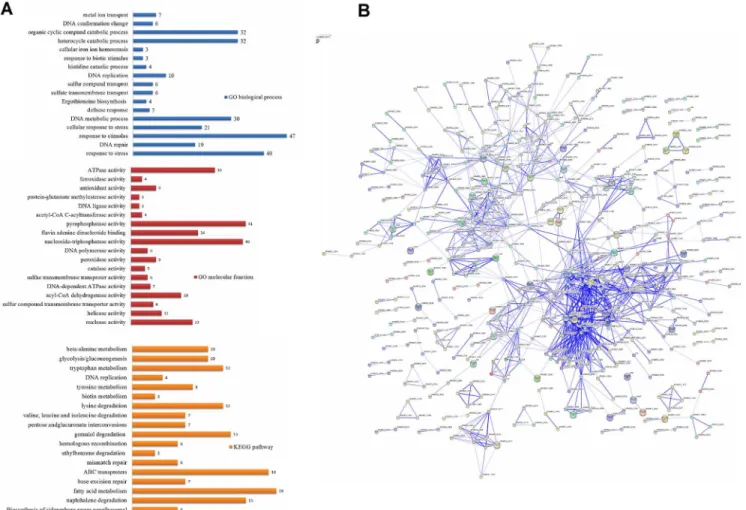
Upon exposure to 0.2 mM H2O2,there were 303 up-regulated genes and 331 down-regu-lated genes. Genes differentially expressed in the mc2155 strain on treatment with 0.2 mM H2O2were significantly enriched for several GO biological processes, including response to stress (p = 1.44 x 10⁻¹⁰), DNA repair (p = 2.87 x 10⁻⁵), and ergothioneine biosynthesis
(p = 1.18 x 10⁻²) when compared to the untreated mc2155 strain (Fig 3A). In GO molecular
function categories, we found that genes differentially expressed after treatment with 0.2 mM H2O2were significantly enriched for nuclease activity (p = 2.49 x10⁻⁴), helicase activity (p = 4.55 x 10⁻²), and sulfur compound transmembrane transporter activity (p = 4.55 x 10⁻²)
when compared to the untreated mc2155 strain (Fig 3A). As H2O2causes DNA damage, genes involved in DNA repair (listed inTable 2) were induced upon exposure to 0.2 mM H2O2. Induction of RecA, AlkA, and DNA helicase by H2O2was also found in theM.tuberculosis
study [7].M.tuberculosisRecA is involved in nucleotide excision, recombination and the SOS response [31]. InM.smegmatis, RecA is induced by DNA damage and is a key regulator ele-ment of the SOS response [32]. InM.tuberculosis,dnaE2, which encodes an error–prone DNA polymerase, was shown to increase its expression in response to DNA damaging agents, sug-gesting that its role is involved in damage tolerance [33,34]. mRNA levels ofM.smegmatis dnaE2andrecAwere increased 46-fold and 12-fold, respectively, by 0.2 mM H2O2, and 5-fold and 7.8-fold, respectively, by 7 mM H2O2(Table 2). The response profiles with high inductions of DNA repair genes inM.smegmatisby both low (0.2 mM) and high (7 mM) levels of H2O2 were strikingly different to those inM.tuberculosiswhich showed high induction from mild levels of H2O2and no change in induction with bactericidal H2O2levels [7].Future work should compare and investigate differences betweenM.smegmatisandM.tuberculosisin
Table 1. RNA-sequencing mapping statistics.
Sample name mc2155 mc2155 / 0.2 mM mc2155/ 7 mM
Reads number Percentage Reads number Percentage Reads number Percentage
Total reads 6594442 100.00% 6502552 100.00% 6670090 100.00%
Total base pairs 593499780 100.00% 585229680 100.00% 600308100 100.00%
Total Mapped Reads 6089174 92.34% 6390446 98.28% 6548357 98.17%
Perfect match 4382586 66.46% 5499445 84.57% 5525430 82.84%
5bp mismatch 1706588 25.88% 891001 13.70% 1022927 15.34%
Unique match 5818976 88.24% 6065452 93.28% 6171788 92.53%
Multi-position match 270198 4.10% 324994 5.00% 376569 5.65%
Total unmapped reads 505268 7.66% 112106 1.72% 121733 1.83%
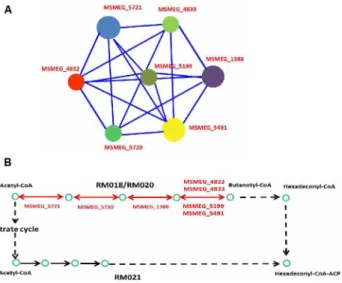
DNA-damage-mediated death caused by H2O2in order to provide greater insights into the pathogenicity ofM.tuberculosis. The STRING database was used to establish protein interac-tion networks of physical and funcinterac-tional interacinterac-tions among the differentially expressed genes identified (Fig 3B). Interestingly, using the KEGG-User Data Mapping [35] (Fig 4B), seven genes involved in fatty acid metabolism (RM018 and RM020) were found and formed an inter-connected cluster (Table 2andFig 4A). In addition, nine genes involved in glycolysis/gluco-neogenesis (msm00010) were found in a partially interconnected cluster (Table 2).
Transcription of these genes was induced, suggesting that these differentially expressed genes are involved in the central carbon metabolism (CCM) switch and providing supporting evi-dence for a previous suggestion that the CCM ofM.tuberculosisplays important roles in growth and pathogenicity [36,37]. An extensive transcriptional switch inM.tuberculosisCCM genes during host infection has been reported, indicating that there is a quick change in the metabolic pathway in response to various stresses [38]. The genepdhBinvolved in glycolysis/
Fig 2. Quantitative RT-PCR validation of RNA-sequencing results.(A) Quantitative RT-PCR analysis of the mRNA expression of genes differentially expressed after treatment with different levels of H2O2.M.
smegmatiscultures were treated with 2 mM or 7 mM H2O2for 30 min before extraction of RNA for qRT-PCR.
The data represent 3 independent experiments. (B) Fold changes of selected genes differentially expressed genes after treatment with 0.2 mM and 7 mM H2O2obtained by the RNA-sequencing.
gluconeogenesis was repressed 9.7-fold by 0.2 mM H2O2, andpdhAwas repressed 11-fold. PdhA and PdhB are constituents of the mycobacterial pyruvate dehydrogenase complex which connects glycolysis and the tricarboxylic acid (TCA) cycle [39]. In contrast to cells treated with 7 mM H2O2, changes induced inpdhAandpdhBin the 0.2 mM treatment were weak (Table 2). Similarly, the seven differentially expressed genes induced by 0.2 mM were involved in fatty acid metabolism and decreased by 4 to 6-fold (Table 2), whereas a decrease induction did not appear after the 7 mM H2O2treatment. Together, these results suggest that the metabolic switch of glycolysis/gluconeogenesis and fatty acid metabolism was specific to induction by 0.2 mM H2O2.
Compared to the down-regulation of 331 genes under the 0.2 mM H2O2treatment, 1671 genes were down-regulated under the 7 mM H2O2treatment and 343 genes were up-regulated. In contrast to the small proportion of genes in the genome that responded to the 0.2 mM H2O2 treatment (663 differentially-expressed genes, ~10% of the genes in theM.smegmatisgenome), 2002 genes were induced in response to 7 mM H2O2, representing 29.3% of the genes in theM.
smegmatisgenome. In contrast to the interaction networks obtained among genes which showed differential expression at the mRNA level in response to the 0.2mM H2O2treatment,
Fig 3. Overview of the differential expression profiles in response to 0.2 mM H2O2inM.smegmatis.(A) Enrichment analysis. The differently colored bars indicate the gene number for the enrichment of the annotations. (B) Interaction network of the differentially expressed genes ofM.smegmatisinduced by 0.2 mM H2O2using STRING (9.1) at confidence scores0.4. The network is enriched among the 634 differentially expressed genes and 111 interactions
were observed (p value = 0).
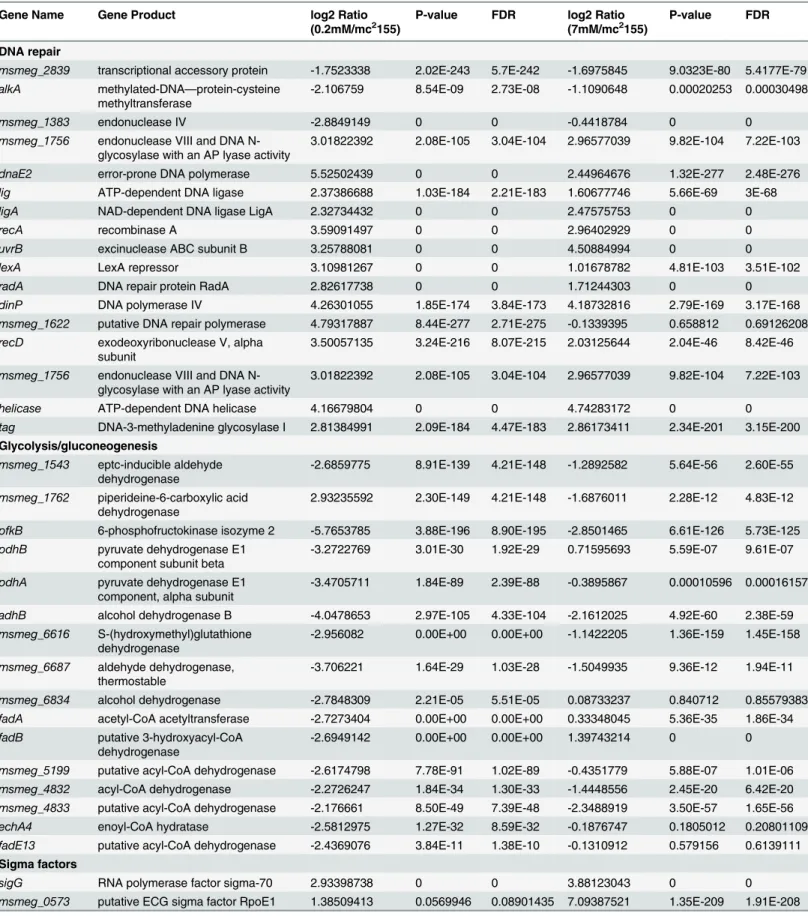
Table 2. Fold changes of genes differentially expressed after treatment with 0.2 mM and 7 mM H2O2(treated vs untreated).
Gene Name Gene Product log2 Ratio
(0.2mM/mc2155)
P-value FDR log2 Ratio
(7mM/mc2155)
P-value FDR
DNA repair
msmeg_2839 transcriptional accessory protein -1.7523338 2.02E-243 5.7E-242 -1.6975845 9.0323E-80 5.4177E-79 alkA methylated-DNA—protein-cysteine
methyltransferase
-2.106759 8.54E-09 2.73E-08 -1.1090648 0.00020253 0.00030498
msmeg_1383 endonuclease IV -2.8849149 0 0 -0.4418784 0 0 msmeg_1756 endonuclease VIII and DNA
N-glycosylase with an AP lyase activity
3.01822392 2.08E-105 3.04E-104 2.96577039 9.82E-104 7.22E-103
dnaE2 error-prone DNA polymerase 5.52502439 0 0 2.44964676 1.32E-277 2.48E-276 lig ATP-dependent DNA ligase 2.37386688 1.03E-184 2.21E-183 1.60677746 5.66E-69 3E-68
ligA NAD-dependent DNA ligase LigA 2.32734432 0 0 2.47575753 0 0
recA recombinase A 3.59091497 0 0 2.96402929 0 0
uvrB excinuclease ABC subunit B 3.25788081 0 0 4.50884994 0 0
lexA LexA repressor 3.10981267 0 0 1.01678782 4.81E-103 3.51E-102
radA DNA repair protein RadA 2.82617738 0 0 1.71244303 0 0
dinP DNA polymerase IV 4.26301055 1.85E-174 3.84E-173 4.18732816 2.79E-169 3.17E-168
msmeg_1622 putative DNA repair polymerase 4.79317887 8.44E-277 2.71E-275 -0.1339395 0.658812 0.69126208 recD exodeoxyribonuclease V, alpha
subunit
3.50057135 3.24E-216 8.07E-215 2.03125644 2.04E-46 8.42E-46
msmeg_1756 endonuclease VIII and DNA N-glycosylase with an AP lyase activity
3.01822392 2.08E-105 3.04E-104 2.96577039 9.82E-104 7.22E-103
helicase ATP-dependent DNA helicase 4.16679804 0 0 4.74283172 0 0 tag DNA-3-methyladenine glycosylase I 2.81384991 2.09E-184 4.47E-183 2.86173411 2.34E-201 3.15E-200
Glycolysis/gluconeogenesis
msmeg_1543 eptc-inducible aldehyde dehydrogenase
-2.6859775 8.91E-139 4.21E-148 -1.2892582 5.64E-56 2.60E-55
msmeg_1762 piperideine-6-carboxylic acid dehydrogenase
2.93235592 2.30E-149 4.21E-148 -1.6876011 2.28E-12 4.83E-12
pfkB 6-phosphofructokinase isozyme 2 -5.7653785 3.88E-196 8.90E-195 -2.8501465 6.61E-126 5.73E-125 pdhB pyruvate dehydrogenase E1
component subunit beta
-3.2722769 3.01E-30 1.92E-29 0.71595693 5.59E-07 9.61E-07
pdhA pyruvate dehydrogenase E1 component, alpha subunit
-3.4705711 1.84E-89 2.39E-88 -0.3895867 0.00010596 0.00016157
adhB alcohol dehydrogenase B -4.0478653 2.97E-105 4.33E-104 -2.1612025 4.92E-60 2.38E-59 msmeg_6616 S-(hydroxymethyl)glutathione
dehydrogenase
-2.956082 0.00E+00 0.00E+00 -1.1422205 1.36E-159 1.45E-158
msmeg_6687 aldehyde dehydrogenase, thermostable
-3.706221 1.64E-29 1.03E-28 -1.5049935 9.36E-12 1.94E-11
msmeg_6834 alcohol dehydrogenase -2.7848309 2.21E-05 5.51E-05 0.08733237 0.840712 0.85579383 fadA acetyl-CoA acetyltransferase -2.7273404 0.00E+00 0.00E+00 0.33348045 5.36E-35 1.86E-34 fadB putative 3-hydroxyacyl-CoA
dehydrogenase
-2.6949142 0.00E+00 0.00E+00 1.39743214 0 0
msmeg_5199 putative acyl-CoA dehydrogenase -2.6174798 7.78E-91 1.02E-89 -0.4351779 5.88E-07 1.01E-06 msmeg_4832 acyl-CoA dehydrogenase -2.2726247 1.84E-34 1.30E-33 -1.4448556 2.45E-20 6.42E-20 msmeg_4833 putative acyl-CoA dehydrogenase -2.176661 8.50E-49 7.39E-48 -2.3488919 3.50E-57 1.65E-56 echA4 enoyl-CoA hydratase -2.5812975 1.27E-32 8.59E-32 -0.1876747 0.1805012 0.20801109 fadE13 putative acyl-CoA dehydrogenase -2.4369076 3.84E-11 1.38E-10 -0.1310912 0.579156 0.6139111
Sigma factors
sigG RNA polymerase factor sigma-70 2.93398738 0 0 3.88123043 0 0
we did not find enrichment in specific metabolic pathways among genes that were differentially expressed in response to the 7 mM H2O2treatment. This might be due to the fact that the 7 mM H2O2treatment had more global effects on transcription, which were not limited to spe-cific metabolic pathways. We also conducted an analysis of GO biological processes and identi-fied enrichment in processes including gene expression (p = 2.47 x 10⁻¹), macromolecule
biosynthetic processes (p = 2.47 x 10⁻¹) and regulation of gene expression (p = 2.84 x 10⁻¹) (S1
Fig). Ribosome biogenesis was also enriched, though the P-value was 5.48 x 10⁻¹, slightly
higher than the cutoff value (P<0.5). Oxidative stress results in the rapid inhibition of protein
synthesis as well as in the reprogramming of gene expression, resulting in growth reduction as an adaption to oxidative stress [40].
Table 2. (Continued)
Gene Name Gene Product log2 Ratio
(0.2mM/mc2155)
P-value FDR log2 Ratio
(7mM/mc2155)
P-value FDR
msmeg_0574 putative ECG sigma factor RpoE1 0.18840222 0.422278 0.5067336 4.08443636 3.1E-276 5.78E-275 msmeg_1348 RNA polymerase ECF-subfamily
protein sigma factor
-0.0465176 0.804554 0.84797939 -2.3586787 1E-17 2.48E-17
sigL RNA polymerase sigma factor SigL 0.52825986 0.00083713 0.00176811 -2.2355973 4.27E-20 1.12E-19 msmeg_1970 sigma factor -1.6126499 4.2715E-20 1.1152E-19 -4.1999183 4.27E-20 1.12E-19 mysB RNA polymerase sigma factor SigB -0.4921846 4.74E-104 6.85E-103 2.50111799 0 0 msmeg_3008 putative sigma 54 type regulator -1.8964762 1.61E-11 5.87E-11 -2.0197975 3.44E-13 7.46E-13 msmeg_5214 RNA polymerase sigma-70 factor 4.65312922 2.09E-184 4.47E-183 2.81376729 1.63E-13 3.59E-13 msmeg_5444 RNA polymerase sigma-70 factor
protein
0.03717083 0.894318 0.91679688 -2.0919913 9.72E-09 1.8E-08
Transcriptional Regulators
devR two-component system response regulator
1.01514452 0.00136283 0.00280756 6.64431111 0 0
furA
(msmeg_6383)
transcription regulator FurA 2.0393827 1.57E-38 1.19E-37 4.16725591 0 0
phoP DNA-binding response regulator PhoP
2.90191537 4.67E-220 1.19E-218 -0.5325639 0.00089158 0.00128064
msmeg_4517 TetR-type transcriptional regulator of sulfur metabolism
3.21516913 0.00000169 0.00000457 4.13040109 7.31E-14 1.62E-13
msmeg_4925 transcriptional regulator 0.69321643 0.00330216 0.00644626 2.93688979 1.02E-78 6.03E-78 msmeg_1919 Transcription factor WhiB 2.52297686 0 0 1.07820136 2.53E-126 2.21E-125 msmeg_4025 transcriptional regulator, LysR family
protein
1.30263197 0.00055968 0.00120459 5.38130323 1.6E-210 2.28E-209
msmeg_6253 fur family protein transcriptional regulator
1.24070422 0.0469844 0.07479434 3.90800867 1.22E-25 3.59E-25
Detoxification enzymes
trxB thioredoxin-disulfide reductase -0.0780198 0.1478068 0.20755437 2.71109242 0 0
trx thioredoxin 0.12205973 0.0602136 0.09347541 3.84889994 0 0
msmeg_6884 NADP oxidoreductase 0.87052096 0.1166366 0.1680318 4.68101209 4.52E-68 2.38E-67
KatG catalase/peroxidase HPI 3.82587233 0 0 4.95397834 0 0
msmeg_4890 alkylhydroperoxidase 3.42735043 6.73E-19 3.21E-18 4.22476909 0.0465926 0.05777446 msmeg_3448 two-component system sensor kinase 0.55015338 0.1588256 0.22100457 5.07235098 4.09E-202 5.55E-201 ahpD alkylhydroperoxidase AhpD core -2.3697934 0.0210456 0.03618406 3.85029317 4.71E-31 1.53E-30 msmeg_3708 catalase 2.47422002 5.45E-56 5.11E-55 -3.0001305 5.73E-15 1.31E-14
Responses of specific genes to exposure to low and high levels of H
2O
2 Mycobacteriumutilizes diverse antioxidant systems to combat H2O2stress, including sigma factors, transcriptional regulators, STKs and detoxifying enzymes. To further clarify the responses to different levels of H2O2stress, we compared the biological categories involved in oxidative stress. InM.tuberculosis, sigma factors (such as SigE, SigH, SigL and SigF) are impor-tant for initiating the H2O2detoxification pathway [7], and so we examined the response of sigma factors to different levels of H2O2inM.smegmatis. We did not find any differences in the expression ofsigFin the 0, 0.2 mM, and 7 mM H2O2treatments. SigF was first described as a stationary-phase stress response sigma factor inM.tuberculosis[41], and we have previously shown that SigF is involved in the oxidative stress response in mycobacteria [41,42]. Lack of SigF induction here may have been due to the fact that SigF is a stationary-phase stress response sigma factor and does not function at the early logarithmic phase, which was used in this study. It will be interesting to compare the global transcriptional response to H2O2at dif-ferent growth phases. While Voskuil et al. conducted studies showing thatM.tuberculosisSigH is highly induced upon exposure to high levels of H2O2[7], here,M.smegmatisSigH was mod-erately induced at both low and high stresses (data not shown). The genemsmeg_0573, which encodes the ECF sigma factor RpoE1, was the most highly induced sigma factor, exhibiting a 136-fold increase in expression following the 7 mM H2O2treatment. No change in its expres-sion was observed following the 0.2 mM H2O2treatment. Its paralog,msmeg_0574, which encodes the ECF sigma factor RpoE1, was also specifically induced (~17-fold) by 7 mM H2O2. These results showed that both MSMEG_0573 and MSMEG_0574 are specifically induced by 7 mM H2O2. In contrast,msmeg_5214, which encodes the RNA polymerase sigma-70 factor, was specifically up-regulated in 0.2 mM H2O2(Table 2). Together, these data indicate that distinct sigma factor genes respond to different levels of H2O2. In addition to sigma factors, transcrip-tional regulators also have important roles in the regulation of the oxidative stress response. AsM.tuberculosisdoes not have a functional OxyR, the transcription regulators FurA, IdeR, CarD and WhiB play important roles in the oxidative stress response. FurA was induced 4-fold at 0.2 mM H2O2and 18-fold at 7 mM H2O2. Furthermore, no significant changes were found
Fig 4. Connected network of the enriched differentially expressed genes following exposure to 0.2 mM H2O2.(A) Connected network of enriched differentially expressed genes involved in fatty acid metabolism (RM018 and RM020). (B) Partial fatty acid metabolism inM.smegmatis. Genes expressed differentially after 0.2 mM H2O2treatment assigned to RM018 and RM020 are marked in red.
inIdeRandCarDexpression levels at either 0.2 mM or 7 mM H2O2.TheM.smegmatisgenome contains sixwhiBgenes, and only MSMEG_1919 was induced by 0.2 mM H2O2(Table 2). DevR has previously been shown to be highly induced inM.tuberculosisonly when exposed to high concentrations of H2O2[7]. Consistent with this report, our results showed that inM.
smegmatis,devRexpression was mildly increased by 0.2 mM and strongly increased (100-fold) after treatment with 7 mM H2O2treatment (Table 2). We next compared the transcription responses of genes coding for serine/threonine-protein kinases (SPTKs) to H2O2exposure. Of the STPKs, we found that following 7 mM H2O2treatment, onlypknKwas up-regulated.M.
tuberculosisPknK has been shown to regulate the slow growth of mycobacteria in response to various stresses and during persistence in infected mice [43]. Just as PknK is involved in the oxidative stress response pathway inM.tuberculosis, PknK plays an important role inM. smeg-matisin regulating the response to high levels of H2O2. The functions of PknK and its involve-ment in the response to H2O2require further exploration.
TheM.smegmatisgenome encodes several enzymes involved in the detoxification of H2O2 [4,8]. Our analysis showed that mRNA levels ofkatGwere up-regulated 12-fold and 30-fold following exposure to 0.2 and 7 mM H2O2respectively (Table 2). Notably,trxB(encoding thioredoxin-disulfide reductase) andtrx(encoding thioredoxin) expression was induced strongly by 7 mM H2O2treatment (Table 2), but not by 0.2 mM H2O2. Similarily,ahpD
(encoding alkylhydroperoxidase) andmsmeg_6884(encoding NADP oxidoreductase)
responded to 7 mM H2O2but not to 0.2 mM H2O2.msmeg_3708(encoding catalase) exhibited a 5-fold increase in mRNA expression only after exposure to 0.2 mM H2O2, indicating that it is specifically induced in response to low levels of H2O2exposure. It will be interesting to investi-gate the distinct biological roles of enzymes that scavenge different levels of H2O2in mycobac-teria. Such studies will lead to greater understanding of the basic roles of these enzymes.
Conclusion
In this study, we have shown that, inM.smegmatis, different genes are induced in response to low and high levels of H2O2. A notable difference in the response to low-level (0.2 mM) H2O2 and high-level (7 mM) H2O2was observed. When exposed to 0.2 mM H2O2, expression of approximately 10% of the genes in theM.smegmatisgenome was significantly changed. In contrast, 29.3% ofM.smegmatisgenes were significantly changed in response to 7 mM H2O2. Transcriptional analysis suggested that a metabolic switch in glycolysis/gluconeogenesis and fatty acid metabolism was potentially involved in the response to the 0.2 mM H2O2treatment but not to the 7 mM H2O2treatment. We also observed that transcriptional levels of genes encoding ribosomes decreased when bacterial cells were treated with 7 mM H2O2. This result suggests that 7 mM H2O2treatment affected the protein synthesis apparatus and thus reduced protein synthesis, resulting in reduced bacterial growth. The expression level of gene
levels of detoxifying enzymes used to combat H2O2stress. Further study of these genes will aid our understanding of the mechanisms underlying the precise regulation and scavenging of H2O2.
Supporting Information
S1 Fig. Overview of differential gene expression in response to 7 mM H2O2inM.
smegma-tis.
(JPG)
S1 Table. Oligonucleotide primers used in this study.
(DOC)
S2 Table. RNA-sequencing expression data for the control ofM.smegmatismc2155 without H2O2treatment.
(XLSX)
S3 Table. RNA-sequencing expression data for theM.smegmatismc2155 strain treated with 0.2 mM H2O2.
(XLSX)
S4 Table. RNA-sequencing expression data for theM.smegmatismc2155 strain treated with 7 mM H2O2.
(XLSX)
Acknowledgments
This work was supported by the National Basic Research Program of China (2012CB518700 and 2014CB744400) and the Key Program of the Chinese Academy of Sciences (KJZD-EW-L02).
Author Contributions
Conceived and designed the experiments: KM. Performed the experiments: XL JH. Analyzed the data: JW YH. Contributed reagents/materials/analysis tools: KM. Wrote the paper: KM XL.
References
1. Zahrt TC, Deretic V. Reactive nitrogen and oxygen intermediates and bacterial defenses: unusual adaptations in Mycobacterium tuberculosis. Antioxidants & redox signaling. 2002; 4(1):141–59. doi:10. 1089/152308602753625924PMID:11970850.
2. Imlay JA. The molecular mechanisms and physiological consequences of oxidative stress: lessons from a model bacterium. Nature reviews Microbiology. 2013; 11(7):443–54. doi:10.1038/nrmicro3032 PMID:23712352; PubMed Central PMCID: PMC4018742.
3. Bhat SA, Singh N, Trivedi A, Kansal P, Gupta P, Kumar A. The mechanism of redox sensing in Myco-bacterium tuberculosis. Free radical biology & medicine. 2012; 53(8):1625–41. doi:10.1016/j. freeradbiomed.2012.08.008PMID:22921590.
4. Mishra S, Imlay J. Why do bacteria use so many enzymes to scavenge hydrogen peroxide? Archives of biochemistry and biophysics. 2012; 525(2):145–60. doi:10.1016/j.abb.2012.04.014PMID:22609271; PubMed Central PMCID: PMC3413786.
5. Cirillo SL, Subbian S, Chen B, Weisbrod TR, Jacobs WR Jr., Cirillo JD. Protection of Mycobacterium tuberculosis from reactive oxygen species conferred by the mel2 locus impacts persistence and dis-semination. Infection and immunity. 2009; 77(6):2557–67. doi:10.1128/IAI.01481-08PMID:19349422; PubMed Central PMCID: PMC2687327.
National Academy of Sciences of the United States of America. 2009; 106(11):4414–8. doi:10.1073/ pnas.0810126106PMID:19237572; PubMed Central PMCID: PMC2657463.
7. Voskuil MI, Bartek IL, Visconti K, Schoolnik GK. The response of mycobacterium tuberculosis to reac-tive oxygen and nitrogen species. Frontiers in microbiology. 2011; 2:105. doi:10.3389/fmicb.2011. 00105PMID:21734908; PubMed Central PMCID: PMC3119406.
8. Kapopoulou A, Lew JM, Cole ST. The MycoBrowser portal: a comprehensive and manually annotated resource for mycobacterial genomes. Tuberculosis. 2011; 91(1):8–13. doi:10.1016/j.tube.2010.09.006 PMID:20980200.
9. Lew JM, Kapopoulou A, Jones LM, Cole ST. TubercuList—10 years after. Tuberculosis. 2011; 91(1):1– 7. doi:10.1016/j.tube.2010.09.008PMID:20980199.
10. Zahrt TC, Song J, Siple J, Deretic V. Mycobacterial FurA is a negative regulator of catalase-peroxidase gene katG. Molecular microbiology. 2001; 39(5):1174–85. PMID:11251835.
11. Rodriguez GM, Voskuil MI, Gold B, Schoolnik GK, Smith I. ideR, An essential gene in mycobacterium tuberculosis: role of IdeR in iron-dependent gene expression, iron metabolism, and oxidative stress response. Infection and immunity. 2002; 70(7):3371–81. PMID:12065475; PubMed Central PMCID: PMC128082.
12. Stallings CL, Stephanou NC, Chu L, Hochschild A, Nickels BE, Glickman MS. CarD is an essential reg-ulator of rRNA transcription required for Mycobacterium tuberculosis persistence. Cell. 2009; 138 (1):146–59. doi:10.1016/j.cell.2009.04.041PMID:19596241; PubMed Central PMCID: PMC2756155. 13. Greenstein AE, MacGurn JA, Baer CE, Falick AM, Cox JS, Alber T. M. tuberculosis Ser/Thr protein
kinase D phosphorylates an anti-anti-sigma factor homolog. PLoS pathogens. 2007; 3(4):e49. doi:10. 1371/journal.ppat.0030049PMID:17411339; PubMed Central PMCID: PMC1847690.
14. Park ST, Kang CM, Husson RN. Regulation of the SigH stress response regulon by an essential protein kinase in Mycobacterium tuberculosis. Proceedings of the National Academy of Sciences of the United States of America. 2008; 105(35):13105–10. doi:10.1073/pnas.0801143105PMID:18728196; PubMed Central PMCID: PMC2529121.
15. Scherr N, Honnappa S, Kunz G, Mueller P, Jayachandran R, Winkler F, et al. Structural basis for the specific inhibition of protein kinase G, a virulence factor of Mycobacterium tuberculosis. Proceedings of the National Academy of Sciences of the United States of America. 2007; 104(29):12151–6. doi:10. 1073/pnas.0702842104PMID:17616581; PubMed Central PMCID: PMC1924570.
16. Saint-Joanis B, Souchon H, Wilming M, Johnsson K, Alzari PM, Cole ST. Use of site-directed mutagen-esis to probe the structure, function and isoniazid activation of the catalase/peroxidase, KatG, from Mycobacterium tuberculosis. The Biochemical journal. 1999; 338 (Pt 3):753–60. PMID:10051449; PubMed Central PMCID: PMC1220113.
17. Knox R, Meadow PM, Worssam AR. The relationship between the catalase activity, hydrogen peroxide sensitivity, and isoniazid resistance of mycobacteria. American review of tuberculosis. 1956; 73 (5):726–34. PMID:13313958.
18. Vilcheze C, Jacobs WR Jr. The mechanism of isoniazid killing: clarity through the scope of genetics. Annual review of microbiology. 2007; 61:35–50. doi:10.1146/annurev.micro.61.111606.122346PMID: 18035606.
19. Sherman DR, Mdluli K, Hickey MJ, Arain TM, Morris SL, Barry CE 3rd, et al. Compensatory ahpC gene expression in isoniazid-resistant Mycobacterium tuberculosis. Science. 1996; 272(5268):1641–3. PMID:8658136.
20. Bryk R, Lima CD, Erdjument-Bromage H, Tempst P, Nathan C. Metabolic enzymes of mycobacteria linked to antioxidant defense by a thioredoxin-like protein. Science. 2002; 295(5557):1073–7. doi:10. 1126/science.1067798PMID:11799204.
21. Hu Y, Coates AR. Acute and persistent Mycobacterium tuberculosis infections depend on the thiol per-oxidase TpX. PloS one. 2009; 4(4):e5150. doi:10.1371/journal.pone.0005150PMID:19340292; PubMed Central PMCID: PMC2659749.
22. Li R, Yu C, Li Y, Lam TW, Yiu SM, Kristiansen K, et al. SOAP2: an improved ultrafast tool for short read alignment. Bioinformatics. 2009; 25(15):1966–7. doi:10.1093/bioinformatics/btp336PMID:19497933 23. Mortazavi A, Williams BA, McCue K, Schaeffer L, Wold B. Mapping and quantifying mammalian
tran-scriptomes by RNA-Seq. Nature methods. 2008; 5(7):621–8. doi:10.1038/nmeth.1226PMID: 18516045.
24. Wagner GP, Kin K, Lynch VJ. Measurement of mRNA abundance using RNA-seq data: RPKM mea-sure is inconsistent among samples. Theory in biosciences = Theorie in den Biowissenschaften. 2012; 131(4):281–5. doi:10.1007/s12064-012-0162-3PMID:22872506.
26. Franceschini A, Szklarczyk D, Frankild S, Kuhn M, Simonovic M, Roth A, et al. STRING v9.1: protein-protein interaction networks, with increased coverage and integration. Nucleic acids research. 2013; 41 (Database issue):D808–15. doi:10.1093/nar/gks1094PMID:23203871; PubMed Central PMCID: PMC3531103.
27. Livak KJ, Schmittgen TD. Analysis of relative gene expression data using real-time quantitative PCR and the 2(-Delta Delta C(T)) Method. Methods. 2001; 25(4):402–8. doi:10.1006/meth.2001.1262 PMID:11846609.
28. Li X, Tao J, Han J, Hu X, Chen Y, Deng H, et al. The gain of hydrogen peroxide resistance benefits growth fitness in mycobacteria under stress. Protein & cell. 2014; 5(3):182–5. doi: 10.1007/s13238-014-0024-5PMID:24563215; PubMed Central PMCID: PMC3967060.
29. Wilson M, DeRisi J, Kristensen HH, Imboden P, Rane S, Brown PO, et al. Exploring drug-induced alter-ations in gene expression in Mycobacterium tuberculosis by microarray hybridization. Proceedings of the National Academy of Sciences of the United States of America. 1999; 96(22):12833–8. PMID: 10536008; PubMed Central PMCID: PMC23119.
30. Schnappinger D, Ehrt S, Voskuil MI, Liu Y, Mangan JA, Monahan IM, et al. Transcriptional Adaptation of Mycobacterium tuberculosis within Macrophages: Insights into the Phagosomal Environment. The Journal of experimental medicine. 2003; 198(5):693–704. doi:10.1084/jem.20030846PMID: 12953091; PubMed Central PMCID: PMC2194186.
31. Papavinasasundaram KG, Anderson C, Brooks PC, Thomas NA, Movahedzadeh F, Jenner PJ, et al. Slow induction of RecA by DNA damage in Mycobacterium tuberculosis. Microbiology. 2001; 147(Pt 12):3271–9. PMID:11739759.
32. Durbach SI, Andersen SJ, Mizrahi V. SOS induction in mycobacteria: analysis of the DNA-binding activ-ity of a LexA-like repressor and its role in DNA damage induction of the recA gene from Mycobacterium smegmatis. Molecular microbiology. 1997; 26(4):643–53. PMID:9427395.
33. Boshoff HI, Reed MB, Barry CE 3rd, Mizrahi V. DnaE2 polymerase contributes to in vivo survival and the emergence of drug resistance in Mycobacterium tuberculosis. Cell. 2003; 113(2):183–93. PMID: 12705867.
34. Warner DF, Ndwandwe DE, Abrahams GL, Kana BD, Machowski EE, Venclovas C, et al. Essential roles for imuA'- and imuB-encoded accessory factors in DnaE2-dependent mutagenesis in Mycobacte-rium tuberculosis. Proceedings of the National Academy of Sciences of the United States of America. 2010; 107(29):13093–8. doi:10.1073/pnas.1002614107PMID:20615954; PubMed Central PMCID: PMC2919956.
35. Kanehisa M, Goto S, Sato Y, Kawashima M, Furumichi M, Tanabe M. Data, information, knowledge and principle: back to metabolism in KEGG. Nucleic acids research. 2014; 42(Database issue):D199– 205. doi:10.1093/nar/gkt1076PMID:24214961; PubMed Central PMCID: PMC3965122.
36. Sassetti CM, Boyd DH, Rubin EJ. Genes required for mycobacterial growth defined by high density mutagenesis. Molecular microbiology. 2003; 48(1):77–84. PMID:12657046.
37. Sassetti CM, Rubin EJ. Genetic requirements for mycobacterial survival during infection. Proceedings of the National Academy of Sciences of the United States of America. 2003; 100(22):12989–94. doi: 10.1073/pnas.2134250100PMID:14569030; PubMed Central PMCID: PMC240732.
38. Timm J, Post FA, Bekker LG, Walther GB, Wainwright HC, Manganelli R, et al. Differential expression of iron-, carbon-, and oxygen-responsive mycobacterial genes in the lungs of chronically infected mice and tuberculosis patients. Proceedings of the National Academy of Sciences of the United States of America. 2003; 100(24):14321–6. doi:10.1073/pnas.2436197100PMID:14623960; PubMed Central PMCID: PMC283590.
39. Venugopal A, Bryk R, Shi S, Rhee K, Rath P, Schnappinger D, et al. Virulence of Mycobacterium tuber-culosis depends on lipoamide dehydrogenase, a member of three multienzyme complexes. Cell host & microbe. 2011; 9(1):21–31. doi:10.1016/j.chom.2010.12.004PMID:21238944; PubMed Central PMCID: PMC3040420.
40. Grant CM. Regulation of translation by hydrogen peroxide. Antioxidants & redox signaling. 2011; 15 (1):191–203. doi:10.1089/ars.2010.3699PMID:21126188.
41. DeMaio J, Zhang Y, Ko C, Young DB, Bishai WR. A stationary-phase stress-response sigma factor from Mycobacterium tuberculosis. Proceedings of the National Academy of Sciences of the United States of America. 1996; 93(7):2790–4. PMID:8610119; PubMed Central PMCID: PMC39711. 42. Humpel A, Gebhard S, Cook GM, Berney M. The SigF regulon in Mycobacterium smegmatis reveals