Circulating Lipids Are Associated with
Alcoholic Liver Cirrhosis and Represent
Potential Biomarkers for Risk Assessment
Peter J. Meikle1*, Piyushkumar A. Mundra1, Gerard Wong1, Khairunnessa Rahman2, Kevin Huynh1, Christopher K. Barlow1, Alastair M. P. Duly3, Paul S. Haber2,4, John B. Whitfield5, Devanshi Seth2,4*
1Baker IDI Heart and Diabetes Institute, Melbourne, Vic 3004, Australia,2Discipline of Clinical Medicine & Addiction Medicine, Faculty of Medicine, University of Sydney, Sydney, NSW 2006, Australia,3Garvan Institute of Medical Research, Darlinghurst, NSW 2010, Australia,4Drug Health Services and Centenary Institute of Cancer Medicine and Cell Biology, Royal Prince Alfred Hospital, Camperdown, NSW 2050, Australia,5Genetic Epidemiology, QIMR Berghofer Medical Research Institute, Herston, Queensland 4029, Australia
*[email protected](PM);[email protected](DS)
Abstract
Liver disease is the greatest cause of death related to alcohol and a major public health prob-lem. While excessive alcohol intake results in hepatosteatosis in most individuals, this can progress in some to more severe forms of liver disease including fibrosis and cirrhosis. An ongoing challenge in the management of alcoholic liver disease is the identification of liver injury early in the disease process such that intervention strategies can prevent serious long term outcomes. Given that excessive alcohol consumption results in dysregulation of lipid metabolism we applied lipid profiling technology to characterise and compare serum lipid pro-files from excessive chronic drinkers with no liver disease to those with advanced alcoholic cir-rhosis. In a cohort of 59 excessive drinkers (31 with liver cirrhosis and 28 with no evidence of liver disease) we used electrospray ionisation tandem mass spectrometry to measure over 300 individual lipid species in serum, including species of the major phospholipid, sphingolipid, glycerolipid and sterol classes. Six of the 25 lipid classes and subclasses were significantly associated with alcoholic liver cirrhosis; these included dihexosylceramide, trihexosylcera-mide, alkylphosphatidylcholine, lysoalkylphosphatidylcholine, phosphatidylinositol and free cholesterol. Multivariate classification models created with only clinical characteristics gave an optimal model with an AUC of 0.847 and an accuracy of 79.7%. The addition of lipid measure-ments to the clinical characteristics resulted in models of improved performance with an AUC of 0.892 and accuracy of 81.8%. The gain in AUC and accuracy of the combined models high-light the potential of serum lipids as markers of liver injury in alcoholic liver disease.
Introduction
The excessive use of alcohol is widely recognised as a major health and social problem world-wide. Of the 60 medical diseases associated with alcohol, alcoholic liver disease causes the most
OPEN ACCESS
Citation:Meikle PJ, Mundra PA, Wong G, Rahman K, Huynh K, Barlow CK, et al. (2015) Circulating Lipids Are Associated with Alcoholic Liver Cirrhosis and Represent Potential Biomarkers for Risk Assessment. PLoS ONE 10(6): e0130346. doi:10.1371/journal.pone.0130346
Academic Editor:Silvia C. Sookoian, Institute of Medical Research A Lanari-IDIM, University of Buenos Aires-National Council of Scientific and Technological Research (CONICET), ARGENTINA
Received:December 26, 2014
Accepted:May 19, 2015
Published:June 24, 2015
Copyright:© 2015 Meikle et al. This is an open access article distributed under the terms of the
Creative Commons Attribution License, which permits unrestricted use, distribution, and reproduction in any medium, provided the original author and source are credited.
Data Availability Statement:All relevant data are within the paper and its Supporting Information files.
deaths and is consequently the greatest public health problem. Excessive alcohol consumption, defined as more than 4/3 drinks on any single day or more than 14/7 drinks per week (for men/women) [1], leads to hepatosteatosis or fatty liver in more than 90% of drinkers, which is reversible on abstinence. Nonetheless, continued drinking can lead to progressive liver injury. Moreover, alcohol itself can promote carcinogenesis through lipid peroxide generation impli-cated in alcohol-related hepatocarcinogenesis [2].
A key issue with alcoholic liver cirrhosis (ALC) is the early identification of liver injury. The ability to distinguish between mild inflammation and progressive severe liver disease would enable the targeting of intensive efforts to reduce alcohol consumption and/or guide specific treatment to arrest disease progression. Standard clinical tests (blood tests, ultrasound and computed tomogra-phy scanning) perform poorly in this regard due to lack of both sensitivity and specificity. Cur-rently available biomarkers rely on alcohol metabolic products (alcohol consumption markers) or liver injury (non-ALC specific markers). There is a need to identify new biomarkers specific for the early diagnosis of ALC, distinct from biomarkers of alcohol consumption.
Dyslipidemia is a common feature of alcoholic cirrhosis. One of the known mechanisms of alcohol induced liver injury is via alteration of lipid processing pathways, including fatty acid synthesis, uptake, oxidation and export from the liver [3,4]. Tracer studies in animals [5] and humans [6] have also demonstrated an alteration in de-novo lipogenesis resulting from alcohol consumption leading to altered liver and plasma lipid concentrations. In mouse studies, chronic alcohol consumption was associated with increased hepatic free fatty acid and
decreased acyl-CoA levels leading to increased levels of ceramide and the ceramide metabolites sphingosine and sphinganine [7]. Zhaoet al. reported ethanol-induced tissue-specific changes
in lipids related to specific fatty acid species in tissues and plasma [8].
In common with alcoholic steatosis, the elevated free fatty acids associated with obesity contribute to the progression to type 2 diabetes. Insulin, an anti-lipolytic hormone, decreases mitochondrialβ-oxidation of both free and hepatic fatty acids and thus increases hepatic fat accumulation. Insulin resistance can therefore induce steatosis by favouring peripheral lipolysis and hepatic lipid accumulation. Indeed, hepatic fat was inversely related to insulin sensitivity in a study including insulin-resistant and insulin-sensitive men [9]. Exogenous insulin administered to treat elevated blood glucose was more effective in patients with less liver fat [10]. Finally, the effects of insulin-sensitizing drugs rosiglitazone [11] and pioglitazone [12] include reversal of steatosis, suggesting that to some extent steatosis was responsible for insulin resistance. Recent cohort studies showed that obese drinkers are more prone to developing cirrhosis than drinkers in a healthy weight range [13,14] suggesting an interaction in the pathobiology of ALC, obesity and insulin sensitivity. We recently characterised the effect of elevated free fatty acids on circulat-ing lipids in the settcirculat-ings of obesity, prediabetes and type 2 diabetes uscirculat-ing a lipidomic approach [15,16]. Multiple lipid metabolic pathways were affected leading to alterations of the circulating levels of specific sphingolipid, phospholipid and glycerolipid species. In this study we character-ised serum lipid profiles from excessive chronic drinkers with no liver disease (Controls) to those with advanced alcoholic liver cirrhosis (Cases).
Materials and Methods
Patient details
Recruitment of excessive drinkers from alcohol treatment centres and liver clinics was con-ducted at the four major hospitals (Royal Prince Alfred, Concord Repatriation General, Liver-pool and Fairfield) in Sydney, Australia. Written informed consent was obtained from all participants. The study was approved by the Royal Prince Alfred Hospital Ethics Committee (HREC/11/RPAH/88).
Excessive drinkers are defined as having daily alcohol consumption of80 g per day (men) and 50 g per day (women) for ten years or more. Cases (n = 31) have clinical and/or histopa-thology evidence of ALC, with exclusion of hepatitis B or C, autoimmune liver disease, haemo-chromatosis and Wilson’s Disease (S1 Table). Controls (n = 28) have normal results for AST, ALT, total bilirubin, albumin, platelet count and INR while actively drinking or within 7 days of stopping the most recent episode of heavy alcohol use and no clinical and/or biopsy evidence of significant liver disease (S1 Table). HIV infection is an exclusion criterion for both Cases and Controls.
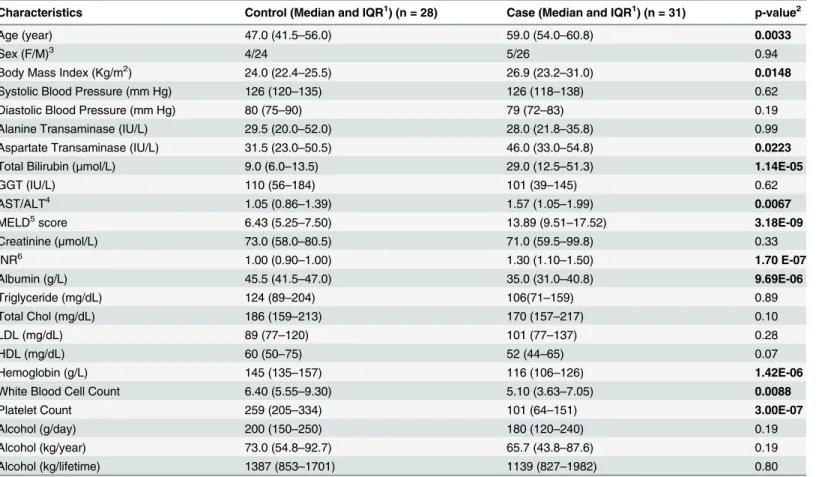
Clinical data from consenting participants included alcohol and tobacco history (amount, type, duration, abstinence, parental history), other drug use, demographics (age, gender, eth-nicity, education, marital status, medication), blood biochemistry (liver function tests, biliru-bin, blood clotting by international normalised ratio (INR), creatinine), clinical evidence of liver injury (ascites, encephalopathy, variceal bleeding), anthropometrics and Alcohol Use Dis-order Identification Test [17]. Patient characteristics for the two groups are presented in
Table 1. Serum was prepared from non-fasting blood and stored at -80°C. The majority of the samples were non-fasting due to the unpredictable nature of patients presenting at the drug treatment centre, that did not allow strict regimens of blood collection times and fasting status.
Lipid extraction
Lipids were extracted from serum as described previously [16]. In brief, 200μL of a 2:1
choloro-form:methanol mix, together with 10μL of the internal standard mix was added to 10μL
serum. The samples were vortexed for 10mins, incubated in an ultrasonic water bath at 20°C for 30mins and rested for 20mins at ambient temperature. After centrifuging the samples (13,000 g, 10mins) supernatants containing extracted lipids were dried under N2. The dried
lip-ids were resuspended in 50μL water-saturated butanol and 50μL 10mM NH4COOH in
metha-nol. After centrifuging (4000 g, 5mins) supernatants were transferred into HPLC glass vials with 0.2mL micro-inserts and Teflon insert caps.
Lipidomic analysis
Liquid chromatography electrospray ionisation tandem mass spectrometry was conducted as previously described [16]. Briefly, online LC-MS/MS was performed using a Zorbax C18, 1.8μm, 50 x 2.1 mm column (Agilent Technologies) connected to the ionization source of an
API4000 QTRAP mass spectrometer (Applied Biosystems). Liquid chromatography was per-formed using the following gradient conditions; 0–100% buffer B over 8.0 min, 2.5 min at 100% B, a return to 0% B over 0.5 min then 3.0 min at 0% B prior to the next injection. Diacyl-glycerols and triacylDiacyl-glycerols were separated using the same solvent system with an isocratic flow (100μL/min) of 85% B. Solvents A and B consisted of tetrahydrofuran:methanol:water
(30:20:50 and 75:20:5 respectively), both containing 10 mM NH4COOH. Measurement of
indi-vidual lipid species was performed using scheduled multiple-reaction monitoring in positive ion mode. Lipid measures were calculated by relating the peak area of each species to the peak area of the corresponding internal standard. Cholesteryl ester species were corrected for response factors determined for each species. Total measured lipids of each class were calcu-lated by summing the individual lipid species.
Statistical Analysis
adjusted for age and BMI was performed to determine the association of lipid classes, sub-classes and individual lipid species with ALC case-control status. The resultant IQR odds ratio for a given lipid measurement represents the number of times an individual with a lipid mea-surement at the 75thpercentile is more likely to have ALC than an individual with a lipid mea-surement at the 25thpercentile. Linear regression adjusted for age and BMI was used to determine the linear relationship between lipids and the model for end stage liver disease (MELD) score or bilirubin level. The beta-coefficients obtained represent the change in out-come measure (MELD score or bilirubin level) associated with an interquartile range increase in the lipid measurement. For all analyses, p-values were corrected for multiple comparisons using the Benjamini-Hochberg method [18] and statistical significance was determined by a corrected p-value<0.05.
The classification performance of lipid species and clinical characteristics were evaluated using machine learning methods. Along with lipid species, the following clinical characteristics were used: sex, BMI, systolic blood pressure, diastolic blood pressure, white blood count, hae-moglobin, platelet count, albumin, bilirubin, creatinine, INR, aspartate aminotransferase to
Table 1. Patient characteristics.
Characteristics Control (Median and IQR1) (n = 28) Case (Median and IQR1) (n = 31) p-value2
Age (year) 47.0 (41.5–56.0) 59.0 (54.0–60.8) 0.0033
Sex (F/M)3 4/24 5/26 0.94
Body Mass Index (Kg/m2) 24.0 (22.4
–25.5) 26.9 (23.2–31.0) 0.0148
Systolic Blood Pressure (mm Hg) 126 (120–135) 126 (118–138) 0.62
Diastolic Blood Pressure (mm Hg) 80 (75–90) 79 (72–83) 0.19
Alanine Transaminase (IU/L) 29.5 (20.0–52.0) 28.0 (21.8–35.8) 0.99
Aspartate Transaminase (IU/L) 31.5 (23.0–50.5) 46.0 (33.0–54.8) 0.0223
Total Bilirubin (μmol/L) 9.0 (6.0–13.5) 29.0 (12.5–51.3) 1.14E-05
GGT (IU/L) 110 (56–184) 101 (39–145) 0.62
AST/ALT4 1.05 (0.86
–1.39) 1.57 (1.05–1.99) 0.0067
MELD5score 6.43 (5.25
–7.50) 13.89 (9.51–17.52) 3.18E-09
Creatinine (μmol/L) 73.0 (58.0–80.5) 71.0 (59.5–99.8) 0.33
INR6 1.00 (0.90–1.00) 1.30 (1.10–1.50) 1.70 E-07
Albumin (g/L) 45.5 (41.5–47.0) 35.0 (31.0–40.8) 9.69E-06
Triglyceride (mg/dL) 124 (89–204) 106(71–159) 0.89
Total Chol (mg/dL) 186 (159–213) 170 (157–217) 0.10
LDL (mg/dL) 89 (77–120) 101 (77–137) 0.28
HDL (mg/dL) 60 (50–75) 52 (44–65) 0.07
Hemoglobin (g/L) 145 (135–157) 116 (106–126) 1.42E-06
White Blood Cell Count 6.40 (5.55–9.30) 5.10 (3.63–7.05) 0.0088
Platelet Count 259 (205–334) 101 (64–151) 3.00E-07
Alcohol (g/day) 200 (150–250) 180 (120–240) 0.19
Alcohol (kg/year) 73.0 (54.8–92.7) 65.7 (43.8–87.6) 0.19
Alcohol (kg/lifetime) 1387 (853–1701) 1139 (827–1982) 0.80
1IQR, interquartile range.
2Unless otherwise stated, all p-values are computed using the Mann-Whitney U test. 3p-value is computed using the chi-square test.
4Aspartate transaminase/alanine aminotransferase 5Model for end-stage liver disease.
6International Normalized Ratio for prothrombin time.
alanine aminotransferase ratio, gamma-glutamyl transferase, cholesterol, triglyceride, LDL-C, HDL-C, daily, yearly, and life time alcohol consumption. As age was significantly different between the ALC and alcoholic without liver cirrhosis (AwLC) groups, all the lipid species measurements and clinical characteristic values were adjusted for age based on the residuals from linear regression. After thresholding all the negative values to one, all the adjusted values were log-transformed.
To classify ALC from AwLC, we performed feature selection, model training and testing within a 3-fold stratified cross-validation framework (repeated 200 times). In each iteration, the order of inclusion of features into the model was determined by the reliefF algorithm [19]. Model development involved the implementation of a linear kernel-based support vector machine classifier obtained from the libraries of LIBSVM 2.84 [20]. The performance the model was assessed on the test dataset by computing the C-statistic (Area Under the Curve (AUC)), accuracy, specificity, sensitivity and net reclassification index for the first 30 features included in the model. Finally, the mean and 95% confidence intervals of each performance measure over 600 iterations were calculated.
Results
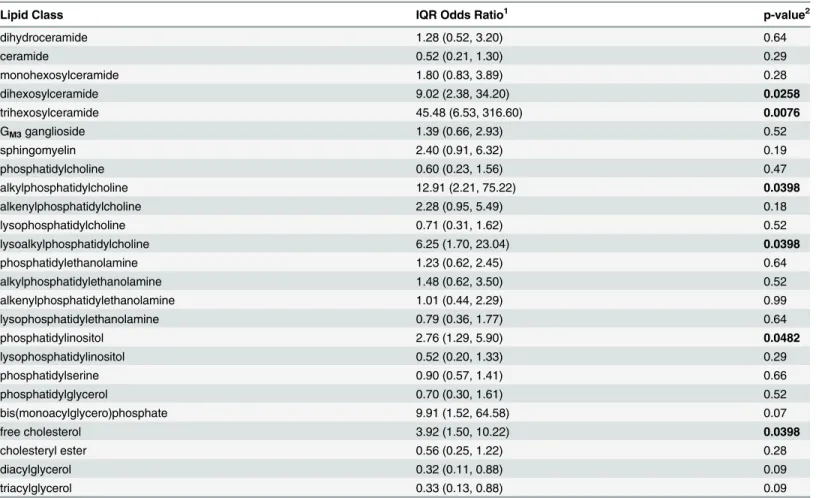
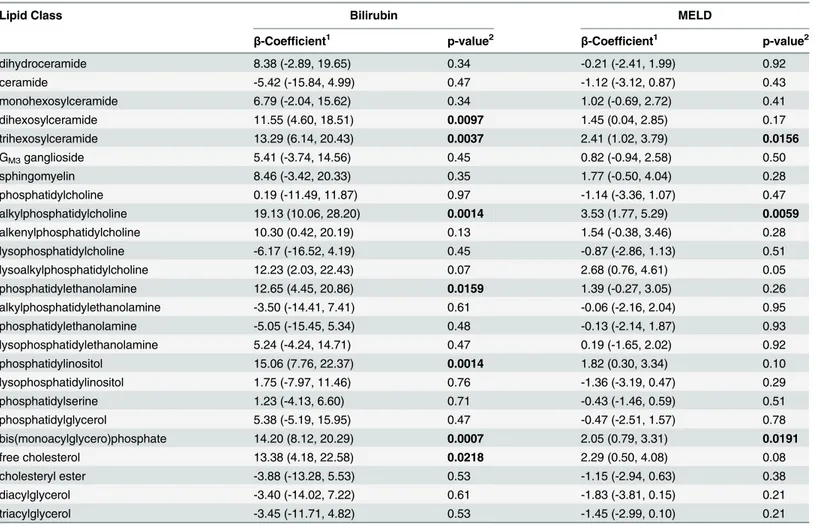
Patient characteristics are shown inTable 1. Anonymized study data are shown inS1 File. The ALC group were significantly older than the AwLC (Control) group, although this difference disappeared when adjusted for age at diagnosis of cirrhosis. They had a higher BMI, and as expected, elevated alanine aminotransferase and aspartate transaminase levels, a higher MELD score and an elevated INR. They also had decreased serum albumin, haemoglobin, white cell count and platelet count. Six of the 25 lipid classes and subclasses were significantly associated with ALC, these included the glycosphingolipids, dihexosylceramide and trihexosylceramide, the ether linked lipids alkylphosphatidylcholine and lysoalkylphosphatidylcholine as well as phosphatidylinositol and free cholesterol (Table 2). Diacylglycerol and triacylglycerol were negatively associated with ALC but this was not significant after correction for multiple com-parisons. There were 18 individual lipid species that showed a significant association with ALC after correction for multiple comparisons, including most species of di- and trihexosylceramide and a number of alkyl- and alkenylphosphatidylcholine species (S2 Table). Lipid classes and subclasses associated with bilirubin included dihexosylceramide and trihexosylceramide, alkyl-phosphatidylcholine phosphatidylinositol and free cholesterol, while dihexosylceramide and alkylphosphatidylcholine were associated with the MELD score (Table 3).
reclassification by more than 4%. The features most frequently used in these models included species of trihexosylceramide, phosphatidylcholine and lysophospholipids, in addition to plate-lets, INR and haemoglobin (Table 5).
Discussion
Biological relevance of lipids associated with alcoholic liver cirrhosis
It is long known that alcohol consumption is associated with changes in all lipid components of plasma [21]. Alcohol enhances fatty acid synthesis, driving triglyceride synthesis, and hin-ders VLDL secretion leading to the accumulation of triglycerides in lipid droplets within the hepatocytes [22]. Alcohol induced fat accumulation in the hepatocytes can trigger an inflam-matory response giving rise to steatohepatitis and increases the risk of progression to fibrosis and cirrhosis in some individuals, leading to serious health consequences. Identification of these individuals in the early stages of the disease would enable intervention prior to irrepara-ble liver damage. Lipidomic technologies, now allow for the detailed analysis of individual lipid species associated with disease and their evaluation as potential biomarkers.There are two dimensions to lipid biomarkers associated with liver disease; how far the dis-ease has progressed (normal liver/steatosis/various stages of fibrosis/cirrhosis); and the cause
Table 2. Association of lipid classes with alcoholic liver cirrhosis (versus alcoholics without liver disease).
Lipid Class IQR Odds Ratio1 p-value2
dihydroceramide 1.28 (0.52, 3.20) 0.64
ceramide 0.52 (0.21, 1.30) 0.29
monohexosylceramide 1.80 (0.83, 3.89) 0.28
dihexosylceramide 9.02 (2.38, 34.20) 0.0258
trihexosylceramide 45.48 (6.53, 316.60) 0.0076
GM3ganglioside 1.39 (0.66, 2.93) 0.52
sphingomyelin 2.40 (0.91, 6.32) 0.19
phosphatidylcholine 0.60 (0.23, 1.56) 0.47
alkylphosphatidylcholine 12.91 (2.21, 75.22) 0.0398
alkenylphosphatidylcholine 2.28 (0.95, 5.49) 0.18
lysophosphatidylcholine 0.71 (0.31, 1.62) 0.52
lysoalkylphosphatidylcholine 6.25 (1.70, 23.04) 0.0398
phosphatidylethanolamine 1.23 (0.62, 2.45) 0.64
alkylphosphatidylethanolamine 1.48 (0.62, 3.50) 0.52
alkenylphosphatidylethanolamine 1.01 (0.44, 2.29) 0.99
lysophosphatidylethanolamine 0.79 (0.36, 1.77) 0.64
phosphatidylinositol 2.76 (1.29, 5.90) 0.0482
lysophosphatidylinositol 0.52 (0.20, 1.33) 0.29
phosphatidylserine 0.90 (0.57, 1.41) 0.66
phosphatidylglycerol 0.70 (0.30, 1.61) 0.52
bis(monoacylglycero)phosphate 9.91 (1.52, 64.58) 0.07
free cholesterol 3.92 (1.50, 10.22) 0.0398
cholesteryl ester 0.56 (0.25, 1.22) 0.28
diacylglycerol 0.32 (0.11, 0.88) 0.09
triacylglycerol 0.33 (0.13, 0.88) 0.09
1
Odds ratio (95% confidence interval).
2p-values are corrected for multiple comparisons using the Benjamini-Hochberg method.
of the disease (viral/NAFLD/alcohol etc.). In our study, the comparison was between individu-als with ALC and AwLC, thus we are examining the more advanced stage of disease after the onset of alcoholic steatosis and establishment of cirrhosis. Our observations of several lipid classes and species showing positive associations with ALC, relative to AwLC, highlights the
Table 3. Association of lipid classes with bilirubin and the MELD score.
Lipid Class Bilirubin MELD
β-Coefficient1 p-value2 β-Coefficient1 p-value2
dihydroceramide 8.38 (-2.89, 19.65) 0.34 -0.21 (-2.41, 1.99) 0.92
ceramide -5.42 (-15.84, 4.99) 0.47 -1.12 (-3.12, 0.87) 0.43
monohexosylceramide 6.79 (-2.04, 15.62) 0.34 1.02 (-0.69, 2.72) 0.41
dihexosylceramide 11.55 (4.60, 18.51) 0.0097 1.45 (0.04, 2.85) 0.17
trihexosylceramide 13.29 (6.14, 20.43) 0.0037 2.41 (1.02, 3.79) 0.0156
GM3ganglioside 5.41 (-3.74, 14.56) 0.45 0.82 (-0.94, 2.58) 0.50
sphingomyelin 8.46 (-3.42, 20.33) 0.35 1.77 (-0.50, 4.04) 0.28
phosphatidylcholine 0.19 (-11.49, 11.87) 0.97 -1.14 (-3.36, 1.07) 0.47
alkylphosphatidylcholine 19.13 (10.06, 28.20) 0.0014 3.53 (1.77, 5.29) 0.0059
alkenylphosphatidylcholine 10.30 (0.42, 20.19) 0.13 1.54 (-0.38, 3.46) 0.28
lysophosphatidylcholine -6.17 (-16.52, 4.19) 0.45 -0.87 (-2.86, 1.13) 0.51
lysoalkylphosphatidylcholine 12.23 (2.03, 22.43) 0.07 2.68 (0.76, 4.61) 0.05
phosphatidylethanolamine 12.65 (4.45, 20.86) 0.0159 1.39 (-0.27, 3.05) 0.26
alkylphosphatidylethanolamine -3.50 (-14.41, 7.41) 0.61 -0.06 (-2.16, 2.04) 0.95
phosphatidylethanolamine -5.05 (-15.45, 5.34) 0.48 -0.13 (-2.14, 1.87) 0.93
lysophosphatidylethanolamine 5.24 (-4.24, 14.71) 0.47 0.19 (-1.65, 2.02) 0.92
phosphatidylinositol 15.06 (7.76, 22.37) 0.0014 1.82 (0.30, 3.34) 0.10
lysophosphatidylinositol 1.75 (-7.97, 11.46) 0.76 -1.36 (-3.19, 0.47) 0.29
phosphatidylserine 1.23 (-4.13, 6.60) 0.71 -0.43 (-1.46, 0.59) 0.51
phosphatidylglycerol 5.38 (-5.19, 15.95) 0.47 -0.47 (-2.51, 1.57) 0.78
bis(monoacylglycero)phosphate 14.20 (8.12, 20.29) 0.0007 2.05 (0.79, 3.31) 0.0191
free cholesterol 13.38 (4.18, 22.58) 0.0218 2.29 (0.50, 4.08) 0.08
cholesteryl ester -3.88 (-13.28, 5.53) 0.53 -1.15 (-2.94, 0.63) 0.38
diacylglycerol -3.40 (-14.02, 7.22) 0.61 -1.83 (-3.81, 0.15) 0.21
triacylglycerol -3.45 (-11.71, 4.82) 0.53 -1.45 (-2.99, 0.10) 0.21
1β-coef
ficient (95% confidence interval).
2p-values are corrected for multiple comparisons using the Benjamini-Hochberg method.
doi:10.1371/journal.pone.0130346.t003
Table 4. Classification performance of multivariate models for alcoholic liver cirrhosis1.
Performance Measure Clinical Characteristics Lipids Lipids + Clinical Characteristics Model
No. of features required to maximise AUC 4 22 27
Accuracy 79.7 (79.0, 80.2) 78.7 (78.0, 79.4) 81.8 (81.2, 82.4)
Area Under ROC Curve 0.847 (0.840, 0.853) 0.874 (0.869, 0.88) 0.892 (0.887, 0.897)
Sensitivity 72.9 (71.7, 74.0) 72.3 (71.1, 73.6) 76.1 (75.0, 77.2)
Specificity 87.2 (86.3, 88.1) 85.8 (84.7, 86.8) 88.1 (87.2, 89.0)
Net Reclassification Index2 - - 4.11%
1Mean and 95% con
fidence intervals.
2Net reclassi
fication improvement of the combined model over the risk factor model.
extensive metabolic abnormalities associated with cirrhosis. The strong positive association of both dihexosyl- and trihexosylceramide with cirrhosis contrasts with our previous observations that these glycosphingolipids are negatively associated with obesity [16] as well as with predia-betes and type 2 diapredia-betes [15] all situations where steatosis is likely to be a contributing factor. A similar effect was observed for the alkylphosphatidylcholine and lysoalkylphosphatidylcho-line that also showed positive associations with ALC (relative to AwLC) but were previously observed to have negative associations with obesity, prediabetes and type 2 diabetes [15,16]. However, while early studies showed chronic alcohol increased hepatic activity of the enzymes choline phosphotransferse and phosphatidylethanolamine methyltransferase involved in phos-phatidylcholine synthesis [23] we observed an odds ratio of only 0.60 for phosphatidylcholine with ALC (non-significant) indicating that a general increase in phosphatidylcholine synthesis is not associated with progression to ALC and that this was restricted to only the ether linked phosphatidylcholine species.
We also observed negative associations of diacyl- and triacylglycerol species with ALC, with IQR odds ratios of 0.32 (95% CI 0.11–0.88) and 0.33 (95% CI 0.13–0.88) respectively, although these were non-significant after correction for multiple comparisons. Similar observations in a baboon model of alcoholic liver disease, showed that microsomal diacylglycerol acyltransferase
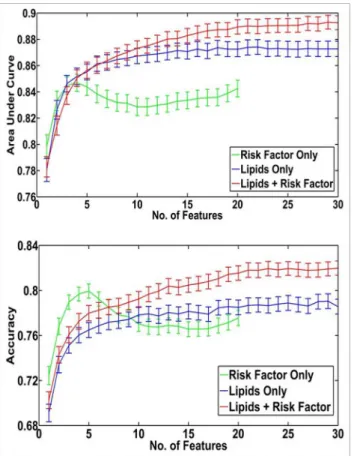
Fig 1. Area under the curve and accuracy for cross-validation performed on the computational models built to discriminate alcoholic liver cirrhosis.Multivariate models of increasing feature size (e.g., 1, 2, 3, 4. . ., 30) that included either clinical characteristics alone, lipids alone or lipids with clinical
characteristics were created using the ReliefF feature selection algorithm to determine the order of feature incorporation. Models were based on a linear kernel, support vector machine based classifier within a 3-fold cross validation framework (repeated 200 times). The mean C-statistic (panel A) and percentage accuracy (panel B) from each model is plotted against the number of variables (solid lines). 95% Confidence intervals are shown by the broken lines.
and cytosolic phosphatidate phosphohydrolase activities increased with early stages of fatty liver which disappeared with progression of liver injury [24]. The clinical measure of total tri-glycerides also showed the same trend (Table 1). These multiple associations with ALC that appear to oppose those associations with steatosis and early liver disease, may relate to a decrease in free fatty acids resulting from a decrease in lipogenesis as the liver progresses to cir-rhosis and the subsequent damage reduces the synthetic capacity of the liver [25] including fatty acid synthesis. These differences may also be a consequence of additional interactions of alcohol metabolites, acetaldehyde and acetate, that can form adducts thereby interfering with lipoprotein catabolism. In the present study, it should also be noted that these metabolic differ-ences may arise as a result of some ALC patients undergoing treatment/awaiting transplant and so may not be actively drinking at the time of sample collection.
Interestingly, phosphatidylinositol, was also positively associated with cirrhosis demonstrat-ing that not all lipid metabolic pathways are influenced in the same way. Phosphatidylinositol, is a major source of arachidonic acid, a precursor to the proinflammatory eicosanoids and so the positive association of this lipid class with both the early indicators of steatosis previously reported [15,16] and with the progression to cirrhosis, shown here, supports the role of the inflammatory state contributing to the disease progression.
Notwithstanding the opposing associations of several metabolic pathways in the ALC group, the elevated levels of dihexosylceramide may have specific effects on gene regulation
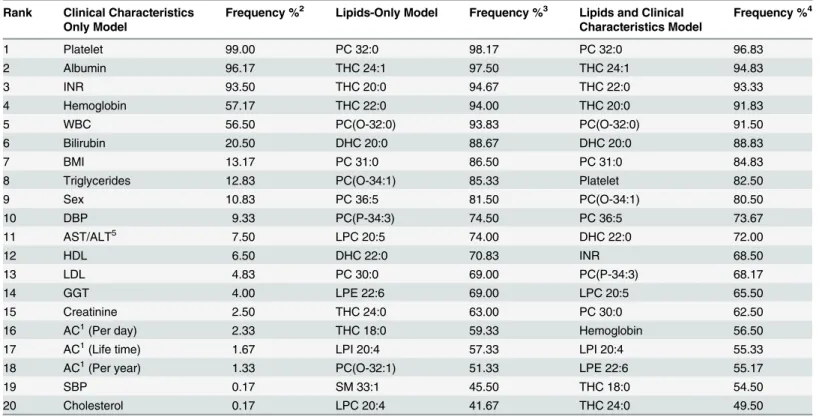
Table 5. Frequency of feature incorporation in the alcoholic liver cirrhosis classification models.
Rank Clinical Characteristics Only Model
Frequency %2 Lipids-Only Model Frequency %3 Lipids and Clinical Characteristics Model
Frequency %4
1 Platelet 99.00 PC 32:0 98.17 PC 32:0 96.83
2 Albumin 96.17 THC 24:1 97.50 THC 24:1 94.83
3 INR 93.50 THC 20:0 94.67 THC 22:0 93.33
4 Hemoglobin 57.17 THC 22:0 94.00 THC 20:0 91.83
5 WBC 56.50 PC(O-32:0) 93.83 PC(O-32:0) 91.50
6 Bilirubin 20.50 DHC 20:0 88.67 DHC 20:0 88.83
7 BMI 13.17 PC 31:0 86.50 PC 31:0 84.83
8 Triglycerides 12.83 PC(O-34:1) 85.33 Platelet 82.50
9 Sex 10.83 PC 36:5 81.50 PC(O-34:1) 80.50
10 DBP 9.33 PC(P-34:3) 74.50 PC 36:5 73.67
11 AST/ALT5 7.50 LPC 20:5 74.00 DHC 22:0 72.00
12 HDL 6.50 DHC 22:0 70.83 INR 68.50
13 LDL 4.83 PC 30:0 69.00 PC(P-34:3) 68.17
14 GGT 4.00 LPE 22:6 69.00 LPC 20:5 65.50
15 Creatinine 2.50 THC 24:0 63.00 PC 30:0 62.50
16 AC1(Per day) 2.33 THC 18:0 59.33 Hemoglobin 56.50
17 AC1(Life time) 1.67 LPI 20:4 57.33 LPI 20:4 55.33
18 AC1(Per year) 1.33 PC(O-32:1) 51.33 LPE 22:6 55.17
19 SBP 0.17 SM 33:1 45.50 THC 18:0 54.50
20 Cholesterol 0.17 LPC 20:4 41.67 THC 24:0 49.50
1AC: Alcohol consumption.
2Based on model containing 5 features. 3Based on model containing 25 features. 4Based on model containing 25 features.
5Aspartate transaminase/alanine aminotransferase.
and lipid metabolism leading to the increase in free cholesterol associated with cirrhosis. A recent paper by Chatterjeeet al. examined the effect of inhibiting glycosphingolipid synthesis
on atherosclerosis and arterial stiffness [26]. They observed that inhibition of glycosphingoli-pids synthesis resulted in a decrease in monohexosyl- and dihexosylceramide in the liver and this was associated with a decrease in serum cholesterol and triglycerides via recruitment of multiple genes/pathways of lipid metabolism. Specifically, inhibition of glycosphingolipids syn-thesis increased LDL receptor and SREBP2 gene expression and decreased HMGCoA reductase gene expression, suggesting inhibition of cholesterol biosynthesis and increased LDL uptake. The decreased monohexosyl- and dihexosylceramide were also associated with increased expression of genes responsible for cholesterol efflux including ABCA1, ABCG5 and ABCG8. This inhibitory effect of lactosylceramide (a dihexosylceramide) in cholesterol efflux via the ABCA1/Apolipiprotein A-1 pathway has also been demonstrated in cultured fibroblasts [27]. The decreased levels of lactosylceramide were also associated with the up regulation of the Cyp7A1 gene which encodes a 7-hydroxylase enzyme that converts cholesterol to bile acid for excretion [26]. Thus, lactosylceramide appears to influence multiple lipid metabolic pathways leading to elevated cholesterol within the liver. Elevated cholesterol within hepatic stellate cells has been shown to increase fibrosis in ACAT-1 deficient mice [28] further supporting a causal role for lipid metabolism in ALC. Dihexosylceramide then, is emerging as a key mediator of fibrosis and may play an important role in the regulation of cholesterol metabolism leading to cirrhosis. This raises the dual possibility of utilising these lipids as early indicators of cirrhosis and of targeting this metabolic pathway to prevent progression to cirrhosis. It should be noted that while the underlying dysregulation of lipid metabolism likely plays an important role in ALC, whether these metabolic changes are also present in other forms of cirrhosis remains to be determined.
Classification of alcoholic liver cirrhosis
Despite our incomplete knowledge of the metabolic dysregulation leading to the serum lipid profiles associated with ALC we were able to evaluate these lipids as potential biomarkers to identify those individuals with established liver disease. We were clearly able to show that serum lipid species can improve on traditional clinical characteristics in classification models. The model using only clinical characteristics gave a maximum AUC and accuracy with four clinical characteristics, with platelet count, albumin, INR and haemoglobin being most often included in these models. While models developed with lipid species alone gave similar results, the combination of lipid species with the clinical characteristics resulted in models where the maximum performance was obtained with a model containing 27 features, with platelet count, INR and haemoglobin being incorporated into these models along with multiple species of lip-ids (Table 4). The net reclassification index (NRI) of the mixed model relative to the model using clinical characteristics only was 4.1% which while modest, highlights the potential of lip-ids to add to clinical characteristics. Although many liplip-ids were associated with bilirubin, the lipids were preferentially incorporated to the model, over bilirubin, demonstrating their inde-pendent value to the model.
Study Limitations
Our long term goal is to identify early biomarkers of alcoholic liver disease, which could allow intervention before development of cirrhosis. We compared lipid profiles from AwLC patients (controls) to those with advanced alcoholic cirrhosis to determine lipid biomarkers for the identification of ALC within the high risk alcohol consuming group to provide the clearest lipid signature characteristic of disease progression. The current cohort is of moderate size and consists of patients with advanced ALC compared to AwLC. The large clinical difference between these groups may have resulted in inflated odds ratios because of spectrum bias [30], for some lipid species. We believe the inclusion of early stage alcoholic liver disease patients in future studies and the analysis of prospective cohorts will further strengthen our results. Vali-dation of lipid species identified in this study in patients with early stages of ALC is warranted as are studies to assess other forms of liver disease with different etiologies. For classification modelling, we have employed a 3-fold cross-validation framework repeated 200 times to resample the data to overcome the limited sample size available. We have assessed the perfor-mance of the classification models by computing a number of perforperfor-mance measures and their confidence intervals. The gain in AUC and NRI values demonstrate the value of lipid species as features in the classification model over clinical characteristics. We were however, unable to obtain an independent validation cohort to confirm the performance of the classification model.
Supporting Information
S1 File. Anonymized Data—ALC Study. (XLSX)
S1 Table. Inclusion / Exclusion selection criteria for cases and controls. (DOCX)
S2 Table. Association of lipid species with alcoholic liver cirrhosis. (DOCX)
Acknowledgments
We wish to thank Jacquelyn Weir, Natalie Mellett and Michelle Cinel for assistance with the lipid analysis.
Author Contributions
Conceived and designed the experiments: PJM GW AMPD PSH JBW DS. Performed the experiments: KR KH CKB. Analyzed the data: PJM PAM GW KH DS. Contributed reagents/ materials/analysis tools: PJM PAM GW KR KH DS. Wrote the paper: PJM PAM DS. Reviewed the manuscript: GW KR KH CKB AMPD PSH JBW.
References
1. NIH National Institute in Alcohol Abuse and Alcoholism.
2. Seitz HK, Stickel F (2006) Risk factors and mechanisms of hepatocarcinogenesis with special empha-sis on alcohol and oxidative stress. Biol Chem 387: 349–360. PMID:16606331
3. Lakshman MR (2004) Some novel insights into the pathogenesis of alcoholic steatosis. Alcohol 34: 45–48. PMID:15670665
5. Boros LG, Deng Q, Pandol SJ, Tsukamoto H, Go VL, Lee WN (2009) Ethanol diversely alters palmitate, stearate, and oleate metabolism in the liver and pancreas of rats using the deuterium oxide single tracer. Pancreas 38: e47–52. PMID:19248221
6. Siler SQ, Neese RA, Hellerstein MK (1999) De novo lipogenesis, lipid kinetics, and whole-body lipid balances in humans after acute alcohol consumption. Am J Clin Nutr 70: 928–936. PMID:10539756
7. Clugston RD, Jiang H, Lee MX, Piantedosi R, Yuen JJ, Ramakrishnan R, et al. (2011) Altered hepatic lipid metabolism in C57BL/6 mice fed alcohol: a targeted lipidomic and gene expression study. J Lipid Res 52: 2021–2031. doi:10.1194/jlr.M017368PMID:21856784
8. Zhao Z, Yu M, Crabb D, Xu Y, Liangpunsakul S (2011) Ethanol-induced alterations in fatty acid-related lipids in serum and tissues in mice. Alcohol Clin Exp Res 35: 229–234. doi:10.1111/j.1530-0277.2010. 01338.xPMID:21058963
9. Banerji MA, Buckley MC, Chaiken RL, Gordon D, Lebovitz HE, Kral JG (1995) Liver fat, serum triglycer-ides and visceral adipose tissue in insulin-sensitive and insulin-resistant black men with NIDDM. Int J Obes Relat Metab Disord 19: 846–850. PMID:8963350
10. Ryysy L, Hakkinen AM, Goto T, Vehkavaara S, Westerbacka J, Halavaara J, et al. (2000) Hepatic fat content and insulin action on free fatty acids and glucose metabolism rather than insulin absorption are associated with insulin requirements during insulin therapy in type 2 diabetic patients. Diabetes 49: 749–758. PMID:10905483
11. Mayerson AB, Hundal RS, Dufour S, Lebon V, Befroy D, Cline GW, et al. (2002) The effects of rosiglita-zone on insulin sensitivity, lipolysis, and hepatic and skeletal muscle triglyceride content in patients with type 2 diabetes. Diabetes 51: 797–802. PMID:11872682
12. Bajaj M, Suraamornkul S, Pratipanawatr T, Hardies LJ, Pratipanawatr W, Glass L, et al. (2003) Pioglita-zone reduces hepatic fat content and augments splanchnic glucose uptake in patients with type 2 dia-betes. Diabetes 52: 1364–1370. PMID:12765945
13. Hart CL, Batty GD, Morrison DS, Mitchell RJ, Smith GD (2010) Obesity, overweight and liver disease in the Midspan prospective cohort studies. Int J Obes (Lond) 34: 1051–1059. doi:10.1038/ijo.2010.20 PMID:20142829
14. Liu B, Balkwill A, Reeves G, Beral V (2010) Body mass index and risk of liver cirrhosis in middle aged UK women: prospective study. BMJ 340: c912. doi:10.1136/bmj.c912PMID:20223875
15. Meikle PJ, Wong G, Barlow CK, Weir JM, Greeve MA, Macintosh GL, et al. (2013) Plasma Lipid Profil-ing Shows Similar Associations with Prediabetes and Type 2 Diabetes. PLoS One 8: e74341. doi:10. 1371/journal.pone.0074341PMID:24086336
16. Weir JM, Wong G, Barlow CK, Greeve MA, Kowalczyk A, Almasy L, et al. (2013) Plasma lipid profiling in a large population-based cohort. J Lipid Res 54: 2898–2908. doi:10.1194/jlr.P035808PMID: 23868910
17. Saunders JB, Aasland OG, Babor TF, de la Fuente JR, Grant M (1993) Development of the Alcohol Use Disorders Identification Test (AUDIT): WHO Collaborative Project on Early Detection of Persons with Harmful Alcohol Consumption—II. Addiction 88: 791–804. PMID:8329970
18. Benjamini Y, Hochberg Y (1995) Controlling the false discovery rate: a practical and powerful approach to multiple testing. Journal of the Royal Statistical Society Series B (Methodological). pp. 289–300.
19. Kononenko I, Simec E, Robnik- Sikonja M (1997) Overcoming the Myopia of Inductive Learning Algo-rithms with RELIEFF. Applied Intelligence 7: 39–55.
20. Chang C-C, Lin C-J (2011) LIBSVM: A library for support vector machines. ACM Trans Intell Syst Tech-nol 2: 1–27.
21. Lieber CS (1992) Medical and nutritional complications of alcoholism: mechanisms and management: Plenum Medical Book Co.
22. Rasineni K, Casey CA (2012) Molecular mechanism of alcoholic fatty liver. Indian J Pharmacol 44: 299–303. doi:10.4103/0253-7613.96297PMID:22701235
23. Uthus EO, Skurdal DN, Cornatzer WE (1976) Effect of ethanol ingestion on choline phosphotransferase and phosphatidyl ethanolamine methyltransferase activities in liver microsomes. Lipids 11: 641–644. PMID:186686
24. Savolainen MJ, Baraona E, Pikkarainen P, Lieber CS (1984) Hepatic triacylglycerol synthesizing activ-ity during progression of alcoholic liver injury in the baboon. J Lipid Res 25: 813–820. PMID:6491527
25. Nikkila K, Nissinen MJ, Gylling H, Isoniemi H, Miettinen TA (2008) Serum sterols in patients with pri-mary biliary cirrhosis and acute liver failure before and after liver transplantation. J Hepatol 49: 936– 945. doi:10.1016/j.jhep.2008.07.026PMID:18926587
27. Glaros EN, Kim WS, Quinn CM, Wong J, Gelissen I, Jessup W, et al. (2005) Glycosphingolipid accumu-lation inhibits cholesterol efflux via the ABCA1/apolipoprotein A-I pathway: 1-phenyl-2-decanoylamino-3-morpholino-1-propanol is a novel cholesterol efflux accelerator. J Biol Chem 280: 24515–24523. PMID:15890646
28. Tomita K, Teratani T, Suzuki T, Shimizu M, Sato H, Narimatsu K, et al. (2014) Acyl-CoA:cholesterol acyltransferase 1 mediates liver fibrosis by regulating free cholesterol accumulation in hepatic stellate cells. J Hepatol.
29. Ydreborg M, Lisovskaja V, Lagging M, Brehm Christensen P, Langeland N, Buhl MR, et al. (2014) A novel fibrosis index comprising a non-cholesterol sterol accurately predicts HCV-related liver cirrhosis. PLoS One 9: e93601. doi:10.1371/journal.pone.0093601PMID:24699777