Flower diversity and bee reproduction in
an arid ecosystem
Jimena Dorado1and Diego P. Va´zquez1,2
1Instituto Argentino de Investigaciones de Zonas A´ridas, Consejo Nacional de Investigaciones Cientı´ficas y Te´cnicas, Mendoza, Argentina
2Facultad de Ciencias Exactas y Naturales, Universidad Nacional de Cuyo, Mendoza, Argentina
ABSTRACT
Background:Diverse flower communities are more stable in floral resource production along the flowering season, but the question about how the diversity and stability of resources affect pollinator reproduction remains open. High plant diversity could favor short foraging trips, which in turn would enhance bee fitness. In addition to plant diversity, greater temporal stability of floral resources in diverse communities could favor pollinator fitness because such communities are likely to occupy the phenological space more broadly, increasing floral availability for pollinators throughout the season. In addition, this potential effect of flower diversity on bee reproduction could be stronger for generalist pollinators because they can use a broader floral spectrum. Based on above arguments we predicted that pollinator reproduction would be positively correlated to flower diversity, and to temporal stability in flower production, and that this relationship would be stronger for the most generalized pollinator species.
Materials and Methods:Using structural equation models, we evaluated the effect of these variables and other ecological factors on three estimates of bee reproduction (average number of brood cells per nest per site, total number of brood cells per site, and total number of nests per site), and whether such effects were modulated by bee generalization on floral resources.
Results:Contrary to our expectations, flower diversity had no effect on bee
reproduction, stability in flower production had a weakly negative effect on one of the bee reproductive variables, and the strength of the fitness-diversity relationship was unrelated to bee generalization. In contrast, elevation had a negative effect on bee reproduction, despite the narrow elevation range encompassed by our sites. Discussion:Flower diversity did not affect the reproduction of the solitary bees studied here. This result could stem from the context dependence of the diversity-stability relationship, given that elevation had a positive effect on flower diversity but a negative effect on bee reproduction. Although high temporal stability in flower production is expected to enhance pollinator reproduction, in our study it had a weakly negative—instead of positive—effect on the average number of brood cells per nest. Other environmental factors that vary with elevation could influence bee reproduction. Our study focused on a small group of closely-related bee species, which cautions against generalization of our findings to other groups of pollinators. More studies are clearly needed to assess the extent to which pollinator demography is influenced by the diversity of floral resources.
Submitted16 February 2016
Accepted22 June 2016
Published26 July 2016
Corresponding author Jimena Dorado,
[email protected] Academic editor
Giovanni Benelli
Additional Information and Declarations can be found on page 10
DOI10.7717/peerj.2250
Copyright
2016 Dorado & Vázquez
Distributed under
Subjects Biodiversity, Ecology, Ecosystem Science
Keywords Pollination, Bee fitness, Flower diversity
INTRODUCTION
There is a consensus that diversity enhances ecosystem functioning (Cardinale et al., 2012). Species diversity provides redundancy in function so that ecological processes are more stable in more diverse communities (MacArthur, 1955;Elton, 1958). In plant communities, the diversity–stability relationship has been well studied for biomass production (Caldeira et al., 2005;Tilman, Reich & Knops, 2006;Isbell, Polley & Willsey, 2009;Hector et al., 2010), and we have recently reported that diverse flower communities are also more temporally stable in terms of floral resource production (Dorado & Va´zquez, 2014). However, the question about how the diversity and stability of resources affect reproduction of pollinators remains open.
It is well known that ecosystem productivity is positively associated to species diversity (Cardinale et al., 2012). We propose that a similar effect of plant species diversity can be expected on population- and community-level productivity of pollinators (i.e., reproductive output or biomass), for several reasons. First, the probability that a resource species important for reproduction is present increases with species diversity (the “sampling effect”;Loreau, 2010). Second, greater plant diversity can lead to reduced foraging trip duration (e.g., Gathmann & Tscharntke, 2002), which could mean more energy available for reproduction (Minckley et al., 1994;Zurbuchen et al., 2010). Third, if different plant species in the community offer complementary resources (e.g., they cover non-overlapping nutritional needs of pollinators), greater plant diversity could mean a greater probability of meeting the nutritional needs of pollinators (see, e.g.,Williams & Tepedino, 2003). The effect of flower diversity on bee reproduction should be stronger for polylectic than oligolectic pollinators, given that the latter are more restricted in their diet. In addition to plant diversity, greater temporal stability of floral resources in diverse communities (Dorado & Va´zquez, 2014) could favor pollinator fitness because such communities are likely to occupy the phenological space more broadly than their species-poor counterparts, increasing floral availability for pollinators throughout the season. For example, in multi-species assemblages of herbaceous plants of the genusClarkia, diverse communities provide more resources along the flowering season, sustaining a higher number of pollinator individuals per plant (Moeller, 2004). Furthermore, a bumblebee study found that even if floral resources are abundant, high stability of floral resources throughout the flowering season is needed to enhance bumblebee fitness (Westphal, Steffan-Dewenter & Tscharntke, 2009;Rundlo¨f et al., 2014). Thus, both high flower abundance and high temporal stability of floral resources are likely to enhance pollinator reproduction (Mu¨ller et al., 2006;Westphal, Steffan-Dewenter & Tscharntke, 2009).
history, should also be accounted for, as they are known to influence species diversity (Potts et al., 2003;Grytnes & McCain, 2007;Dorado & Va´zquez, 2014). Structural equation modeling (SEM) represents an excellent tool to assess causal relationships among multiple variables simultaneously (Grace, 2006), as is the case in the present study.
Our aim is to study the effect of flower diversity and temporal stability of floral resources on the reproduction of a cavity nesting bee assemblage from the Monte desert in Argentina. Based on the above arguments, we expected to find that flower diversity and temporal stability of floral resources correlates positively to three estimates of bee reproduction at the population and community levels: average number of brood cells per nest per site, total number of brood cells per site, and total number of nests per site. We also expected to find a positive correlation between the strength of the reproductive output-diversity correlation and the degree of generalization of each bee species.
METHODS
Study area and sampling
This study was conducted in the Monte desert in Villavicencio Nature Reserve, located ca. 40 km north of Mendoza city, Argentina, during the 2008 flowering season (15 October–8 December 2008; authorized by Direccio´n de Recursos Naturales
Renovables de la Provincia de Mendoza, approval numbers 1130 and 646). We worked in fourteen 100200 m rectangular study sites (minimum and maximum distance between them were 1.11 and 14.13 km, respectively). These sites lie at 1,100–1,500 m above sea level, at the ecotone between the Monte desert and the Prepuna biomes (Ambrosetti, Del Vitto & Roig, 1986). The plant community is a 2 m tall shrubland dominated byLarrea divaricata(Zygophyllaceae),Zuccagnia punctata(Fabaceae),Prosopis flexuosa(Fabaceae), Condalia microphylla(Rhamnaceae), Acantholippia seriphioides(Verbenaceae), and Opuntia sulphurea(Cactaceae). We selected sites with different flower abundance, composition and diversity. The region suffers from recurrent fires, which are mostly human-caused and are in fact the most common human disturbance (E. L. Stevani, 2008, personal communication); the time elapsed since the last fire varied substantially among our study sites (Table S1).
Trap nest sampling
of nest parasitism recorded in our study we used instead the number of brood cells per nest as an estimate of female fitness. One species,Trichothurgus laticepsFriese, lacks brood cells, as females lay eggs bare amidst a pollen mass; thus, for this species we used the length of the trap cavity occupied by pollen as an estimate of the number of brood cells. For the analysis, we used only the seven bee species that occupied at least 30 trap nests, as we judged smaller sample sizes unreliable for statistical analyses.
Plant sampling
Floral resource availability was studied using flower density, as flowers represent the resource packages encountered by pollinators as they forage (see alsoVa´zquez, Chacoff & Gagnolo, 2009). Flower density was measured weekly at four 820 m plots and two 250 m transects per site, as described inFig. S1. We considered weekly sampling intervals adequate, as flowers in our system usually last less than a week. Flower density was estimated multiplying the mean number of flowers per individual by the total number of flowering individuals in the transect or plot when individuals could be distinguished (shrubs and some herbs); we estimated the number of flowers per individual in at least ten individuals of the site. When it was not possible to identify flowering individuals (some herbaceous species), all flowers in a plot or transect were counted. We included in the study all flowering plant species that were assumed to be animal pollinated (we excluded only grass species).
Statistical analysis
information criterion (AIC) using a small sampling size. The d-separation test involves calculating a probability of independence,pi, between two pairs of variables that are
not directly connected with an arrow in the causal model, and then using those probabilities to calculate Fisher’sCstatistic, which follows a chi-square distribution, C ¼ 2PKi¼1ðlnpiÞ(Shipley, 2000;Shipley, 2013). The group of allkpairs of independent variables with their corresponding conditional variables constitutes the basis set
(Table S2). Independence probability should be estimated using an appropriate test; in our case we used thep-value associated to Pearson’s partial correlation coefficient as an estimate ofpi. We then calculated the maximum likelihood estimate for each model using
theCvalue associated to each causal model, and the corrected Akaike’s Information Criterion as AIC = 2 lnC+ 2K, whereKis the total number of free parameters in the model and nis the sample size. To discriminate among competing models, we used the AIC difference, AIC, between a given model and the best-fitting one, i.e., that with the lowest value of AIC. WhenAIC < 3, models are generally considered to have substantial support; for 3 >AIC < 7, models are considered to have considerably less
support, while for AIC > 10, models have essentially no support relative to the best model of the set (Richards, 2005;Burnham & Anderson, 2010). We used meta-analytical methods to evaluate whether the studied effects were general for all bee species. To apply the meta-analytical methods, the path coefficients from the SEM models for each bee species were normalized by applying Fisher’sztransform,z= 0.5 ln [(1 +r)/(1-r)] (Zar, 1999) to make them comparable. To weigh the correlation coefficients, we divided them by the inverse of the sampling variance,w= 1/var(r) =N-3 (Rosenthal, 1991;
Zar, 1999;Gurevitch, Curtis & Jones, 2001). We used a bootstrap resampling procedure written in R (R Core Team, 2013), with a sample size of 1,00,000, with which we calculated the mean and 95% percentile confidence limits ofzw(Manly, 1997).
To evaluate whether the effect of flower diversity becomes stronger with increasing pollinator generalization, we performed Spearman’s rank correlations between the path coefficient representing the effect of flower richness on each of the three bee reproductive parameters mentioned above, and two measures of the corresponding species degree of generalization. We estimated the degree of diet generalization of each bee species using the species degree and Simpson’s diversity index; degree is simply the number of food species consumed from all sites polled, whereas Simpson’s index is a function of the number of food items and the proportion in which they were consumed. We used rarefaction to estimate both measures of generalization to make them comparable among bee species, as the number of brood cells was highly variable among nests. A positive correlation between the path coefficient of flower richness on bee reproduction and generalization would support our hypothesis that the reproduction of generalist pollinators is enhanced by flower richness.
All analyses were performed using R statistical software (R Core Team, 2013). Rarefaction of flower richness was performed using the rarefy function of the vegan package (Oksanen et al., 2013). Pearson’s partial correlations were performed using the pcor.test function of the ppcor package to obtain independence probabilities and the path coefficients (Kim & Yi, 2007;Kim & Yi, 2006;Johnson & Dean, 2002).
RESULTS
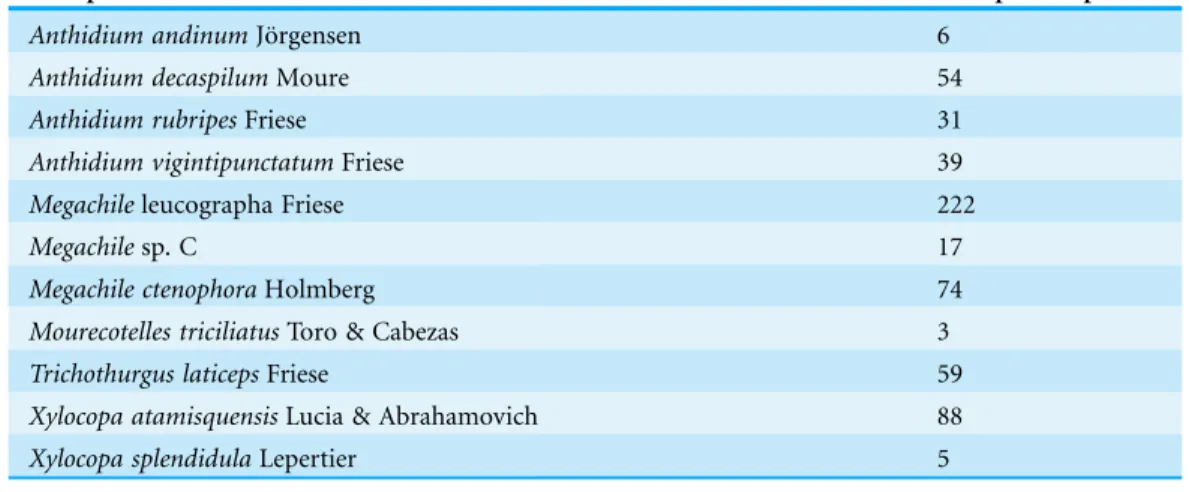
We recorded 598 occupied trap nests by 11 solitary bee species (Table 1).
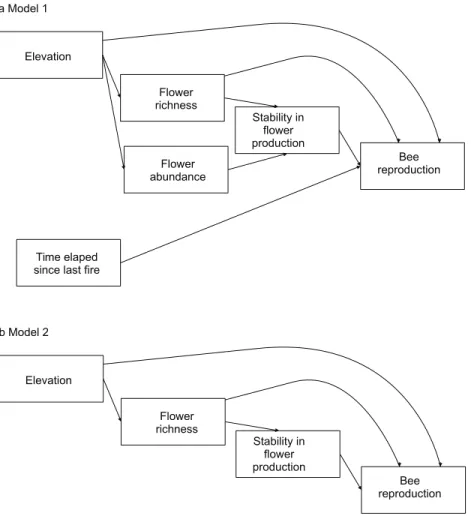
The complete model assessing the influence of multiple ecological factors on the potential relationship between flower diversity and bee reproduction at a community level (Model 1,Fig. 1A) showed a negative effect of elevation on bee reproductive variables, and no effect of the other evaluated factors on bee reproduction (Table 2).
however, none of these effects were statistically significant. The simplified model (Model 2, Fig. 1B) fitted best according toAIC (8.43) for all species (seeFigs. S1and1); this model fits the data well according to the d-separation test (p= 0.84,df= 2,C= 3.69). In this simplified model, the negative effect of temporal stability in flower production on the average number of cells per nest was weaker than in the complete model (Fig. 2blue error bars; confidence limits of path coefficient for Model 1:-0.467,-0.101; confidence limits of path coefficient of Model 2:-0.264,-0.004). Also, the simplified model shows a negative trend in the effect of elevation on the total number of cells and nests per site, but this trend is statistically non-significant (confidence limits of path coefficients for the total number of cells and nests per site respectively:-0.465, 0.031, and-0.472, 0.027).
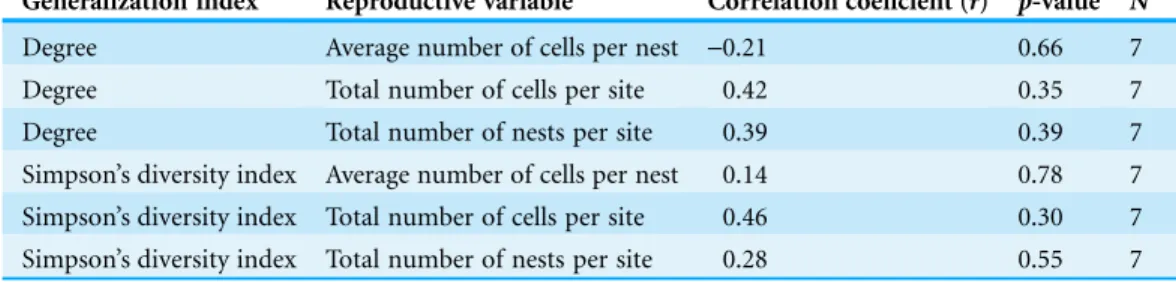
The effect of flower diversity on pollinator reproduction was unrelated to pollinator generalization for any of the bee reproductive variables and generalization indexes used (Table 3).
Table 1 Number of nests per species.We used in this study the species that had more than 30 nests.
Bee species Occupied trap nests
Anthidium andinumJo¨rgensen 6
Anthidium decaspilumMoure 54
Anthidium rubripesFriese 31
Anthidium vigintipunctatumFriese 39
Megachileleucographa Friese 222
Megachilesp. C 17
Megachile ctenophoraHolmberg 74
Mourecotelles triciliatusToro & Cabezas 3
Trichothurgus laticepsFriese 59
Xylocopa atamisquensisLucia & Abrahamovich 88
Xylocopa splendidulaLepertier 5
Table 2 Path coefficients of Models 1 for community bee reproduction.
Model Variables Path coefficients p-value
1 Elevation/Flower richness 0.39 0.15
Elevation/Flower abundance -0.51 0.06
Flower richness/Stability -0.54 0.04
Elevation/Total brood cells -0.59 0.03
Elevation/Total nests -0.57 0.04
Flower abundance/Total brood cells 0.26 0.43
Flower abundance/Total nests 0.24 0.48
Flower richness/Total brood cells 0.27 0.80
Flower richness/Total nests 0.38 0.23
Stability/Total brood cells 0.35 0.35
Stability/Total nests 0.30 0.35
Time elapsed since last fire/Total brood cells 0.35 0.28
DISCUSSION
Contrary to our expectations, we found no effects of flower diversity and flower abundance on bee reproduction, either at the community or at the species level. Thus, flower diversity did not matter for the reproduction of the solitary bees studied here. Average cells Total cells Total nests
−0.4 −0.2 0.0 0 .2 0.4 Flower diversity P ath coeffients
Average cells Total cells Total nests
−0.6 −0.4 −0.2 0.0 0 .2 0.4
Flower diversity total effect
P
ath coeffients
Average cells Total cells Total nests
−0.6 −0.4 −0.2 0.0 0.2 Temporal stability P ath coeffients
Average cells Total cells Total nests
−0.6 −0.4 −0.2 0 .0 0.2 0 .4 Elevation P ath coeffients
Average cells Total cells Total nests
−0.6 −0.4 −0.2 0 .0 0.2 0 .4
Elevation total effect
P
ath coeffients
Figure 2 Box-plot summarizing the path coefficients of Model 2 (seeFig. 1) for the seven bee species studied here.In each box plot, the middle line indicates median, box limits are the first and third quartiles, whiskers indicate most extreme points1.5 times the interquartile range, and circles indicate outliers of the seven path coefficients of the corresponding effect. Model 2 describes the effect of flower diversity (estimated using flower richness), temporal stability of flower production along the flowering season (estimated as the inverse of the coefficient of variation of the weekly flower abundance mean), and elevation (m above sea level) on three bee reproductive variables: “Average cells,” the average number of brood cells per nest per site; “Total cells,” the total number of brood cells per site; and “Total nests,” the total number of nests per site. The ordinates represent the path coefficients; the abscissa represent the effect of the above ecological variables on bee reproductive variables. Blue error bars are the ninety-five percent confidence limits of path coefficients obtained from bootstrap sampling of the distribution of path coefficients.
Table 3 Correlation coefficients between effect of flower diversity on pollinator reproduction and bee generalization.
Generalization index Reproductive variable Correlation coeficient (r) p-value N
Degree Average number of cells per nest -0.21 0.66 7
Degree Total number of cells per site 0.42 0.35 7
Degree Total number of nests per site 0.39 0.39 7
Considering the ecosystem functioning context where relationships are commonly saturating (Cardinale et al., 2012), there is a possibility that we have sampled plant diversities corresponding only to the saturating part of the diversity-productivity curve. In addition, this result could stem from the context dependence of the diversity-stability relationship (Griffin et al., 2010), given that elevation had a positive effect on flower diversity (Dorado & Va´zquez, 2014) but a negative effect on bee reproduction (Table 2). This trend in the effect of elevation on bee reproduction was observed despite the narrow elevation range encompassed by our sites (1,100–1,500 m), which suggests that the environmental conditions of the study sites could have influenced the relationship between floral diversity and bee reproduction.
An explanation of the negative effect of temporal stability on brood cell production concerns a compensatory behavior of females to avoid parasitism. In sites with high temporal stability in flower production, females might lay fewer eggs per nest while building more nests, so as to maximize larval survival per site. This reasoning makes two implicit assumptions. First, that the bee species are parasitized, which we indeed observed for many of the bee species studied here. Second, that nesting sites are not limited for the population. In fact, the trap nest sampling with replacement highly increased the nest availability in our study sites. If this mechanism were responsible for the observed negative effect of temporal stability in flower production on the average number of brood cells per nest, we would expect the number of cells per site to be either unrelated to temporal stability or to be higher in the more temporally stable sites, and the number of nests to be higher in the more temporally stable sites, as females would be laying eggs at their maximum capacity but distributing them in more nests. Matching these expectations, the total number of brood cells per site was unrelated to temporal stability (Fig. 2, flower stability), while the number of nests per site tends to increase with temporal stability for most species, although the effect was statistically non-significant.
An alternative explanation of the negative effect of temporal stability on brood cell production per nest could be that elevation might be weakening the effects of other variables on pollinator reproduction. This is particularly likely considering the positive direct effect of elevation on flower diversity, the positive indirect effect of elevation on stability, and the negative effect of elevation on bee reproduction (Table 2 andFig. 2); these effects could be neutralizing the effect of the flower diversity and temporal stability in flower production on bee reproduction. The upper sites are located at the mouth of ravines, which are probably wetter and cooler than the lower sites, located in open land. Thus, changes in humidity and temperature associated to elevation could be influencing bee reproduction more strongly than the other ecological factors studied here.
diversity and stability when there is context dependency, given our finding of no general effects of flower diversity on bee reproduction.
Although there is a consensus that diversity promotes ecosystem-level productivity (Cardinale et al., 2012), we failed to find this relationship at the community and population levels in our study. However, our study focused on a small group of closely-related bee species, representing less than 5% of the pollinator assemblage in our study area (Chacoff et al., 2012). Our study is in this sense limited, and our finding of no effects of floral diversity on pollinator demography cannot be generalized. More studies are clearly needed to assess the extent to which pollinator demography is influenced by the diversity of floral resources. These studies are becoming priority, as wild bees are known to enhance fruit production in crops, beyond the pollination service provided by honeybees (Garibaldi et al., 2013). Furthermore, although we have considered environmental factors, such as elevation or time post-fire, which appeared a priori good candidates to influence bee demography, other environmental factors may also be important. These include humidity and temperature, which should covary with elevation, and other biotic factors such as competition, predation and parasitism.
ACKNOWLEDGEMENTS
We thank the administration of Villavicencio Natural Reserve for permission to
conduct this study, the park rangers for help to find appropriated study sites in the field, Arturo Roig for help with bee identifications, Leticia Escudero, Nydia Vitale and Georgina Amico for laboratory assistance, and members of the Ecological Interactions Lab for helpful comments on the manuscript. JD is a postdoctoral fellow and DPV a career researcher with CONICET.
ADDITIONAL INFORMATION AND DECLARATIONS
Funding
Research was funded through grants from CONICET (PIP 6564), FONCYT (PICT 20805, 1471 and 2010-2779), and BBVA Foundation (BIOCON03-162). The funders had no role in study design, data collection and analysis, decision to publish, or preparation of the manuscript.
Grant Disclosures
The following grant information was disclosed by the authors: CONICET: PIP 6564.
FONCYT: PICT 20805, 1471 and 2010-2779. BBVA: BIOCON03-162.
Competing Interests
Author Contributions
Jimena Dorado conceived and designed the study, conducted fieldwork, analyzed the data, and wrote the paper, prepared figures and/or tables.
Diego P. Va´zquez conducted fieldwork, and reviewed drafts of the paper, supervised the work for this article in his capacity as Ph.D. advisor.
Field Study Permissions
The following information was supplied relating to field study approvals (i.e., approving body and any reference numbers):
Direccio´n de Recursos Naturales Renovables de la Provincia de Mendoza 1130 and 646.
Data Deposition
The following information was supplied regarding data availability: The raw data was supplied asSupplemental Dataset Files.
Supplemental Information
Supplemental information for this article can be found online athttp://dx.doi.org/ 10.7717/peerj.2250#supplemental-information.
REFERENCES
Ambrosetti JA, Del Vitto LA, Roig F. 1986.La Vegetacio´n del paso de Uspallata, provincia de Mendoza, Argentina.Ber Geobotanisches Inst ETH Stift Ru¨bel Zu¨rich91:141–180.
Burnham KP, Anderson DR. 2010.Model Selection and Multimodel Inference: A Practical Information-Theoretic Approach. 2nd edition. New York: Springer-Verlag.
Caldeira MC, Hector A, Loreau M, Pereira JS. 2005.Species richness, temporal variability and resistance of biomass production in a Mediterranean grassland.Oikos110(1):115–123
DOI 10.1111/j.0030-1299.2005.13873.x.
Cardinale BJ, Duffy JE, Gonzalez A, Hooper DU, Perrings C, Venail P, Narwani A, Mace GM, Tilman D, Wardle DA, Kinzig AP, Daily GC, Loreau M, Grace JB, Larigauderie A, Srivastava DS, Naeem S. 2012.Biodiversity loss and its impact on humanity.Nature486(7401):59–67
DOI 10.1038/nature11148.
Chacoff NP, Va´zquez DP, Loma´scolo SB, Stevani EL, Padro´n B. 2012.Evaluating sampling completeness in a desert plant–pollinator network.Journal of Animal Ecology81(1):190–200
DOI 10.1111/j.1365-2656.2011.01883.x.
Dorado J, Va´zquez DP. 2014.The diversity–stability relationship in floral production.Oikos
123(9):1137–1143DOI 10.1111/oik.00983.
Dorado J, Va´zquez DP, Stevani EL, Chacoff NP. 2011.Rareness and specialization in plant-pollinator networks.Ecology92(1):19–25DOI 10.1890/10-0794.1.
Elton CS. 1958.The Ecology of Invasions by Animals and Plants. With a new foreward by Daniel Simberloff 2000. Chicago, IL: University of Chicago Press.
Holzschuh A, Howlett B, Isaacs R, Javorek SK, Kennedy CM, Krewenka KM, Krishnan S, Mandelik Y, Mayfield MM, Motzke I, Munyuli T, Nault BA, Otieno M, Petersen J, Pisanty G, Potts SG, Rader R, Ricketts TH, Rundlo¨f MLU, Seymour CL, Schueepp C, Szentgyo¨rgyi H, Taki H, Tscharntke T, Vergara CH, Viana BF, Wanger TC, Westphal C, Williams N, Klein AM. 2013.Wild pollinators enhance fruit set of crops regardless of honey bee abundance.
Science339(6127):1608–1611DOI 10.1126/science.1230200.
Gathmann A, Tscharntke T. 2002.Foraging ranges of solitary bees.Journal of Animal Ecology
71(5):757–764DOI 10.1046/j.1365-2656.2002.00641.x.
Grace JB. 2006.Structural Equation Modeling and Natural Systems. New York: Cambridge University Press, pp. 365.
Griffin JN, O’Gorman EJ, Emmerson MC, Jenkins SR, Klein A-M, Loreau M, Symstad A. 2010.
Biodiversity and the stability of ecosystem functioning. In: Naeem S, Bunker DE, Hector A, Loreau M, Perrings C, eds.Biodiversity, Ecosystem Functioning, and Human Wellbeing. New York: Oxford University Press, 78–93.
Gurevitch J, Curtis PS, Jones MH. 2001.Meta-analysis in ecology.Advances in Ecological Research
32:199–247DOI 10.1016/S0065-2504(01)32013-5.
Grytnes JA, McCain CM. 2007.Elevational patterns in species richness. In: Levin S, ed.
Encyclopedia of Biodiversity. Amsterdam: Elsevier, Inc., 1–8.
Hector A, Hautier Y, Saner P, Wacker L, Bagchi R, Joshi J, Scherer-Lorenzen M, Spehn EM, Bazeley-White E, Weilemann M, Caldeira MC, Dimitrakopoulos PG, Finn JA, Huss-Danell K, Jumpponen A, Mulder CPH, Palmborg C, Pereira JS, Siamantziouras ASD, Terry AC, Troumbis AY, Schmid B, Loreau M. 2010.General stabilizing effects of plant diversity on grassland productivity through population asynchrony and over yielding.Ecology
91(8):2213–2220DOI 10.1890/09-1162.1.
Isbell FI, Polley HW, Willsey BJ. 2009.Biodiversity, productivity and the temporal stability of productivity: patterns and processes.Ecology Letters12(5):443–451
DOI 10.1111/j.1461-0248.2009.01299.x.
Johnson RA, Dean WW. 2002.Applied Multivariate Statistical Analysis. Upper Saddle River, NJ: Prentice Hall, Inc.
Kim SH, Yi S. 2007.Understanding relationship between sequence and functional evolution in yeast proteins.Genetica131(2):151–156DOI 10.1007/s10709-006-9125-2.
Kim SH, Yi S. 2006.Correlated asymmetry of sequence and functional divergence
between duplicate proteins of Saccharomyces cerevisiae.Molecular Biology and Evolution
23(5):1068–1075DOI 10.1093/molbev/msj115.
Loreau M. 2010.Linking biodiversity and ecosystems: towards a unifying ecological theory.
Philosophical Transactions of Royal Society B: Biological Sciences365(1537):49–60
DOI 10.1098/rstb.2009.0155.
MacArthur R. 1955.Fluctuations of animal populations and a measure of community stability.
Ecology36(3):533–536DOI 10.2307/1929601.
Maestre FT, Bowker MA, Escolar C, Puche MD, Soliveres S, Maltez-Mouro S, Garcı´a-Palacios P, Castillo-Monroy AP, Martı´nez I, Escudero A. 2010.Do biotic interactions modulate ecosystem functioning along stress gradients? Insights from semi-arid plant and biological soil crust communities. Philosophical Transactions of the Royal Society B: Biological Sciences 365(1549):2057–2070
DOI 10.1098/rstb.2010.0016.
Minckley RL, Wcislo WT, Yanega D, Buchmann SL. 1994.Behavior and phenology of a specialist bee (Dieunomia) and sunflower (Helianthus) pollen availability.Ecology75(5):1406–1419
DOI 10.2307/1937464.
Moeller D. 2004.Facilitative interactions among plants via shared pollinators.Ecology
85(12):3289–3301DOI 10.1890/03-0810.
Mu¨ller A, Diener S, Shnyder S, Stuts K, Sedivy C, Dorn S. 2006.Quantitative
pollen requirements of solitary bees: implications for bee conservation and the evolution of bee–flower relationships.Biological Conservation130(4):604–615
DOI 10.1016/j.biocon.2006.01.023.
Oksanen J, Blanchet FG, Kindt R, Legendre P, Minchin PR, O’Hara RB, Simpson GL, Solymos P, Stevens MHH, Wagner H. 2013.Vegan: Community Ecology Package. R package version 2.0-8.
Available athttp://CRAN.R-project.org/package=vegan.
Potts SG, Vulliamy B, Dafni A, Ne’eman G, O’Toole C, Roberts S, Willmer P. 2003.Response of plant-pollinator communities to fire: changes in diversity, abundance and floral reward structure.Oikos101(1):103–112DOI 10.1034/j.1600-0706.2003.12186.x.
R Core Team. 2013.R: a language and environment for statistical computing. Vienna, Austria: R Foundation for Statistical Computing.Available athttp://www.R-project.org/.
Richards SA. 2005.Testing ecological theory using the information-theoretic approach: examples and cautionary results.Ecology86(10):2805–2814DOI 10.1890/05-0074.
Rosenthal R. 1991.Meta-Analysis Procedures for Social Research. Newbury Park, CA: Sage Publications.
Rundlo¨f M, Persson AS, Smith HG, Bommarco R. 2014.Late-season mass-flowering red clover increases bumble bee queen and male densities.Biological Conservation172:138–145
DOI 10.1016/j.biocon.2014.02.027.
Shipley B. 2000.Cause and correlation in biology: a user’s guide to path analysis, structural equations, and causal inference. Cambridge: Cambridge University Press.
Shipley B. 2013.The AIC model selection method applied to path analytic models compared using a d-separation test.Ecology94(3):560–564DOI 10.1890/12-0976.1.
Tilman D, Reich PB, Knops JMH. 2006.Biodiversity and ecosystem stability in a decade-long grassland experiment.Nature441(7093):629–632DOI 10.1038/nature04742.
Tilman D. 1999.Diversity by default.Science283(5401):495–496
DOI 10.1126/science.283.5401.495.
Va´zquez DP, Chacoff NP, Gagnolo L. 2009.Evaluating multiple determinants of the structure of plant–animal mutualistic networks.Ecology90(8):2039–2046DOI 10.1890/08-1837.1.
Va´zquez DP, Loma´scolo SB, Maldonado MB, Chacoff NP, Dorado J, Stevani EL, Vitale NL. 2012.
The strength in plant–pollination interactions.Ecology93(4):719–725DOI 10.1890/11-1356.1.
Westphal C, Steffan-Dewenter I, Tscharntke T. 2009.Mass flowering oilseed rape improves early colony growth but not sexual reproduction of bumblebees.Journal of Applied Ecology
46(1):187–193DOI 10.1111/jpe.2009.46.issue-1.
Williams NM, Tepedino VJ. 2003.Consistent mixing of near and distant resources in foraging bouts by the solitary mason beeOsmia lignaria.Behavioral Ecology14(1):141–149
DOI 10.1093/beheco/14.1.141.
Zar JH. 1999.Biostatistical Analysis. Upper Saddle River, NJ: Prentice Hall, Inc.
Zurbuchen A, Cheesman S, Klaiber J, Mu¨ller A, Hein S, Dorn S. 2010.Long foraging distances impose high costs on offspring production in solitary bees.Journal of Animal Ecology