Croat. Chem. Acta 88 (1) (2015) 23–33.
http://dx.doi.org/10.5562/cca2398
Original Scientific Article
Availability of Selected (Pollutant) Elements and their Influence on Soil
Composition in Urban Area
Michaela Zeiner,a,* Iva Juranović Cindrić,b Marina Ivanović,c Gordana Medunić,d Štefica Kampić,d Nenad Tomašić,d and Gerhard Stingedera
a
Division of Analytical Chemistry, Department of Chemistry, BOKU – University of Natural Resources and Life Sciences, Muthgasse 18, 1190 Vienna, Austria b
Laboratory of Analytical Chemistry, Faculty of Science, University of Zagreb, Horvatovac 102a, 10000 Zagreb, Croatia c
Institute of Mineralogy and Petrology, Department of Geology, Faculty of Science, University of Zagreb, Horvatovac 95, 10000 Zagreb, Croatia
RECEIVED NOVEMBER 21, 2013; REVISED FEBRUARY 14, 2014; ACCEPTED JULY 7, 2014
Abstract. Interest in growing fruits and vegetables in private gardens is rising due to nowadays ecological awareness. Avoiding artificial fertilizers and plant protection products does not guarantee the absence of toxic substances, especially heavy metals in the soil and thus in the fruits harvested. Due to either geologi-cal bedrock weathering or environmental pollution, garden soils may be rich in certain potentially toxic elements. In the present study ten garden soils from central Croatia have been analysed by the BCR method for the contents and bioavailability of aluminium, cadmium, chromium, cobalt, copper, lead, manganese, nickel and zinc.
The total amounts of the elements are in the concentration range as reported for agricultural soils in dif-ferent geographical regions. Only two soils of the capital Zagreb have higher concentrations of pollutant metals, such as chromium, cobalt, copper, lead, manganese and zinc. Regarding nutrients, all soils have met the needs of common garden plants.
Keywords: BCR; ICP-AES; heavy metals; plant nutrients; garden soils; pollutants
INTRODUCTION
The importance of home gardening is rising in the last years due to the elevated ecological awareness. Fertil-izers and plant protection products are considered to lower food quality by their specific toxic properties. Organic farming represents growing plants without synthetic fertilizers and pesticides or genetically mo-dified organisms; however, the inorganic composition of the soils is not regulated.1 Only general limits of levels in soils used for agricultural purposes are given by different jurisdictions.2,3 In general, plants are use-ful indicators of environmental heavy metal contami-nation and can be used to monitor pollution across both spatial and temporal scales.4 Fruits produced by organic agriculture in private gardens may also con-tain toxic elements, such as cadmium, lead, and arse-nic due to contamination via air or by uptake from polluted soils.
The favorite products of home gardening are vege-tables, like tomatoes and lettuce, and fruits, especially
many types of berries, e.g. strawberries, blackberries, raspberries and currants.
Each of these plants has special requirements re-garding micro-nutrients and trace elements, i.e. vitamins or minerals needed in small amounts for normal func-tion of the organism. That a micro-nutrient is essential is indicated by its presence in healthy tissue and that its uptake and distribution are homeostatic control. Only small amounts of such nutrients are needed and any deficiency can cause diseases or ill-health, retarded growth and poor harvest. Plants require the following elements: nitrogen (N), phosphorus (P), calcium (Ca), magnesium (Mg), manganese (Mn), iron (Fe), boron (B), copper (Cu), zinc (Zn), and aluminium (Al).5
via their roots. Additional sources of these elements are environmental parameters, such as rainfall, atmospheric dusts (dry deposition), plant protection agents and fertil-izers that can be absorbed through their leaves.6 Soil analysis is important since the chemical composition of soil reflects both the soil bedrock and the anthropogenic inputs such as pollutants from industrial processes. Information on the mobility or bioavailability of metals however is scant, and special extractions steps are needed to determine the bioavailability of the elements in the plant.7 The most frequently applied method is recommended by the European Commission, Commu-nity Bureau of Reference (BCR) for sediments and soils, due to its simplicity.8
The aim of the present study was the quantitative determination of the elemental content of ten private garden soils from central Croatia. Toxic as well as es-sential elements were selected, namely Al, Cd, Co, Cr, Cu, Fe, K, Mg, Mn, Ni, Pb, and Zn. Their availability was studied by the BCR method.
MATERIALS AND METHODS
Soil Samples
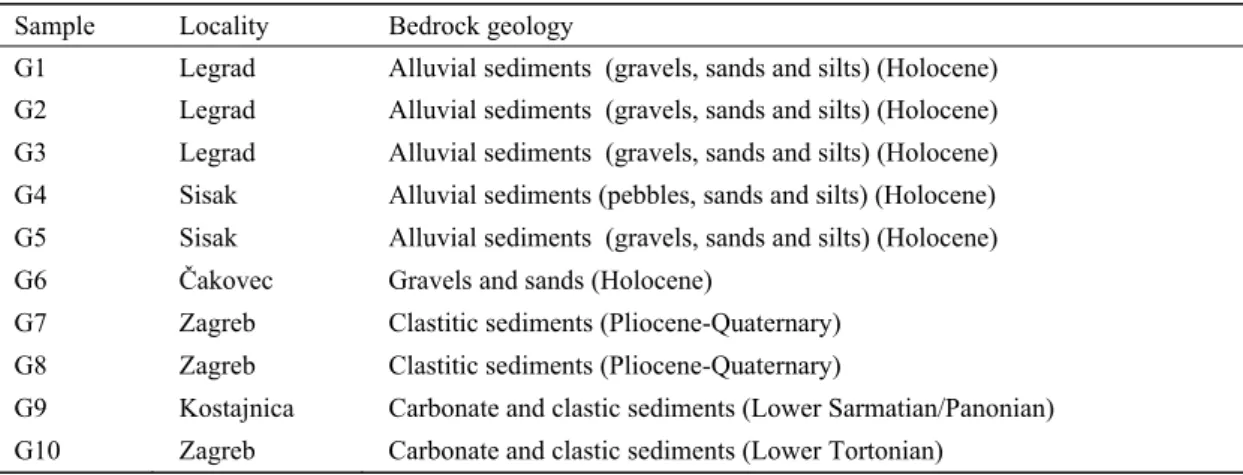
The garden soil samples from the A-horizon were col-lected in September 2009 at ten sampling sites in Za-greb and its surroundings (see Figure 1). The bedrock
geology of the sampling sites is shown in Table 1. After collection the soil samples were dried for 24 hours at 105 °C, ground with a metal-free device and stored at a cool place.
Chemicals and Glassware
Nitric acid (HNO3; 65 % w/w p.a.) and the ICP Mul-tielement Standard IV, both from Merck (Darmstadt, Germany), were used to prepare the standard calibration solutions as well as for the digestion step. The reagents for the extraction steps, i.e. acetic acid (CH3COOH), hydroxylamine hydrochloride (NH2OH×HCl), hydrogen peroxide (H2O2), ammonium acetate (NH4C2H3O2) and hydrochloric acid (HCl) were analytical grade and pur-chased from Kemika (Zagreb, Croatia). Before use all glassware was soaked in 7 mol/L nitric acid for 24 hours, and then rinsed with supra-pure water.
Extraction Procedure
tions were as in step 1. Step 3 (the oxidisable fraction) was prepared by adding of 10 mL of 8.8 mol/L hydro-gen peroxide and 50 mL of 1.0 mol/L ammonium acetate (pH = 2) to the residue from step 2 and by using again the same extraction conditions as above. Finally, the residue from step 3 was leached with aqua regia. The extracts from each step were separated from the solid by centrifugation (3000 rpm for 20 min), decanted into polyethylene bottles and stored at 4°C until analysed.
ICP-AES Measurements
The instrument used was a Prodigy High Dispersive ICP spectrometer operating in simultaneous mode; at set-tings listed in Table 2. All measurements were carried out in triplicate at the emission lines shown in Table 3.
The calibration standard solutions at concentra-tions of 0.05, 0.10, 0.20, 0.50, 1.0, 2.0, and 5.0 mg/L
were prepared in 2 % w/w HNO3 from a multi-element standard stock solution (1000 mg/L).
For all analytes and all types of samples the re-peatability and precision of the method were deter-mined. The sensitivity of the method was estimated from the slope of the calibration curve. The accuracy was estimated from the recovery of the analytes from the extraction solutions spiked at 0.5 and 2 mg/L. Stan-dard reference materials supplied by the International Atomic Energy Agency (Vienna, Austria) were treated and measured like the samples: IAEA-SL1 (lake sedi-ment), IAEA-Soil 7, IAEA 405 (stream sediments) and IAEA SL 3 (lake sediment).
RESULTS AND DISCUSSION
ICP-AES Validation
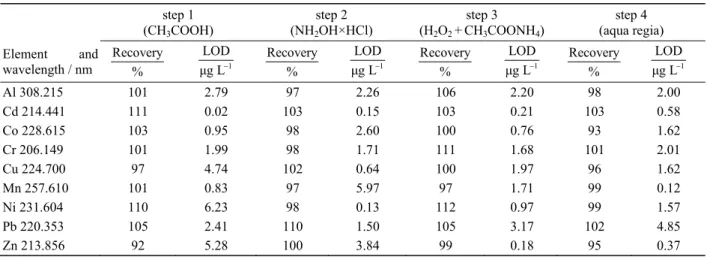
The accuracy of the method was evaluated by determin-ing the recoveries by the analysis of CRMs and by spik-ing experiments of all analytes in the extracts of all four extraction steps. The mean recoveries of both concentra-tions range from 90–112 % and are listed in Table 3 along with their limit of detection (LOD). Regarding the tested CRMs the recoveries ranged from 87 to 110 % for the certified elements. Except for a few elements in single steps all LODs are < 3 μg/L. The precision for all elements ranged from 0.5 to 2.4 % in the four extraction steps. The repeatability was < 1.3 %, the intermediate precision < 5.7 %, the day-to-day reproducibility < 6.8 % and the overall uncertainty of measurement was esti-mated to be 4–8.5 % for all elements analysed.10 The validation of analytical procedure optimized was found to be acceptable for environmental analyses.11
Metal Content and Extractability
The results (expressed in µg/g soil) for each extraction step together with the percentage extracted per step are Table 1. Bedrock geology of the sampling area for the investigated soil samples
Sample Locality Bedrock geology
G1 Legrad Alluvial sediments (gravels, sands and silts) (Holocene) G2 Legrad Alluvial sediments (gravels, sands and silts) (Holocene) G3 Legrad Alluvial sediments (gravels, sands and silts) (Holocene) G4 Sisak Alluvial sediments (pebbles, sands and silts) (Holocene) G5 Sisak Alluvial sediments (gravels, sands and silts) (Holocene) G6 Čakovec Gravels and sands (Holocene)
G7 Zagreb Clastitic sediments (Pliocene-Quaternary) G8 Zagreb Clastitic sediments (Pliocene-Quaternary)
G9 Kostajnica Carbonate and clastic sediments (Lower Sarmatian/Panonian) G10 Zagreb Carbonate and clastic sediments (Lower Tortonian)
Table 2. ICP-AES operating conditions
Instrument Prodigy High Dispersive ICP
Spectrometer
High resolution echelle polychromator Large format programmable array detector (L-PAD)
RF-Generator 40 MHz “free-running” Output power 1.1 kW
Argon flow
Coolant:18 L/min Auxiliary: 0.8 L/min Nebulizer: 1 L/min Peristaltic pump 1.0 mL/min
Nebulizer Pneumatic (glass concentric) Spray chamber Glass cyclonic
Plasma viewing Axial Replicates for
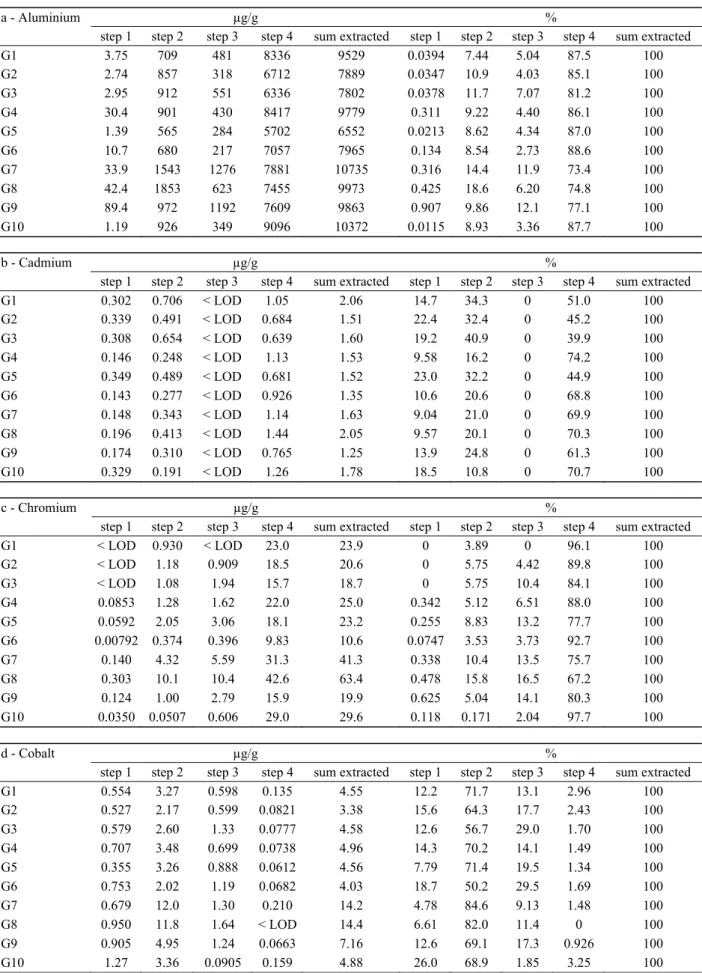
listed for all elements investigated in Table 4 a–l. Each element is discussed separately. The elemental soil composition (Figure 2) shows the median total amounts of the metals analysed. The extraction behavior of all elements is compared by cluster analysis (Figure 3). Aluminium and chromium (three valent ions) are grouped together in all steps except in step 3. Each extraction step showed a different pattern.
Aluminium
Aluminium, one of the most important non-essential elements in soils, can affect the development of plant roots and reduce the plant’s growth rate.12 The total amounts of aluminium ranged from 6.5 to 10.7 mg/g dry soil, while 73–89 % were not extracted. This can be
attributed to the high binding affinity of Al to humic substances.12 Only less than 1 % was leached by acetic acid. In step 2, 7–11 % were extracted except from soils G7 and G8 with 14 % and 19 %, respectively. In the oxidisable fraction 2.7 up to 12 % were extracted, with a median of 4.7 %. Similar extraction behaviour was also described by Li et al.,13 who analysed soils in mining and smelting areas in England. There the total Al amounts in soil were mainly higher, approx. 20 g/kg (range: 7.6–35.4 mg/g). No limit concentrations were found for Al in agricultural soils.14
Cadmium
Cd in soil occurs either naturally or is derived from human activities.15 In the analysed soils cadmium levels Table 3. Recoveries and limits of detection for the elements in the extract solution of all four sequential extraction steps
step 1 (CH3COOH)
step 2 (NH2OH×HCl)
step 3 (H2O2 +CH3COONH4)
step 4 (aqua regia) Element and
wavelength / nm
Recovery
% 1
LOD μg L
Recovery
% 1
LOD μg L
Recovery
% 1
LOD μg L
Recovery
% 1
LOD μg L
Al 308.215 101 2.79 97 2.26 106 2.20 98 2.00
Cd 214.441 111 0.02 103 0.15 103 0.21 103 0.58
Co 228.615 103 0.95 98 2.60 100 0.76 93 1.62
Cr 206.149 101 1.99 98 1.71 111 1.68 101 2.01
Cu 224.700 97 4.74 102 0.64 100 1.97 96 1.62
Mn 257.610 101 0.83 97 5.97 97 1.71 99 0.12
Ni 231.604 110 6.23 98 0.13 112 0.97 99 1.57
Pb 220.353 105 2.41 110 1.50 105 3.17 102 4.85
Zn 213.856 92 5.28 100 3.84 99 0.18 95 0.37
Table 4. Amount and percentage of nutrient extracted per step (step 1 – CH3COOH; step 2 – NH2OH×HCl; step 3 – H2O2 +
CH3COONH4; step 4 - aqua regia)
a - Aluminium µg/g %
step 1 step 2 step 3 step 4 sum extracted step 1 step 2 step 3 step 4 sum extracted
G1 3.75 709 481 8336 9529 0.0394 7.44 5.04 87.5 100
G2 2.74 857 318 6712 7889 0.0347 10.9 4.03 85.1 100
G3 2.95 912 551 6336 7802 0.0378 11.7 7.07 81.2 100
G4 30.4 901 430 8417 9779 0.311 9.22 4.40 86.1 100
G5 1.39 565 284 5702 6552 0.0213 8.62 4.34 87.0 100
G6 10.7 680 217 7057 7965 0.134 8.54 2.73 88.6 100
G7 33.9 1543 1276 7881 10735 0.316 14.4 11.9 73.4 100
G8 42.4 1853 623 7455 9973 0.425 18.6 6.20 74.8 100
G9 89.4 972 1192 7609 9863 0.907 9.86 12.1 77.1 100
G10 1.19 926 349 9096 10372 0.0115 8.93 3.36 87.7 100
b - Cadmium µg/g %
step 1 step 2 step 3 step 4 sum extracted step 1 step 2 step 3 step 4 sum extracted
G1 0.302 0.706 < LOD 1.05 2.06 14.7 34.3 0 51.0 100
G2 0.339 0.491 < LOD 0.684 1.51 22.4 32.4 0 45.2 100 G3 0.308 0.654 < LOD 0.639 1.60 19.2 40.9 0 39.9 100
G4 0.146 0.248 < LOD 1.13 1.53 9.58 16.2 0 74.2 100
G5 0.349 0.489 < LOD 0.681 1.52 23.0 32.2 0 44.9 100 G6 0.143 0.277 < LOD 0.926 1.35 10.6 20.6 0 68.8 100
G7 0.148 0.343 < LOD 1.14 1.63 9.04 21.0 0 69.9 100
G8 0.196 0.413 < LOD 1.44 2.05 9.57 20.1 0 70.3 100
G9 0.174 0.310 < LOD 0.765 1.25 13.9 24.8 0 61.3 100 G10 0.329 0.191 < LOD 1.26 1.78 18.5 10.8 0 70.7 100
c - Chromium µg/g %
step 1 step 2 step 3 step 4 sum extracted step 1 step 2 step 3 step 4 sum extracted
G1 < LOD 0.930 < LOD 23.0 23.9 0 3.89 0 96.1 100
G2 < LOD 1.18 0.909 18.5 20.6 0 5.75 4.42 89.8 100
G3 < LOD 1.08 1.94 15.7 18.7 0 5.75 10.4 84.1 100
G4 0.0853 1.28 1.62 22.0 25.0 0.342 5.12 6.51 88.0 100
G5 0.0592 2.05 3.06 18.1 23.2 0.255 8.83 13.2 77.7 100
G6 0.00792 0.374 0.396 9.83 10.6 0.0747 3.53 3.73 92.7 100
G7 0.140 4.32 5.59 31.3 41.3 0.338 10.4 13.5 75.7 100
G8 0.303 10.1 10.4 42.6 63.4 0.478 15.8 16.5 67.2 100
G9 0.124 1.00 2.79 15.9 19.9 0.625 5.04 14.1 80.3 100
G10 0.0350 0.0507 0.606 29.0 29.6 0.118 0.171 2.04 97.7 100
d - Cobalt µg/g %
step 1 step 2 step 3 step 4 sum extracted step 1 step 2 step 3 step 4 sum extracted
G1 0.554 3.27 0.598 0.135 4.55 12.2 71.7 13.1 2.96 100
G2 0.527 2.17 0.599 0.0821 3.38 15.6 64.3 17.7 2.43 100
G3 0.579 2.60 1.33 0.0777 4.58 12.6 56.7 29.0 1.70 100
G4 0.707 3.48 0.699 0.0738 4.96 14.3 70.2 14.1 1.49 100
G5 0.355 3.26 0.888 0.0612 4.56 7.79 71.4 19.5 1.34 100
G6 0.753 2.02 1.19 0.0682 4.03 18.7 50.2 29.5 1.69 100
G7 0.679 12.0 1.30 0.210 14.2 4.78 84.6 9.13 1.48 100
G8 0.950 11.8 1.64 < LOD 14.4 6.61 82.0 11.4 0 100
G9 0.905 4.95 1.24 0.0663 7.16 12.6 69.1 17.3 0.926 100
Table 4. (Continued)
e - Copper µg/g %
step 1 step 2 step 3 step 4 sum extracted step 1 step 2 step 3 step 4 sum extracted
G1 < LOD 3.63 0.408 8.16 12.2 0 29.8 3.35 66.9 100
G2 < LOD 4.67 5.99 7.57 18.2 0 25.6 32.9 41.5 100
G3 < LOD 3.30 9.40 6.48 19.2 0 17.2 49.0 33.8 100
G4 < LOD 6.14 0.101 4.00 10.2 0 59.9 0.991 39.1 100
G5 < LOD 1.72 15.1 9.48 24.8 0 6.90 60.9 38.2 100
G6 < LOD 4.00 < LOD 4.00 8.00 0 50.0 0 50.0 100
G7 < LOD 7.43 < LOD 4.80 12.2 0 60.7 0 39.3 100
G8 2.94 7.93 0.307 6.52 14.8 19.9 53.7 2.08 44.2 100
G9 < LOD 4.94 0.103 2.49 7.53 0 65.6 2.00 33.1 100
G10 3.10 66.1 34.1 56.1 156 1.98 42.3 3.00 35.9 100
f - Iron µg/g %
step 1 step 2 step 3 step 4 sum extracted step 1 step 2 step 3 step 4 sum extracted
G1 5.45 3073 320 25490 28889 0.0189 10.6 1.11 88.2 100
G2 3.51 2569 483 19607 22663 0.0155 11.3 2.13 86.5 100
G3 5.23 4010 1200 18067 23282 0.0225 17.2 5.16 77.6 100
G4 5.26 2252 590 28976 31823 0.0165 7.08 1.85 91.1 100
G5 2.17 2587 527 17365 20481 0.0106 12.6 2.57 84.8 100
G6 4.11 2594 341 25939 28878 0.0142 8.98 1.18 89.8 100
G7 1.62 3053 942 28418 32415 0.00501 9.42 2.90 87.7 100
G8 2.42 2987 511 33040 36540 0.00661 8.17 1.40 90.4 100
G9 5.75 4201 1048 20888 26143 0.0220 16.1 4.01 79.9 100
G10 0.922 1147 260 14822 16230 0.00568 7.07 1.60 91.3 100
g - Lead µg/g %
step 1 step 2 step 3 step 4 sum extracted step 1 step 2 step 3 step 4 sum extracted
G1 < LOD 41.7 < LOD 7.83 49.5 0 84.2 0 15.8 100
G2 < LOD 39.0 < LOD 6.57 45.6 0 85.6 0 14.4 100
G3 < LOD 40.9 < LOD 7.09 48.0 0 85.2 0 14.8 100
G4 < LOD 19.9 < LOD 7.83 27.8 0 71.8 0 28.2 100
G5 < LOD 29.1 < LOD 9.49 38.6 0 75.4 0 24.6 100
G6 < LOD 24.9 < LOD 3.92 28.8 0 86.4 0 13.6 100
G7 < LOD 36.5 < LOD 9.64 46.2 0 79.1 0 20.9 100
G8 < LOD 34.9 < LOD 13.2 48.1 0 72.5 0 27.5 100
G9 < LOD 15.5 < LOD 5.11 20.6 0 75.2 0 24.8 100
G10 0.503 11.3 < LOD 4.34 16.1 3.12 70.0 0 26.9 100
h - Magnesium µg/g %
step 1 step 2 step 3 step 4 sum extracted step 1 step 2 step 3 step 4 sum extracted
G1 3382 4832 597 5340 14150 23.9 34.1 4.22 37.7 100
G2 3554 5329 440 3818 13142 27.0 40.5 3.35 29.1 100
G3 3747 4449 729 3700 12624 29.7 35.2 5.77 29.3 100
G4 499 398 324 3226 4446 11.2 8.94 7.28 72.6 100
G5 3364 6485 2149 2451 14449 23.3 44.9 14.9 17.0 100
G6 2400 2956 172 4227 9754 24.6 30.3 1.76 43.3 100
G7 499 398 324 3226 4446 11.2 8.94 7.28 72.6 100
G8 2193 1089 318 2861 6461 33.9 16.9 4.92 44.3 100
G9 320 1285 385 2999 4990 6.40 25.8 7.71 60.1 100
Table 4. (Continued)
i - Manganese µg/g %
step 1 step 2 step 3 step 4 sum extracted step 1 step 2 step 3 step 4 sum extracted
G1 88.2 191 6.84 113 400 22.0 47.9 1.71 28.4 100
G2 84.4 123 3.79 105 316 26.7 38.9 1.20 33.3 100
G3 89.5 143 7.36 89.3 329 27.2 43.4 2.24 27.2 100
G4 84.7 172 5.07 107 369 23.0 46.7 1.38 28.9 100
G5 76.7 204 6.81 82.9 370 20.7 55.0 1.84 22.4 100
G6 65.6 70.6 2.77 88.8 228 28.8 31.0 1.22 39.0 100
G7 78.3 305 8.01 186 577 13.6 52.8 1.39 32.2 100
G8 91.3 324 8.80 213 637 14.3 50.8 1.38 33.5 100
G9 113 436 19.8 132 700 16.1 62.2 2.83 18.8 100
G10 54.9 152 11.8 134 353 15.6 43.2 3.35 37.9 100
j - Nickel µg/g %
step 1 step 2 step 3 step 4 sum extracted step 1 step 2 step 3 step 4 sum extracted
G1 1.11 5.08 3.39 25.4 34.9 3.18 14.5 9.70 72.6 100
G2 1.01 3.56 4.29 15.6 24.4 4.15 14.6 17.6 63.7 100
G3 1.13 4.54 6.03 14.5 26.2 4.33 17.3 23.0 55.3 100
G4 0.786 2.84 4.29 19.1 27.1 2.91 10.5 15.9 70.7 100
G5 1.12 3.82 3.65 15.4 24.0 4.66 15.9 15.2 64.3 100
G6 0.721 3.21 3.67 22.0 29.6 2.44 10.9 12.4 74.3 100
G7 2.48 10.7 7.09 30.2 50.5 4.90 21.2 14.0 59.9 100
G8 3.59 18.4 8.60 69.2 99.7 3.60 18.4 8.62 69.4 100
G9 1.74 2.00 5.99 16.4 26.1 6.64 7.65 22.9 62.8 100
G10 2.67 5.63 1.99 34.9 45.1 5.91 12.5 4.41 77.2 100
k - Potassium µg/g %
step 1 step 2 step 3 step 4 sum extracted step 1 step 2 step 3 step 4 sum extracted
G1 1039 310 < LOD 1410 2759 37.7 11.2 0 51.1 100
G2 685 261 52.0 1078 2076 33.0 12.6 2.51 51.9 100
G3 607 261 82.0 1058 2008 30.2 13.0 4.08 52.7 100
G4 605 272 < LOD 690 1567 38.6 17.4 0.00 44.1 100
G5 297 135 217 443 1091 27.2 12.4 19.9 40.5 100
G6 301 153 < LOD 1010 1464 20.6 10.4 0 69.0 100
G7 171 90.0 < LOD 1010 1271 13.5 7.08 0 79.5 100
G8 280 115 < LOD 725 1120 25.0 10.2 0 64.7 100
G9 178 118 < LOD 575 871 20.4 13.6 0 66.0 100
G10 542 320 46.2 1562 2470 22.0 12.9 1.87 63.2 100
l - Zinc µg/g %
step 1 step 2 step 3 step 4 sum extracted step 1 step 2 step 3 step 4 sum extracted
G1 16.9 50.9 < LOD 72.0 140 12.1 36.4 0 51.5 100
G2 16.9 42.8 4.69 47.7 112 15.1 38.2 4.19 42.5 100
G3 25.4 56.8 7.26 47.2 137 18.6 41.6 5.31 34.6 100
G4 2.87 16.9 0.304 50.2 70.3 4.07 24.1 0.432 71.4 100
G5 12.0 42.2 45.0 46.0 145 8.26 29.1 31.0 31.7 100
G6 7.16 26.5 < LOD 57.9 91.6 7.82 29.0 0 63.2 100
G7 8.79 32.3 6.49 47.3 94.8 9.27 34.0 6.84 49.9 100
G8 6.36 42.7 < LOD 65.1 114 5.57 37.4 0 57.0 100
G9 0.149 5.91 1.14 31.5 38.7 0.385 15.3 2.94 81.4 100
ranged from 1.2 up to 2.1 µg/g and correspond to values in literature: Cd levels were found in the Yozgat region (Turkey) below 1 µg/g,16 in the Incesu-Kayseri region (Turkey) 1–4 µg/g,17 from < 0.1 µg/g to 1.5 µg/g for horticultural soils in New Zealand,18 a study on agricul-tural soils in USA led to Cd concentrations of < 0.01 µg/g to 2.0 µg/g.19 In orchard soils in China total Cd amounts of 0.7 up to 1.8 µg/g were found by Li et al.20 In Algeria in a study on agricultural soils Cd level of 0.30 µg/g (median) was obtained.21 Cadmium levels in horticultural and agricultural soils depend on the con-tinued use of phosphate-fertilizers and zinc containing agrichemicals, where cadmium is present as impurity.15 The total amounts of cadmium in garden soils were expected to be lower than those reported for plants grown commercially. Cadmium contamination limits agricultural use of soil, thus critical soil Cd concentra-tion has been proposed in various countries, e.g. 0.3 µg/g in China.3 According to French regulation maximum Cd soil level is 2 µg/g.14 In Canada the limit concentration is 1.4 µg/g.2
Regarding the extractability of cadmium, 30–60 % were extracted in the first two steps (10–20 % and 20– 40 %, resp.) and the remaining 40–70 % were found in the residue (step 4).
Chromium
Chromium is ubiquitous in the environment, like soil, water and air, and occurs in two forms, as Cr(III) and Cr(VI). The latter is more toxic and, in plants affects negatively leaf and root growth, inhibits certain en-zymes and may cause mutagenesis.22 High chromium levels in soil are caused by anthropomorphic activities. The amounts found in the analysed soils samples ranged from 10 up to 63 µg/g with 70 % between 19 and 30 µg/g. The exceptions are G6 11 µg/g, G7 41 µg/g and G8 63 µg/g. The entire range is reported by Adri-ano4 as normal chromium soil level, namely 10 to 50 µg/g depending on the bedrock concentration. In Algeria (Anaba region) the median total chromium level in agricultural soil was found to be 28.3 µg/g (Ref. 21) and in the Incesu-Kayseri region (Turkey) 0.5–38 µg/g.17 Even the outlier G8 is below the permissible concentration of toxic elements for agricultural soils of China (200 µg/g),3 French regulatory limit of 150 µg/g (Ref. 14) and the Canadian limit of 64 µg/g for total chromium.2 Regarding the extractability of chromium from soil it was found that 1 % was extracted in step 1 and up to 10 % in steps 2 and 3. As expected, the high-est amounts were found in samples G7 and G8.
Cobalt
The French regulations’ limit of cobalt in soil is 30 µg/g (Ref. 14) and in Canada 40 µg/g.2 All soils analysed contain Co in lower concentration. In the investigated soil samples six of ten had cobalt levels between 4 and 5
µg/g. Higher levels were found in G9 (7.2 µg/g) and in G7 and G8 (approx. 14 µg/g). G2 has less Co, namely 3.4 µg/g. Three Turkish studies came to similar results. In the soil samples from Kayseri region the concentra-tion of cobalt is found to be less than 3 µg/g,23 in the Incesu-Kayseri region 0.5–38 µg/g (Ref. 17) and in the Yozgat region 4–8 µg/g.16 The China National Envi-ronmental Monitoring Centre reported cobalt levels of 15 µg/g and 26 µg/g.24 In plants cobalt is required by the urease enzyme. Cobalt has only a low affinity to humic substances,12 and it is adsorbed to clay minerals in soil and geological origin by specific reactions.25 This is reflected in its extraction behaviour: 50–70 % of Co is extracted in step 2, approx. 10 % in step 1 and up to 30 % in step 3. Only 3 % of the total cobalt were detected in the residue (step 4).
Copper
Copper is essential for plants but is toxic at higher lev-els. The total copper levels in the soil samples analysed ranged from 10 to 25 µg/g, except for G10 containing 156 µg/g. Similar levels were reported for Turkish soil samples, namely 12–27.5 µg/g from Kayseri region23 and ranging from 16–26 µg/g in Incesu-Kayseri region,7 and even slightly higher than in samples from the Yozgat region (4–14 µg/g),16 and below those reported for agricultural soils (40 µg/g in market garden and 58 µg/g orchard),18 what can be explained by the minor use of copper-based fungicides in private gardens than in horticulture. In agricultural soils in the USA levels from 0.3 up to 495 µg/g were found with a median of 18.5 µg/g.19 Algerian agricultural soils had a median copper level of 23.8 µg/g,21 while higher copper levels were found in Italian vineyard soils (945 µg/g).26 Chi-nese and French regulations stipulate maximum copper level in soil of 100 µg/g.3,14 The Canadian Ministry of Environment limits Cu in agricultural soil to 63 µg/g.2 Copper plays a role in plants’ growth. Common garden plants, like tomatoes and strawberries need Cu up to 20 µg/g, thus all soils of this study met these needs.5
Regarding the extractability it was found that cop-per was leached mainly from soil in step 2 (reducible fraction). A similar finding was reported by Whalley and Grant.27 In step 1, only extracts of G10 was the copper level above the LOD, which could be a result of the high total concentration in the sample. Cu has a high affinity for humic substances.12
Lead
found for American agricultural soils, namely < 1–135 µg/g.19 In Algeria (Anaba region) lead levels of approx. 40 µg/g were found,21 whereby the highest values were found in soils of the city centre. Due to lead-free gaso-line the lead concentration in soil decreased during the last decades. Levels up to 720 µg/g were found in soils in the USA.28 At present lead originates as contaminant of certain fertilisers ans sewage sludge. French regula-tions limit lead levels in soil at 100 µg/g.14 The Cana-dian Ministry of Environment2 limits in agricultural soils the lead level to a maximum of 70 µg/g. In China the limit is 300 µg/g.3
Lead is mainly extracted in steps 2 and 4 while in the solutions after step 1 and 3 the lead concentrations were below the LOD. Exception is G10 having the low-est lead content, but with 3 % extracted in step 1. Pb is readily complexed by humic substances.12
Manganese
In soils from Algeria Maas and colleagues21 found Mn content ranging from 34 to 636 µg/g, the median being 400 µg/g. Similar values were found in Turkey, namely, in the Incesu-Kayseri region 130–2600 µg/g,16 in the Yozgat region 280–360 µg/g,17 and in the Kayseri re-gion 500 µg/g.23 The last two findings were in roadside soils. In both cases there was no correlation found be-tween Mn content in soil and distance to the road. Man-ganese is not easily bound to humic substances.12 The total manganese contents in the analysed garden soils ranged from 300 to 400 µg/g. Less Mn was found in G6 (228 µg/g) and 600 to 700 µg/g in G7–G9. No regula-tions exist for manganese content in agricultural soils.2,14 Manganese is involved carbohydrate and nitro-gen metabolism, but deficiency is not likely to occur in private gardens. Levels up to 500 µg/g are needed by some garden plants.5
Most manganese is extracted in step 2, 30 up to 50 %. In G9, 60 % were extracted and 20 to 40 % were found in the residue (step 4). In the oxidisable fraction only up to 3 % of the total Mn amount were found.
Nickel
For nickel similar extraction behaviour was reported in literature27 with the highest extraction yields in the first two steps. The soils analysed in the present were differ-ent, since less than 10% were extracted in step 1, and up to 20 % in step 2, while the rest remained unex-tracted. Not only can the different soil composition determined by the parent rock be considered as reason for this, but also in the diverse experimental set up. Whereas Whalley and colleague27 first let the metals adsorb to the soil, real soil samples were used in the present investigation. The nickel content found in the present study ranged from 24 up to 35 µg/g, except for G10 (45 µg/g), G7 (51 µg/g) and G8 (100 µg/g). Holm-gren et al.19 reported a soil in a similar range, namely with Nickel from 0.7 up to 269 µg/g, with a median of
18.2 µg/g. They found higher Ni levels in serpentine soils and in glaciated areas. Nickel amount in to the soil samples from Kayseri region (Turkey) is 43–82 µg/g,23 in the Incesu-Kayseri region (Turkey) 12–41 µg/g(Ref. 16) and in the Yozgat region (Turkey) 8–29 µg/g,17 in all cases similar to the obtained results. According to French regulations the allowed maximum Ni soil level is 50 µg/g.14 The same limit value is applied to Chinese agricultural soils.3
Zinc
Agrochemicals, such as fungicides and fertilisers, are a potential source of zinc in agriculture. Zinc levels in soils ranged from 64–108 µg/g in New Zealand,15 in the Kayseri region (Turkey) from 15–25 µg/g,23 in the In-cesu-Kayseri region (Turkey) from 26–51 µg/g,16 in the Lower Fraser Valley of British Columbia from 43–107 µg/g,29 and in rural soils in Netherlands from 7–95 µg/g.30 The results of the present study are in the same order of magnitude, namely from 40–145 µg/g. Zinc levels up to 560 µg/g (median 65 µg/g) were found in Algeria.21 Regulations limit Zn levels in soil to 300 µg/g in France14 and to 250 µg/g in China.3 Zinc is involved in carbohydrate metabolism and in enzymatic systems regulating plant growth. Up to 100 µg/g zinc is needed by tomatoes,5 and 5–30 µg/g by strawberries, blueber-ries and grapes.
Zinc is leached mainly in step 2 while small amounts were extracted in steps 1 and 3.
CONCLUSIONS
All soils analysed contained the studied elements at levels reported for other geographical regions world-wide and the levels did not exceed the limits imposed by different jurisdictions. The three soil samples taken from the city of Zagreb contained higher levels of pol-lutants. A similar observation was made in twelve cities in China.31 The nutrient supply of elements was found to be adequate in all tested soil samples.
REFERENCES
1. R. E. Pugh, D. G. Dick, and A. L. Fredeen,
52 (2002) 273-279.
2. Canadian Council of Ministers of the Environment. 2012. Soil Quality Guidelines for the Protection of Environmental and
Hu-man Health. Accessed 4 June 2013 fro
3. CEPA (Chinese Environmental Protection Administration, Envi-ronmental Quality Standard for Soils (GB15618-1995), Beijing, 1995.
4. D. C. Adriano
nd
edi-tion, Springer, New York, 2001.
5. C. O. Plank and D. E. Kissel, Plant Analysis Handbook for Georgia, online version. Accessed 4 June 2013, from
6. A. Łozak, K. Sołtyk, P. Ostapczuk, and Z. Fijałek, 289 (2002) 33-40.
7. C. R. M. Rao, A. Sahuquillo, and J. F. Lopez Sanchez,
189 (2008) 291–333.
8. A. M. Ure, Ph. Quevauviller, H. Muntau, and B. Griepink
51 (1993) 135–151.
9. J. F. López-Sánchez, A. Sahuquillo, G. Rauret, M. Lachica, E. Barahona, A. Gomez, A. M. Ure, H. Muntau, and Ph.
Quevauvil-le
Publisher Royal Society of Chemistry, Cambridge, 2002, pp. 28−65.
10. M. Zeiner, I. Juranović Cindrić, I. Lovrenčić Mikelić, G. M
e-dunić, Š. Kampić, N. Tomašić, and G. Stingeder 185 (2013) 223–229.
11. B. Marin, M. Valladon, and M. A. Polve342
(1997) 91-112.
12. W. G. Botero, L. Camargo de Oliveira, J. C. Rocha, A. H. Rosa,
and A. dos Santos177 (2010) 307–311.
13. X. Li and I. Thornt16 (2001) 1693–1706.
14. Agence Française de NORmalisation (AFNOR), 1996. Qualité des sols. Recueil de normes Françaises 1996, AFNOR, Paris. 15. WHO, 1992. Cadmium. In: Environmental Health Criteria, vol.
134. WHO, Geneva.
16. M. Soylak, Y. Akkaya, L. Elci, Trace Elements and Electrolytes
18 (2001) 176-180.
17. Y .E. Unsal, E. Yilmaz, M. Soylak, M. Tuzen, Fresenius Envi-ronmental Bulletin22 (2013) 1441-1445.
18. S. K. Gaw, A. L. Wilkins, N. D. Kim, G. T. Palmer, and P.
Rob-ins355 (2006) 31– 47.
19. G. G. S. Holmgren, M. W. Meyer, R. L. Chaney, and R. B.
Daniels22 (1993) 335–348.
20. J. T. Li, J. W. Qiu, X. W. Wang, Y. Zhong, C. Y. Lan, and W. S.
S143 (2006) 159-165.
21. S. Maas, R. Scheifler, M. Benslama, N. Crini, E. Lucot, Z.
Brahmia, S. Benyacoub, and P. Giraudoux,158
(2010) 2294-2301.
22. J. L. Gardea-Torresdey, J. R. Peralta-Videa, M. Montes, G. de la
Rosa, and B. Corral-92 (2004) 229−235.
23. M. Soylak, O. Türkoglu, Journal of Trace and Microprobe Techniques17 (1999) 209-217.
24. G. Jin, Y. Zhu, W. Jiang, B. Xie, and B. Cheng122
(1997) 263-265.
25. K. G. Tiller, J. F. Hodgoson, and M. Peech,95 (1963) 392-399.
26. A. Deluisa, P. Giandon, M. Aichner, P. Bortolami, L. Bruna, A. Lupetti, F. Nardelli, and G. Stringari, 27 (1996) 1537–1548.
27. C. Whalley and A. Gran (1994) 287-295.
28. I. Merwin, P.T. Pruyne, J. G. Ebel, K. L. Manzell, and D. J. Lisk,
(1994) 1361–1367.
29. L. A. De Pieri, W. T. Buckley, and C. G. Kowalenko,
76 (1996) 173–182.
30. P. F. M. Van-Gaans, S. P. Vriend, S. Bleyerveld, G. Schrage, and
A. Vos34 (1995) 73–102.