Submitted22 October 2015
Accepted 12 May 2016
Published7 June 2016
Corresponding author
Jamie D. Walls, [email protected]
Academic editor
Rudiger Ettrich
Additional Information and Declarations can be found on page 15
DOI10.7717/peerj.2104 Copyright
2016 Marks et al.
Distributed under
Creative Commons CC-BY 4.0 OPEN ACCESS
1
H NMR studies distinguish the
water soluble metabolomic profiles of
untransformed and RAS-transformed
cells
Vered Marks1, Anisleidys Munoz1,2, Priyamvada Rai2,3and Jamie D. Walls1
1Department of Chemistry, University of Miami Coral Gables, FL, USA
2Department of Medicine, Division of Hematology and Oncology, University of Miami Miller School
of Medicine, Miami, FL, USA
3Sylvester Comprehensive Cancer Center, University of Miami Miller School of Medicine, Miami, FL, USA
ABSTRACT
Metabolomic profiling is an increasingly important method for identifying potential biomarkers in cancer cells with a view towards improved diagnosis and treatment. Nuclear magnetic resonance (NMR) provides a potentially noninvasive means to accurately characterize differences in the metabolomic profiles of cells. In this work, we
use1H NMR to measure the metabolomic profiles of water soluble metabolites extracted
from isogenic control and oncogenic HRAS-, KRAS-, and NRAS-transduced BEAS2B lung epithelial cells to determine the robustness of NMR metabolomic profiling in detecting differences between the transformed cells and their untransformed counter-parts as well as differences among the RAS-transformed cells. Unique metabolomic signatures between control and RAS-transformed cell lines as well as among the three RAS isoform-transformed lines were found by applying principal component analysis to the NMR data. This study provides a proof of principle demonstration that NMR-based metabolomic profiling can robustly distinguish untransformed and RAS-transformed cells as well as cells transformed with different RAS oncogenic isoforms. Thus, our data may potentially provide new diagnostic signatures for RAS-transformed cells.
SubjectsBiophysics, Metabolic Sciences
Keywords Oncogenic RAS,1H NMR metabolomics, 1D NOESY, Fieller’s method for unpaired
data
INTRODUCTION
It has long been appreciated that the metabolism of normal and malignant cells can
significantly differ (Warburg, 1956). Measuring the cellular metabolomic profiles can
therefore provide a ‘‘snapshot’’ of the degree of oncogenic malignancy in cancer cells (Griffin
& Schockor,2004). One particularly important technique that can measure metabolomic profiles is nuclear magnetic resonance (NMR). NMR is a noninvasive method that can provide highly reproducible and quantitative metabolomic information and has been previously used to detect metabolic fingerprints from a variety of oncogenic pathways (Morvan & Demidem,2007;Southam et al.,2008).
One of the earliest applications of cellular NMR metabolomics has been to look for
Ronen et al.,2001). The RAS oncogene, which can exist in either of the HRAS, KRAS, or NRAS isoforms, is found mutated in approximately 30% of all human cancers and
produces aggressive, treatment resistant tumors (Fernandez-Medarde & Santos,2011). Of
the three major isoforms, KRAS is found to be the most commonly mutated in human tumors. NRAS is also found activated in certain tumor types such as melanoma, whereas
HRAS mutations are rarely found in human cancers (Bos,1989). The three isoforms, which
differ in their membrane-targeting domain, were historically considered to be redundant
in their function (Castellano & Santos,2011). However, a number of studies have shown
that the three isoforms are functionally different (Li, Zhu & Guan,2004;Walsh & Bar-Sagi,
2001;Yan et al.,1998) with tumors sustaining distinct oncogenic versions of RAS showing
different progression characteristics (Parikh, Subrahmanyam & Ren,2007;Whitwam et
al.,2007). Accordingly, high-throughput noninvasive means of detecting RAS signatures
from tumor cells are likely to aid in effective diagnosis and design of treatment regimens
that target RAS-specific pathways (Downward,2003;Omerovic et al.,2008). However to
our knowledge, differences in the metabolomic profiles between normal cells and cells transformed with either of oncogenic HRAS, KRAS, or NRAS have not been previously investigated. Anticipating that there will be robust differences between untransformed and RAS-transformed cells, we employed a cell culture system to validate the NMR methodology described in this study.
Specifically, we analyzed BEAS2B immortalized lung epithelial cells stably transformed with either an empty retroviral vector or with either one of the activated versions of the RAS isoforms, HRAS, KRAS and NRAS, as a proof-of-principle system to determine whether
1H NMR-based metabolomics could be used to identify unique metabolomic signatures
between the RAS-transformed and control cells as well as among the different RAS isoform-transformed cell lines. The advantage of this cell culture system is the isogenic background among the four cell lines as well as the ability to generate the requisite numbers of stably transformed cells for consistent NMR characterization. Our NMR characterization of the metabolomic profiles indicated that each RAS isoform possesses a distinct metabolomic signature that has bearing on its observed cell-physiologic transformative effects.
MATERIALS AND METHODS
DNA constructs and viral transduction
The retroviral pBABE KRASV12, HRASV12 and NRASQ61 DNA constructs were obtained from Addgene. Stable transduction of the pBABE empty vector and the RAS constructs into
BEAS2B cells was performed as previously described (Patel et al.,2012). Transduced cells
were selected in 2.5µg/ml puromycin-containing complete culture media for a minimum
period of 5–7 days (corresponding to the time taken for untransduced BEAS2B cells to die completely in selection media). Oncoprotein overexpression relative to the control cells
was verified via Western blotting as previously described (Patel et al.,2012).
Cell culture
BEAS2B cells were obtained from the American Type Culture Collection. All cells were
maintained in DMEM:F12 complete base media supplemented with 10% fetal bovine serum and 100 units/ml penicillin-streptomycin. All cell culture reagents were obtained from Life Technologies. For each cell line, ten biological replicates were generated by initially seeding
ten different 15 cm dishes (Nunclon) with an initial plating of approximately 1×10⁶
cells for the control cells, 1.5×10⁶cells for the HRAS- and KRAS-transformed cells, and
2×10⁶for the NRAS-transformed cells (differences in the initial seedings were used to
compensate for differences in cellular growth rates so that by the end of the growth period, approximately the same number of cells for each cell line was obtained). In total, all forty plates were seeded at approximately the same time and were allowed to proliferate for a period of four days with the media changed every 48 h. After four days, the cells were trypsinized for approximately two minutes and counted using a Moxi automatic cell counter (VWR) with size parameters adjusted to exclude apoptotic cells. The average final
cell counts were (1.107±0.050)×107cells per control sample, and (1.558±0.291)×107,
(1.486±0.124)×107, and (1.613±0.156)×107 cells per HRAS-, KRAS-, and
NRAS-transformed sample, respectively. This corresponded to an average population doubling time of 27.68 h for the control cells and 28.43 h, 29.02 h, and 31.89 h for the HRAS-, KRAS-, and NRAS-transformed cells, respectively. After counting, the cells were pelleted
at 1,500 rpm for 5 min at 4 ◦C with the pellets immediately snap-frozen in liquid nitrogen
and stored at –80 ◦C.
Metabolite extraction
The extraction of hydrophilic metabolites from cell pellets was performed using previously
established procedures (Gottschalk et al.,2008). Briefly, cell pellets in a 1.5 ml Eppendorf
tubes were resuspended by adding 500µl of a 2:1 (v/v) ice-cold solution of methanol
(Sigma-Aldrich) and chloroform (Sigma-Aldrich) followed by 3–5 min of vortexing and
manual mixing for at least 10 min until a clear solution was obtained. Next, 250µl of
ice-cold chloroform and 250µl of ice-cold water were each added to the sample, which was
then vortexed for 5–7 min to yield a cloudy solution. The sample was sonicated at room
temperature for ten minutes followed by centrifugation at 13,000 rpm for 5 min at 4 ◦C
in order to yield three layers. The hydrophilic layer was transferred to a fresh Eppendorf tube followed by bubbling with nitrogen gas (Airgas) to remove any residual methanol. The samples were placed under a high speed vacuum concentrator at room temperature
until dried, and the dried hydrophilic layer was stored in a –80 ◦C freezer until needed.
NMR sample preparation, acquisition, and processing
The dried hydrophilic layer was resuspended in 400µl of deuterated PBS at pH=7.6 that
was prepared as previously reported (Sambrook, Fritsch & Maniatis,1989). The pH of each
sample was adjusted to 7.6 by the addition of either dilute HCl or NaOH as needed to ensure that each metabolite appeared at the same chemical shift in all samples. In each
sample, 0.5µl of a 0.1 M aqueous solution of DSS (Sigma Aldrich) was added for chemical
shift referencing. After vortexing, each sample was transferred into a 5 mm NMR tube.
The 1H NMR spectra were acquired on a 500 MHz Bruker Avance spectrometer
(operating at 500.13 MHz for1H observation) equipped with a 5 mm TCI 500S2
(C)
Control
HRAS
NRAS
KRAS
8 6
Chemical Shift (ppm)
“noesygppr1d.2”
4 2 0
DSS
~
Control
HR
AS
K
RAS
NR
AS
Anti-HRAS
Anti-KRAS
Anti-NRAS
Anti-GAPDH
(B)
(A)
G1 G2
φ
1φ
2CW, X
τ
mixφ
3θ
d
11
H
G
DSS DSS DSS
2
3
4,16
8
1
12
12,21
5,14 9,17
15
17,18
18 20 19 20
16
12
9,13
10 10
6,7
11,21 6,7
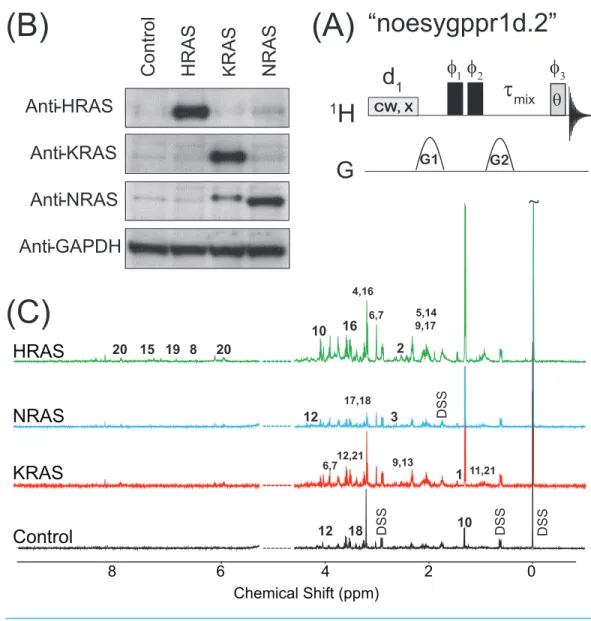
Figure 1 NOESY pulse sequence, Western Blots, and Representative Spectra.(A) The 1D NOESY with
presaturation pulse sequence. (B) Western blots depicting the control and oncogenic HRAS-, KRAS-, and NRAS-transformed cells. (C) Representative spectra obtained from the 1D NOESY sequence applied to samples made from the control and HRAS-, NRAS-, and KRAS-transformed cells. The spectra were nor-malized so that the DSS resonance atδ=0 ppm had the same intensity in all spectrafor display purposes only. The spectral region for the water resonance is not shown, and certain metabolite resonances are la-beled using the codes 1–21 given inTable 1.
90◦pulse length was recalibrated (90◦pulse lengths ranged between 10 and 12µs). The1H
NMR spectra were acquired using a standard Bruker 1D NOESY pulse program with water presaturation and spoiler gradients applied during the relaxation delay, ‘‘noesygppr1d.2’’
as shown inFig. 1A. This pulse sequence provides good solvent suppression without rolling
baselines (Beckonert et al.,2007;Mckay,2011). The following experimental parameters
were used in all measurements: sweep width of 10.33 kHz, 65 K acquisition points, a 2 s
recycle delay during which a 93 Hz water presaturation pulse was applied,τmix=101.2 ms,
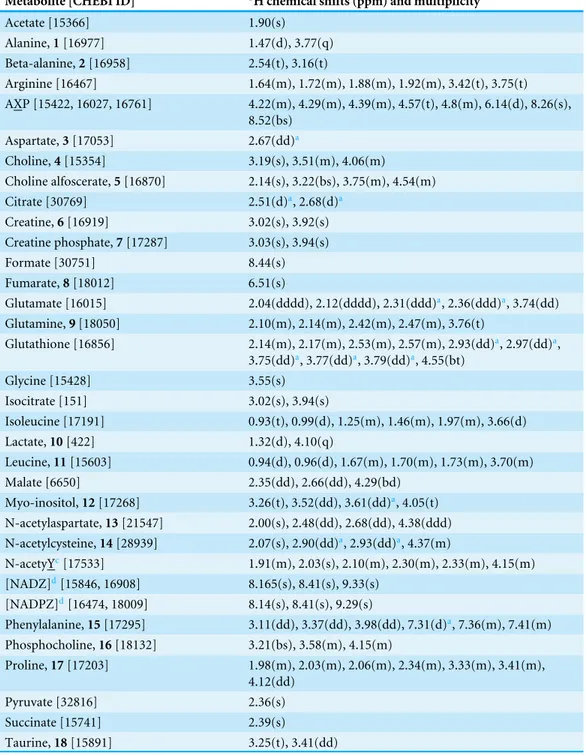
Table 1 Table of chemical shifts and splitting patterns for metabolites identified by NMR.List of iden-tified metabolites from the hydrophilic layer, with their corresponding CHEBID, chemical shifts (ppm) and splitting patterns (s, singlet; d, doublet; t, triplet; q, quartet; m, multiplet; dd, doublet of doublets; ddd, doublet of doublet of doublets; bs, broad singlet; bd, broad doublet; bt, broad triplet) used in the Chenomx analysis of the1H spectra. The labels 1–21 are for those metabolites that exhibited a
signifi-cant difference (adjustedp-values≤0.01) between at least two cell types in either their ‘‘effective’’ NMR metabolite fraction,xmetaboliteCell type inEq. (2), or their glutamate normalized signal,ξ
Cell type
α,glutamateinEq. (3).
Metabolite [CHEBI ID] 1H chemical shifts (ppm) and multiplicity
Acetate [15366] 1.90(s) Alanine,1[16977] 1.47(d), 3.77(q) Beta-alanine,2[16958] 2.54(t), 3.16(t)
Arginine [16467] 1.64(m), 1.72(m), 1.88(m), 1.92(m), 3.42(t), 3.75(t) AXP [15422, 16027, 16761] 4.22(m), 4.29(m), 4.39(m), 4.57(t), 4.8(m), 6.14(d), 8.26(s),
8.52(bs) Aspartate,3[17053] 2.67(dd)a
Choline,4[15354] 3.19(s), 3.51(m), 4.06(m)
Choline alfoscerate,5[16870] 2.14(s), 3.22(bs), 3.75(m), 4.54(m) Citrate [30769] 2.51(d)a, 2.68(d)a
Creatine,6[16919] 3.02(s), 3.92(s) Creatine phosphate,7[17287] 3.03(s), 3.94(s) Formate [30751] 8.44(s) Fumarate,8[18012] 6.51(s)
Glutamate [16015] 2.04(dddd), 2.12(dddd), 2.31(ddd)a, 2.36(ddd)a, 3.74(dd)
Glutamine,9[18050] 2.10(m), 2.14(m), 2.42(m), 2.47(m), 3.76(t)
Glutathione [16856] 2.14(m), 2.17(m), 2.53(m), 2.57(m), 2.93(dd)a, 2.97(dd)a,
3.75(dd)a, 3.77(dd)a, 3.79(dd)a, 4.55(bt)
Glycine [15428] 3.55(s) Isocitrate [151] 3.02(s), 3.94(s)
Isoleucine [17191] 0.93(t), 0.99(d), 1.25(m), 1.46(m), 1.97(m), 3.66(d) Lactate,10[422] 1.32(d), 4.10(q)
Leucine,11[15603] 0.94(d), 0.96(d), 1.67(m), 1.70(m), 1.73(m), 3.70(m) Malate [6650] 2.35(dd), 2.66(dd), 4.29(bd)
Myo-inositol,12[17268] 3.26(t), 3.52(dd), 3.61(dd)a, 4.05(t)
N-acetylaspartate,13[21547] 2.00(s), 2.48(dd), 2.68(dd), 4.38(ddd) N-acetylcysteine,14[28939] 2.07(s), 2.90(dd)a, 2.93(dd)a, 4.37(m)
N-acetyYc[17533] 1.91(m), 2.03(s), 2.10(m), 2.30(m), 2.33(m), 4.15(m)
[NADZ]d[15846, 16908] 8.165(s), 8.41(s), 9.33(s)
[NADPZ]d[16474, 18009] 8.14(s), 8.41(s), 9.29(s)
Phenylalanine,15[17295] 3.11(dd), 3.37(dd), 3.98(dd), 7.31(d)a, 7.36(m), 7.41(m)
Phosphocholine,16[18132] 3.21(bs), 3.58(m), 4.15(m)
Proline,17[17203] 1.98(m), 2.03(m), 2.06(m), 2.34(m), 3.33(m), 3.41(m), 4.12(dd)
Pyruvate [32816] 2.36(s) Succinate [15741] 2.39(s)
Taurine,18[15891] 3.25(t), 3.41(dd)
Table 1(continued)
Metabolite [CHEBI ID] 1H chemical shifts (ppm) and multiplicity
Tyrosine,19[17895] 3.04(dd), 3.18(dd), 3.93(dd), 6.88(d)a, 7.18(d)a
UDP-Xb,20[17200, 18066, 18307] 3.44(t), 3.53(td), 3.76(t), 3.78(dd), 3.86(m), 3.89(m),
4.19(ddd)a, 4.24(ddd)a, 4.27(m), 4.36(m), 4.37(m),
5.59(dd), 5.96(d), 5.98(bd), 7.94(d) Valine,21[16414] 0.98(d), 1.03(d), 2.26(hd), 3.60(d) DSS 0.00(s), 0.63(m), 1.76(m), 2.91(m)
Notes.
aMultiplet with second-order couplings.
bFor UDP-X can be UDP-galactose, UDP-glucose, or UDP-glucoranate.
cFor acetylY, the resonances used in the analysis stand for acetylglutamate, acetylglycine, and/or (and most likely)
N-acetylglutamine.
dOnly the listed resonances were used in the analysis of [NADZ] {[NADH] and/or [NAD+]}, and [NADPZ] {[NADPH] and/or
[NADP+]}.
gradients of duration 1 s with maximum gradient strengths of G1=24 G/cm and G2=
–23.7 G/cm were used inFig. 1Aalong with a 200µs gradient stabilization delay placed
after each gradient pulse. After acquisition, all FIDs were imported into the Chenomx NMR Suite Profiler (version 7.6., Chenomx Inc., Edmonton, Canada). The data were Fourier transformed after multiplication by an exponential window function with a line broadening of 0.5 Hz, and the spectra were manually phase corrected and baseline adjusted using a cubic-spine function. From the initial set of ten biological replicates for each cell line, only 8 of the control, 7 of the HRAS, 9 of the KRAS, and all 10 of the NRAS samples provided measureable NMR signal from resonances other than the solvent peak. Therefore,
the results presented in this work represent data obtained from thoseNS=8 biological
replicates of the control cells, and thoseNS=7,NS=9, andNS=10 biological replicates
of the HRAS-, KRAS-, and NRAS-transformed cells.
The Chenomx NMR Suite Profiler was used to identify metabolites by fitting compound signatures from the provided NMR spectral library. In total, 37 metabolites were identified
by NMR. The effective NMR metabolite concentration in each sample, Smetabolite, was
calculated using the Chenomx NMR Suite Profiler by determining the heights of the compound signatures that best fit the sample spectra with the effective concentration
of the internal DSS standard being set toSDSS=0.1248 mM, which was the actual DSS
concentration in each sample. The table of identified metabolites and their signals was then exported and saved in an Excel worksheet.
Statistical analysis
The ‘‘effective’’ NMR cellular content for metabolite α (moles/cell) taken from thesth
biological replicate of a given cell type,C˜α,Cell types , was calculated by multiplyingSαby the
NMR sample volume (400.5µl) and by dividing by the number of cells used to make
up each NMR sample.C˜α,Cell types is related to theactualcellular content for metaboliteα,
Cα,Cell types , by the relationship ˜
Cα,Cell types =χsCell typefαCα,Cell types (1)
where χsCell type and fα are dimensionless proportionality factors. The sample- and
acquisition parameters (such as recycle delays, mixing times, magnetic field strength,
etc.) and metaboliteα’s spin topology and relaxation properties. This contribution can in
principle be found by applying the 1D NOESY sequence inFig. 1Ato prepared standards.
Thesample-andcell type-dependent factorχsCell type inEq. (1)is due to the overall metabolite extraction efficiency, which can vary from sample to sample and depends quite
sensitively on cell handling (Duarte et al.,2009) and the particular metabolic quenching
and extraction method employed in the study.
The variousC˜α,Cell types were used to calculate the ‘‘effective’’ NMR fraction of metabolite
α in each sample,xαCell type, as follows:
xαCell type=
˜ CαCell type
P37
j=1C˜
Cell type j
= fαC
Cell type
α
P37
j=1fjCjCell type
. (2)
As defined inEq. (2),xαCell type is dimensionless and independent of the number of cells in
a given biological replicate that were used to make the sample. More importantly,xαCell type
is independent of thesample-dependentfluctuation factor,χsCell type inEq. (1). The total
intensity normalization inEq. (2)is analogous to that used in spectral binning analysis
commonly employed in NMR metabolomic studies. Furthermore, if the variousfα are
identical for each metabolite, i.e.,fα= f for all metabolites, thenxαCell type inEq. (2)is
simply the mole fraction of metaboliteα for a given cell type (in general, this is not the
case, andfα6= fβ).
An ANOVA test, implemented using the MATLAB function ‘‘anova1’’ available in
MATLAB’s Statistics toolbox, was first used to test the hypotheses that
xαHRAS
=xαKRAS =
xNRAS
α
=xControl
α
for each metaboliteα, where
xCell type
represents the average value
ofx for a given cell type. The BY algorithm (Benjamini & Yekutieli,2001) implemented
in MATLAB (Groppe,2010) with the false discovery rate set to 0.01 was then applied
to the p-values from the ANOVA analysis to determine those metabolites where hxαi
significantly differed (adjustedp-values withp≤0.01) between at least two cell types. For
those metabolites identified by the ANOVA test, further post-hoc/multiple comparison
testing using the BY algorithm was performed to identify which pair(s) of cell typeshxαi
significantly differed (adjustedp-values withp≤0.01, which are given inTable S1). Finally,
a PCA of the variousxαCell type was performed using the ‘‘pca’’ command in the Statistics
toolbox in MATLAB, which by default, centers the data before performing the PCA.
Due to the similar average values of the ‘‘effective’’ NMR glutamate content,
xglutamate
,
observed in both the control and RAS-transformed cells (Fig. S1) and the relatively
large glutamate signals observed in all cells lines (only the lactate signals were larger on
average), an alternative to the total intensity normalization scheme used inEq. (2)was also
investigated whereby the metabolite signals were normalized by the observed glutamate
signal in each sample. In this case, the glutamate normalized signal for metaboliteα is
given by:
ξα,Cell typeglutamate= C˜
Cell type
α
˜
CglutamateCell type =
xαCell type
xglutamateCell type = fα
fglutamate×
CαCell type
ξα,Cell typeglutamate is directly proportional to the ratio of the actualcellular metaboliteα to
glutamate content, and, likexαCell type inEq. (2), it is also independent of the
sample-dependent fluctuation factor, χsCell type. A PCA of the various ξ Cell type
α,glutamate was also
performed, where in this case only 36 metabolites were considered in the analysis since
ξglutamateCell type,glutamate=1 in each sample by definition (Eq. (3)).
One advantage of using glutamate normalization inEq. (3)compared with using total
metabolite normalization inEq. (2)is that the ratio ofξα,glutamatebetween different cell
types is independent of thefαfactors and depends only on the actual cellular metabolite
contents:
ξα,Cell typeglutamate1 ξα,Cell typeglutamate2 =
CαCell type 1
CCell typeglutamate1
CαCell type2
CCell typeglutamate2
. (4)
The ratio inEq. (4)is equivalent to the relative fold change in the ratio of theactual
cellular metaboliteαto glutamate content between different cell types. In those instances
where a significant difference in
ξmetabolite,glutamate
between at least two cell types was identified by ANOVA and post-hoc/multiple comparison testing, quantitative confidence
intervals for the ratio inEq. (4)were calculated using Fieller’s method for unpaired data
(Motulsky,1995). In this case, the (100−α)% confidence range forξmetabCell type.,glut1/ξmetabCell type.,glut2.
inEq. (4), which is denoted byǫ(100−α)%
ξmetabCell type.,glut1.
ξmetabCell type.,glut2.
, is given by (Motulsky,1995):
ǫ(100−α)%
ξmetabCell type.,glut1. ξmetabCell type.,glut2.
= µ1
(1−g)µ2
1±t1−α
2,N1+N2−2
s
1−g
σ1
µ1
√
N1
2 +
σ2
µ2
√
N2
2
(5)
whereN1andN2are the number of biological replicates of cell types 1 and 2, respectively,
µ1 andσ1 are the average and standard deviations for ξ
Cell type1
metabolite,glutamate, respectively,
µ2 andσ2 are the average and standard deviations for ξCell type
2
metabolite,glutamate, respectively,
g=σ2t1−α2,N1+N2−2
µ2√N2
2
, and t1−α2,N1+N2−2is the 1−
α 2
th quantile of thet-distribution
withN1+N2−2 degrees of freedom. Ifg≥1, the relative fold change in cellular metabolite
to glutamate content cannot be calculated usingEq. (5). The MATLAB files and commands
used in the statistical analysis of the metabolomics data is given asFile S1.
RESULTS AND DISCUSSION
Generation of isogenic cell lines for the study
The results of immunoblotting total protein lysates from the four cell types against the
various RAS isoforms are shown in Fig. 1B. Western blotting with antibodies against
PC2 Scor
es
(x 100)
PC1 Scores (x 100)
−15 −10 −5 0 5 10 15 20 25
−15 −10 −5 0 5 10 15 Control NRAS KRAS HRAS 12 16 20
(A)
(B)
−0.6 −0.4 −0.2 0 0.2 0.4 0.6 0.8
−0.3 −0.2 −0.1 0 0.1 0.2 0.3 0.4 0.5 18 17 19
loading PC2 (16.3%)
loading PC1 (75.1%)
2 3 1 2 1 3 12 19 16 17 18 20
loading PC2 (17.0%)
loading PC1 (77.9%)
glutamate
0.2 0.4 0.6 0.8 1
0 0.1 0.2 0.3 0.4 0.5 0.6 0.7 0 Glutamate Normalizaton Total Metabolite Normalizaton
PC2 Scor
es
(x 10)
PC1 Scores (x 10) −0.2 −0.1 20 25 15 10 5 0 −5 −10 −15 8 4 0 −4 −8 Control NRAS KRAS HRAS 9 9
(C)
(D)
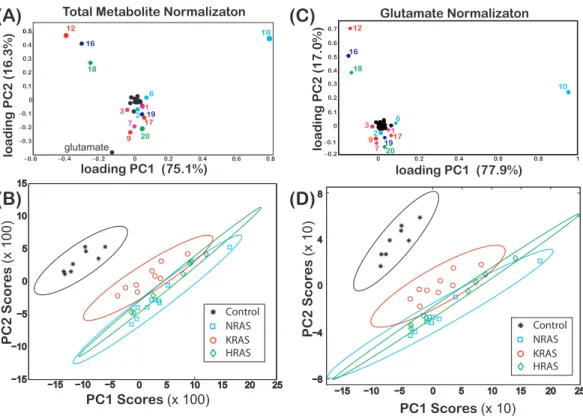
10 6 7 6 7 10Figure 2 Loadings and score plots for effective NMR metabolite fractions.PCA of the effective NMR
metabolite fractions,xmetaboliteinEq. (2), and glutamate normalized signals,ξmetabolite,glutamateinEq. (3), for
(asterisks) control and (diamonds) HRAS-, (circles) KRAS-, and (squares) NRAS-transformed cells. Load-ing plots forxmetabolite[(A) PC1 (75.1%) and PC2 (16.3%)] andξmetabolite,glutamate[(C) PC1 (77.9%) and PC2
(17.0%)] are shown. The identities of certain metabolites are denoted by the labels given inTable 1. Score plots of PC2 versus PC1 of centered data with the corresponding 99% confidence ellipses (Hoover,1984) are shown for both the (B)xmetaboliteand (D)ξmetabolite,glutamatedata. The results in this figure are fromNS=
8 biological replicates of the control cells andNS=7,NS =9, andNS=10 biological replicates of the
HRAS-, KRAS-, and NRAS-transformed cells, respectively.
immunoblotting against GAPDH, a housekeeping gene, as shown in the bottom lane of
Fig. 1B. Previous characterizations of these cell lines have also confirmed that the introduc-tion of the RAS oncogene confers soft agar colony growth in these cells, which is indicative
of oncogenic transformation (Rai et al.,2011;Patel et al.,2015;Giribaldi et al.,2015).
NMR-based characterization and PCA of metabolomic profiles
Representative spectra taken from a single biological replicate of the control and HRAS-,
KRAS-, and NRAS-transformed cells are shown in Fig. 1C, where the spectra were
normalized so that the DSS resonance atδ=0 ppm had the same intensity in all spectra
for display purposes only. Certain key metabolites are labeled using the codes, 1–21, given
inTable 1.
The loadings of PC1 (score of 75.1%) and PC2 (score of 16.3%) from a PCA ofxmetaboliteCell type
are shown inFig. 2A, where some of the components of both PC1 and PC2 are labeled using
the codes given inTable 1. InFig. 2B, a score plot of PC1 vs. PC2, with the corresponding
grouping between the control and the RAS-transformed cells. Similar results were also
observed when performing a PCA ofξmetaboliteCell type,glutamate as shown inFigs. 2Cand2D.
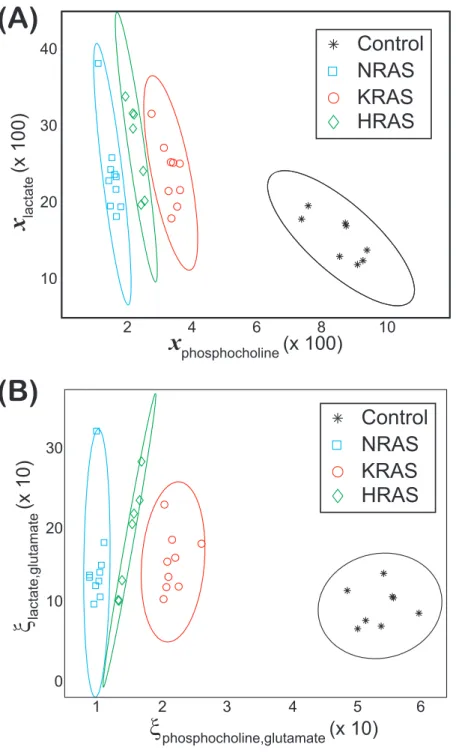
Non-overlapping groupings at the 99% confidence level betweenallcell lines were found
by plottingxlactateCell type vs.xphosphocholineCell type as shown inFig. 3A, which were mainly due to
differ-ences in the phosphocholine levels between cell types (Fig. 4). Likewise, non-overlapping
groupings betweenall cell lines, this time at a slightly lower confidence level of 97.5%,
were also found by plottingξlactateCell type,glutamatevs.ξphosphocholineCell type ,glutamateas shown inFig. 3B.
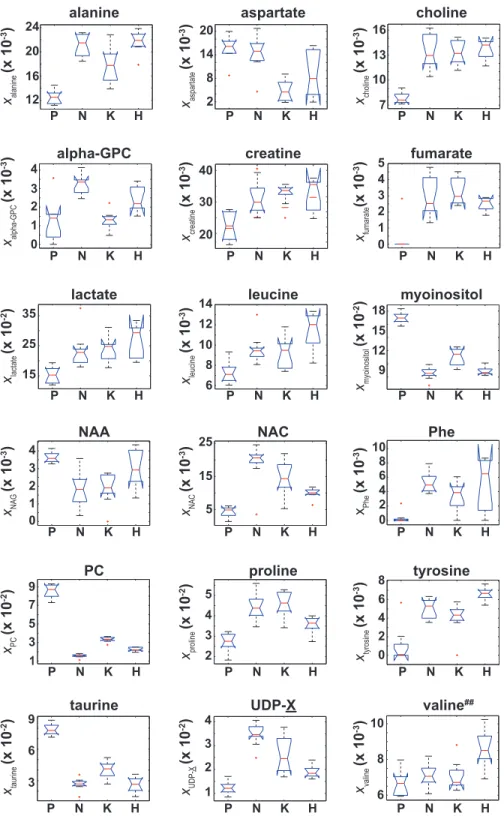
Of the 37 metabolites identified by NMR, an ANOVA analysis indicated that 18
metabolites had a significant (adjustedp-values withp≤0.01) difference in their ‘‘effective’’
NMR metabolite fraction (xα inEq. (2)) between at least two of the four cell types. Box
plots of xmetaboliteCell type for these 18 metabolites are given inFig. 4. Of these 18 metabolites,
post-hoc/multiple comparison testing using the BY algorithm found thatxmetaboliteCell type for 17
metabolites was significantly different between the control cells and at least one of the RAS-transformed cell types whereas the ‘‘effective’’ NMR cellular content for 6 metabolites significantly differed in at least two of the three RAS-transformed cell lines (adjusted
p-values≤0.01, which are given inTable S1). It should be noted that while the ANOVA
analysis indicated thathxvalinei was unequal between at least two of the four cell types,
post-hoc/multiple comparison testing could not identify any significant difference in
hxvalinei between cell lines.
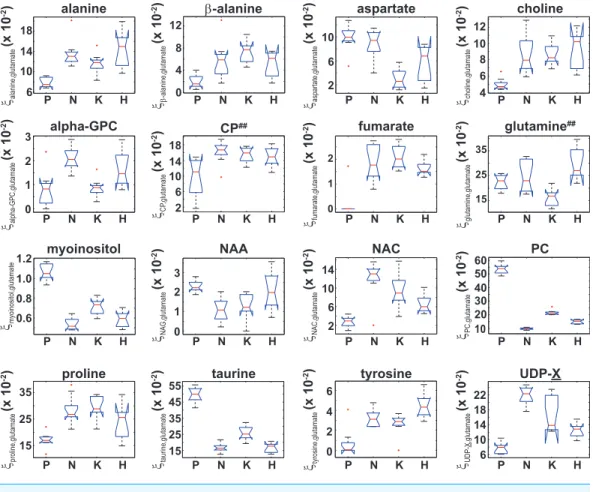
Similarly, an ANOVA analysis of the glutamate normalized metabolite content indicated
that 16 metabolites had a significant (adjusted p-values withp≤0.01) difference in
ξmetaboliteCell type ,glutamate (Eq. (3)) between at least two of the four cell types, and box plots of
ξmetaboliteCell type ,glutamatefor those 16 metabolites are shown inFig. 5. Post-hoc/multiple comparison
testing indicated thatξmetaboliteCell type ,glutamatesignificantly differed between the control cells and
at least one of the RAS-transformed cell types for 13 metabolites whereasξmetaboliteCell type ,glutamate
significantly differed between at least two of the three RAS-transformed cell lines for only 6
metabolites (adjustedp−values≤0.01, which are given inTable S2). It should also be noted
that while the ANOVA analysis indicated that
ξCP,glutamate
and
ξglutamine,glutamate
were unequal between at least two of the four cell types, post-hoc/multiple comparison testing
could not identify any significant difference in either
ξCP,glutamateorξglutamine,glutamate
between the cell lines. In those instances where a significant difference in
ξmetabolite,glutamate
between two cell types was identified by ANOVA and post-hoc/multiple comparison testing,
the 99% confidence intervals for the relative fold change in theactualcellular metabolite to
glutamate content between those cell types,ǫ99%
ξmetabCell type.,glut1.
ξmetabCell type.,glut2.
, were calculated using Fieller’s
method (Eq. (5)) and are given inTable 2. However, even though significant differences
between the RAS-transformed and control cells forξfumarate,glutamate
and between the
HRAS-transformed and control cells for
ξtyrosine,glutamate
were observed (Fig. 5andTable
S2), the 99% CIs for the relative fold change in the cellular fumarate to glutamate content
ξ
phosphocholine,glutamate(x 10)
1 2 3 4 5 6
30
20
10
0
Control
NRAS
KRAS
HRAS
ξ
lactate,glutamate(x 10)
2 4 6 8 10
10 20 30
40
Control
NRAS
KRAS
HRAS
x
lactate(x 100)
x
phosphocholine
(x 100)
(B)
(A)
Figure 3 Groupings observed for both the lactate vs. phosphocholine NMR metabolite fractions and
glutamate normalized signals.Scatter plots of both (A) the NMR metabolite fractions for lactate,xlactateCell type, versus phosphocholine,xphosphocholineCell type and (B) the glutamate normalized lactate,ξlactateCell type,glutamate, versus
phos-phocholine,ξphosphocholineCell type ,glutamate, found in the (asterisks) control and (diamonds) HRAS-, (circles) KRAS-,
and (squares) NRAS-transformed cells. Confidence ellipses (Hoover,1984) indicate that non-overlapping groupings for all four cell types can be observed at the (A) 99% for the NMR metabolites fractions and at the (B) 97.5% confidence levels for the glutamate normalized signals. In both cases, the results are from NS=8 biological replicates of the control cells andNS=7,NS=9, andNS=10 biological replicates of the
alanine
P N K H
xalanine (x 10 -3) 12 16 20 24 aspartate
P N K H
xaspartate (x 10 -3) 2 8 14 choline
P N K H
xcholine (x 10 -3) 7 10 16 13 alpha-GPC xalpha-GPC (x 10 -3) 0 1 2
P N K H
3
20
4
creatine
P N K H
xcreatine (x 10 -3) 20 30 40 fumarate
P N K H
xfumarate (x 10 -3) 0 1 2 3 4 5 lactate
P N K H
xlactate (x 10 -2) 15 25 35 leucine
P N K H
6 8 10 12 14 xleucine (x 10 -3) myoinositol
P N K H
9 12 15 18
NAA
P N K H
xmyoinositol (x 10 -2) 1 2 3 NAC
P N K H
xNAC (x 10 -3) 5 15 25 0 4 xNAG (x 10 -3) Phe
P N K H
xPhe (x 10 -3) 0 2 4 6 8 10 PC
P N K H
xPC (x 10 -2) 1 3 5 7 proline
P N K H
xproline (x 10 -2) 2 3 4 9 5 tyrosine
P N K H
xtyrosine (x 10 -3) 0 2 4 6 8 taurine
P N K H
xtaurine (x 10 -2) 3 6 9 UDP-X
P N K H
xUDP-X (x 10 -2) 1 2 3 4 valine##
P N K H
xvaline (x 10 -3) 6 8 10
Figure 4 Box plots of the NMR metabolite fractions identified by ANOVA analysis.Box plots of
xmetaboliteCell type for those 18 metabolites identified by an ANOVA analysis which indicatedhxmetaboliteiwas
unequal between at least two of the four cell types. While the ANOVA analysis identifiedhxvalinei,
post-hoc/multiple comparison testing could not identify any significant differences inhxvalinei between the
alanine
P N K H
ξalanine,glutamate (x 10 -2) 6 10 14 18 β-alanine
P N K H
ξβ-alanine,glutamate
(x 10 -2) 0 4 8 12 choline
P N K H
ξcholine,glutamate (x 10 -2) 4 6 10 12 8 alpha-GPC ξalpha-GPC,glutamate (x 10 -2) 0 1 2
P N K H
3 fumarate
P N K H
ξfumarate,glutamate (x 10 -2) 0 1 2 glutamine##
P N K H
ξglutamine,glutamate (x 10 -2) 15 25 35 NAC
P N K H
ξNAC,glutamate (x 10 -2) 2 6 10 14 proline
P N K H
ξproline,glutamate (x 10 -2) 15 25 35 tyrosine
P N K H
ξtyrosine,glutamate (x 10 -2) 0 2 4 6 UDP-X
P N K H
ξUDP-X,glutamate (x 10 -2) 6 10 14 18 22 aspartate
P N K H
ξaspartate,glutamate (x 10 -2) 2 6 10 myoinositol
P N K H
ξmyoinositol,glutamate0.6
0.8 1.0
1.2 NAA
P N K H
ξNAG,glutamate (x 10 -2) 1 2 3 0 PC
P N K H
ξPC,glutamate (x 10 -2) 10 20 30 40 50 60 taurine
P N K H
ξtaurine,glutamate (x 10 -2) 15 25 35 45 55 CP##
P N K H
ξCP ,glutamate (x 10 -2) 2 6 14 18 10
Figure 5 Box plots of the glutamate normalized signals identified by ANOVA analysis.Box plots
ofξmetaboliteCell type,glutamatefor those 16 metabolites that were identified by an ANOVA analysis that indicated
ξmetabolite,glutamate
was unequal between at least two of the four cell types. While the ANOVA analysis identified both
ξCP,glutamate
and
ξglutamine,glutamate
, post-hoc/multiple comparison testing could not identify any significant differences in either
ξCP,glutamate
and
ξglutamine,glutamate
between the cell lines, which is denoted by the superscript ‘##’.
NMR-based identification of metabolite differences among the transformed and control cell lines reflect RAS-driven physiologic alterations
Due to the Warburg effect (Warburg,1956), it is well known that oncogenic transformed
cells undergo aerobic glycolysis as opposed to oxidative phosphorylation (Dang,2012).
To establish the validity of our data against known metabolic changes, we assessed how differences in the NMR signals from lactate and alanine, two major byproducts of glycolytic
metabolism (DeBerardinis et al.,2007), varied among the different cell lines. The lactate
NMR signal was the largest NMR signal observed in all cell lines (Fig. 4), and lactate was also
the largest component to PC1 in the PCA analyses of bothxmetabolite andξmetabolite,glutamate
inFig. 2. In fact,xlactateHRASandxlactateKRAS were found to be statistically larger thanxlactateControl (Fig. 4
andTable S1). The cellular alanine to glutamate content was found to be elevated between
50%–75% in KRAS- and NRAS-transformed cells relative to the control cells (Table 2),
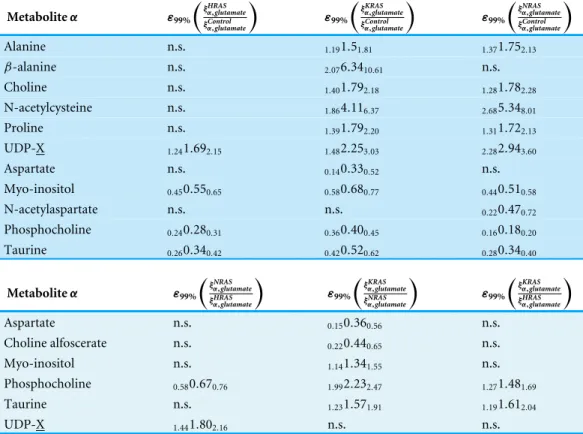
Table 2 99% confidence intervals for relative fold change in the ratio of actual cellular metabolite to glutamate content between cell types.99% confidence intervals (CIs) for the relative fold change in glut-mate normalized signals between cell lines calculated using Fieller’s method (Motulsky,1995) inEq. (5). The lower and upper limits of the 99% CIs are denoted by subscripts that bracket the middle of the CI in-terval (Louis & Zeger,2009). The abbreviation, n.s., indicates those cases when there was no significant statistical difference in
ξmetabolite,glutamate
found between cell lines from post-hoc testing using the BY al-gorithm (Benjamini & Yekutieli,2001) at a false discovery rate of 0.01. The 99% CIs for the relative fold changes in the cellular fumarate to glutamate content in all RAS-transformed cells relative to control cells and in the cellular tyrosine to glutamate content in HRAS-transformed cells relative to control cells could not be calculated due to the small signals and large scatter of fumarate and tyrosine observed in the con-trol cells (which gaveg>1 inEq. (5)).
Metaboliteα ε99%
ξα,glutamateHRAS
ξControl α,glutamate
ε99%
ξKRASα,glutamate
ξControl α,glutamate
ε99%
ξα,glutamateNRAS
ξControl α,glutamate
Alanine n.s. 1.191.51.81 1.371.752.13
β-alanine n.s. 2.076.3410.61 n.s.
Choline n.s. 1.401.792.18 1.281.782.28
N-acetylcysteine n.s. 1.864.116.37 2.685.348.01
Proline n.s. 1.391.792.20 1.311.722.13
UDP-X 1.241.692.15 1.482.253.03 2.282.943.60
Aspartate n.s. 0.140.330.52 n.s.
Myo-inositol 0.450.550.65 0.580.680.77 0.440.510.58
N-acetylaspartate n.s. n.s. 0.220.470.72
Phosphocholine 0.240.280.31 0.360.400.45 0.160.180.20
Taurine 0.260.340.42 0.420.520.62 0.280.340.40
Metaboliteα ε99%
ξNRAS
α,glutamate ξHRAS
α,glutamate
ε99%
ξKRAS
α,glutamate ξNRAS
α,glutamate
ε99%
ξKRAS
α,glutamate ξHRAS
α,glutamate
Aspartate n.s. 0.150.360.56 n.s.
Choline alfoscerate n.s. 0.220.440.65 n.s.
Myo-inositol n.s. 1.141.341.55 n.s.
Phosphocholine 0.580.670.76 1.992.232.47 1.271.481.69
Taurine n.s. 1.231.571.91 1.191.612.04
UDP-X 1.441.802.16 n.s. n.s.
RAS-transformed cells (Hahn & Weinberg,2002), although we should point out that our
study provides only a steady-state snapshot of the metabolic profile.
The cellular UDP-X (i.e., UDP-glucose, UDP-galactose, and/or UDP-glucourinate), which are important molecules in glucose metabolism and in the formation of cellular
polysaccharides (Berg, Tymoczko & Stryer,2002), to glutamate content was elevated
between a factor of 1.69–2.94 in the RAS-transformed cells lines relative to the control
cells (Table 2). Likewise, the cellular N-acetylcysteine, a thiolic antioxidant (Oikawa et
al.,1999), to glutamate content was also elevated in all RAS-transformed cells relative to
control cells (Fig. 5) with statistically significant differences occurring for the KRAS- and
NRAS-transformed cells, where CNAC
Cglutamate was 4.11 and 5.34 times larger relative to control
cells, respectively (Table 2). The elevated levels of N-acetylcysteine in RAS-transformed
cells is a significant finding given that RAS-transformed cells are known to exhibit elevated
The metabolomic signatures of two cellular osmolytes, taurine and myo-inositol, also showed significant differences between the RAS-transformed and control cells. The cellular taurine to glutamate content and the cellular myo-inositol to glutamate content were between 50–66% and 32–45% smaller in all RAS-transformed cells relative to the control
cells, respectively (Table 2). As osmolytes regulate the apoptotic cell death pathway (Lang
et al.,2005), the functional relevance of the lower values ofCmyo−inositol
Cglutamate and
Ctaurine
Cglutamate observed
in RAS-transformed cells may be related to their relative resistance to stress-induced programmed cell death.
An unexpected result from our study was the cellular phosphocholine to glutamate levels.
Choline metabolism is an important component in lipid biogenesis (Glunde, Bhujwalla &
Ronen,2011). The cellular phosphocholine to glutamate content in our study was between 60–82% smaller in the RAS-transformed cells relative to the control cells, and statistically
significant differences among the RAS-transformed cells were also observed (Fig. 5and
Table S2). Similarly, the cellular choline to glutamate content was around 1.78 times larger
in the KRAS- and NRAS-transformed cells relative to the control cells (Table 2). Although
there are reports indicating phosphocholine levels correlate with elevated malignancy (Aboagye & Bhujwalla, 1999;Ronen et al., 2001), exceptions in the published literature suggest that this conclusion may be specific to the RAS isoform and cell type being studied (Eliyahu, Kreizman & Degani,2007).
We have demonstrated in this work that 1H NMR can be used to identify unique
metabolomic signatures between BEAS-2B immortalized lung epithelial cells and those transformed with the isoforms of the RAS oncogene as well as among the three RAS isoforms. Collectively, our results suggest that measuring cellular metabolomic profiles can help in distinguishing between normal and RAS-transformed cells along with potentially distinguishing among cancer cells expressing different RAS isoforms. In the future, these results may aid in the development of potential screening technology to determine particular cancer treatment regimens.
ACKNOWLEDGEMENTS
The authors wish to thank Dr. Danny Yakoub (UM) for comments about the manuscript.
ADDITIONAL INFORMATION AND DECLARATIONS
Funding
Grant Disclosures
The following grant information was disclosed by the authors: Camille and Henry Dreyfus Foundation.
University of Miami.
James and Esther King Florida Biomedical New Investigator Research Grant: 09KN-11. National Institutes of Health: R01 CA175086.
National Science Foundation: CHE—1056846.
Competing Interests
The authors declare there are no competing interests.
Author Contributions
• Vered Marks and Anisleidys Munoz performed the experiments, wrote the paper,
prepared figures and/or tables, reviewed drafts of the paper.
• Priyamvada Rai conceived and designed the experiments, contributed
reagents/materi-als/analysis tools, wrote the paper, prepared figures and/or tables, reviewed drafts of the paper.
• Jamie D. Walls conceived and designed the experiments, analyzed the data, contributed
reagents/materials/analysis tools, wrote the paper, prepared figures and/or tables, reviewed drafts of the paper.
Data Availability
The following information was supplied regarding data availability:
The raw data has been supplied asData S1.
Supplemental Information
Supplemental information for this article can be found online athttp://dx.doi.org/10.7717/
peerj.2104#supplemental-information.
REFERENCES
Aboagye EO, Bhujwalla ZM. 1999.Malignant transformation alters membrane choline
phospholipid metabolism of human mammary epithelial cells.Cancer Research
59:80–84.
Beckonert O, Keun HC, Ebbels TMD, Bundy JG, Holmes E, Lindon JC, Nicholson JK. 2007.Metabolic profiling, metabolomics and metabonomic procedures for
NMR spectroscopy of urine, plasma, serum, and tissue extracts.Nature Protocols
2:2692–2703.
Benjamini Y, Yekutieli D. 2001.The control of the false discovery rate in multiple testing
under dependency.The Annals of Statistics29:1165–1188.
Berg JM, Tymoczko JL, Stryer L. 2002.Biochemistry. Fifth edition. New York: W.H. Freeman.
Bos JL. 1989.rasoncogenes in human cancer: a review.Cancer Research49:4682–4689.
Castellano E, Santos E. 2011.Functional specificity of ras isoforms.Genes & Cancer
Dang CV. 2012.Links between metabolism and cancer.Genes & Development
26:877–890DOI 10.1101/gad.189365.112.
DeBerardinis RJ, Mancuso A, Daikhin E, Nissim I, Yudkoff M, Wehrli S, Thompson CB. 2007.Beyond aerobic glycolysis: transformed cells can engage in glutamine metabolism that exceeds the requirement for protein and nucleotide synthesis. Proceedings of the National Academy of Sciences of the United States of America
104:19345–19350DOI 10.1073/pnas.0709747104.
Downward J. 2003.Targeting RAS signaling pathways in cancer therapy.Nature Reviews
Cancer3:11–22DOI 10.1038/nrc969.
Duarte IF, Marques J, Ladeirinha AF, Rocha C, Lamego I, Calheiros R, Silva TM, Marques MPM, Melo JB, Carreira IM, Gil AM. 2009.Analytical approaches toward
successful human cell metabolome studies by NMR spectroscopy. 2009.Analytical
Chemistry81:5023–5032DOI 10.1021/ac900545q.
Eliyahu G, Kreizman T, Degani H. 2007.Phosphocholine as a biomarker of breast
cancer: molecular and biochemical studies.International Journal of Cancer
120:1721–1730DOI 10.1002/ijc.22293.
Fernandez-Medarde A, Santos E. 2011.Ras in cancer and developmental diseases.Genes
& Cancer2:344–358DOI 10.1177/1947601911411084.
Giribaldi MG, Munoz A, Halvorsen K, Patel A, Rai P. 2015.MTH1 expression is
re-quired for effective transformation by oncogenic H-RAS.Oncotarget 6:11519–11529
DOI 10.18632/oncotarget.3447.
Glunde K, Bhujwalla ZM, Ronen SM. 2011.Choline metabolism in malignant
transfor-mation.Nature Reviews Cancer11:835–848DOI 10.1038/nrc3162.
Gottschalk M, Ivanova G, Collins DM, Eustace A, O’Connor R, Brougham DF. 2008.Metabolomic studies of human lung carcinoma cell lines usingin vitro
1H NMR of whole cells and cellular extracts.NMR in Biomedicine21:809–819
DOI 10.1002/nbm.1258.
Griffin JL, Schockor JP. 2004.Metabolic profiles of cancer cells.Nature Reviews Cancer
4:551–561DOI 10.1038/nrc1390.
Groppe D. 2010.Benjamini & Hochberg/Yekutieli procedure for controlling false
discov-ery rate.Available at
http://www.mathworks.com/matlabcentral/fileexchange/27418-benjamini-hochbergyekutieli-procedure-for-controlling-false-discovery-rate/content/ fdr_bh.m. MATLAB Central File Exchange.
Hahn WC, Weinberg RA. 2002.Rules for making human tumor cells.New England
Journal of Medicine347:1593–1603DOI 10.1056/NEJMra021902.
Hoover WE. 1984.Algorithms for confidence circles and ellipses. NOAA Technical
Report. NOS 107 C & GS. Rockville: Charting and Geodesic Services.Available at
http:// www.ngs.noaa.gov/ PUBS_LIB/ AlgorithmsForConfidenceCirclesAndEllipses_TR_ NOS107_CGS3.pdf.
Lang F, Foller M, Lang KS, Lang PA, Ritter M, Gulbins E, Vereninov A, Huber SM. 2005.Ion channels in cell proliferation and apoptotic cell death.Journal of
Li W, Zhu T, Guan K-L. 2004.Transformation potential of RAS isoforms correlates with
activation of phosphatidylinositol 3-kinase but not ERK.The Journal of Biological
Chemistry279:37398–37406DOI 10.1074/jbc.M405730200.
Louis TA, Zeger SL. 2009.Effective communication of standard errors and confidence
intervals.Biostatistics10:1–2DOI 10.1093/biostatistics/kxn014.
Mckay RT. 2011.How the 1D-NOESY suppresses solvent signal in metabonomics
NMR spectroscopy.Concepts in Magnetic Resonance, Series A38A:197–220
DOI 10.1002/cmr.a.20223.
Morvan D, Demidem A. 2007.Metabolomics by proton nuclear magnetic resonance spectroscopy of the response to chloroethylnitrosourea reveals drug efficacy and
tumor adaptive metabolic pathways.Cancer Research67:2150–2159.
Motulsky H. 1995.Intuitive biostatistics. First edition. New York: Oxford University Press.
Oikawa S, Yamada K, Yamashita N, Tada-Oikawa S, Kawanishi S. 1999.
N-acetylcysteine, a cancer chemopreventive agent, causes oxidative damage to cellular
and isolated DNA.Carcinogenesis20:1485–1490DOI 10.1093/carcin/20.8.1485.
Omerovic J, Hammond DE, Clague MJ, Prior IA. 2008.Ras isoform abundance and
signaling in human cancer cell lines.Oncogene27:2754–2762
DOI 10.1038/sj.onc.1210925.
Parikh C, Subrahmanyam R, Ren R. 2007.Oncogenic NRAS, KRAS, and HRAS
exhibit different leukemogenic potentials in mice.Cancer Research67:7139–7146
DOI 10.1158/0008-5472.CAN-07-0778.
Patel A, Burton DGA, Halvorsen K, Balkan W, Reiner T, Perez-Stable C, Cohen A, Munoz A, Giribaldi MG, Singh S, Robbins DJ, Nguyen DM, Rai P. 2015.MutT Homolog 1 (MTH1) maintains multiple KRAS-driven pro-malignant pathways.
Oncogene34:2586–2596DOI 10.1038/onc.2014.195.
Patel A, Muñoz A, Halvorsen K, Rai P. 2012.Creation and validation of a ligation-independent cloning (LIC) retroviral vector for stable gene transduction in
mam-malian cells.BMC Biotechnology12:3DOI 10.1186/1472-6750-12-3.
Rai P, Young JJ, Burton DGA, Giribaldi MG, Onder TT, Weinberg RA. 2011. En-hanced elimination of oxidized guanine nucleotides inhibits oncogenic
RAS-induced DNA damage and premature senescence.Oncogene30:1489–1496
DOI 10.1038/onc.2010.520.
Ronen SM, Jackson LE, Belouche M, Leach MO. 2001.Magnetic resonance detect changes in phosphocholine associated with RAS activation and inhibition in
NIH-3T3 cells.British Journal of Cancer84:691–696DOI 10.1054/bjoc.2000.1663.
Sambrook J, Fritsch JEF, Maniatis T. 1989.Molecular cloning: a laboratory manual. Second edition. Cold Spring Harbor, New York: Cold Spring Harbor Laboratory Press, Appendix B.12.
Southam AD, Easton JM, Stentiford GD, Ludwig C, Arvanitis TN, Viant MR. 2008.
Metabolic changes in flatfish hepatic tumours revealed by NMR-based metabolomics
and metabolic correlation networks.Journal of Proteome Research7:5277–5285
Walsh AB, Bar-Sagi D. 2001.Differential activation of the Rac pathway by Ha-Ras and
K-Ras.The Journal of Biological Chemistry276:15609–15615
DOI 10.1074/jbc.M010573200.
Warburg O. 1956.On the origin of cancer cells.Science123:309–314
DOI 10.1126/science.123.3191.309.
Whitwam T, VanBrocklin MW, Russo ME, Haak PT, Bilgili D, Resau JH, Koo HM, Holmen SL. 2007.Differential oncogenic potential of activated RAS isoforms in
melanocytes.Oncogene26:4563–4570DOI 10.1038/sj.onc.1210239.
Yan J, Roy S, Apolloni A, Lane A, Hancock JF. 1998.Ras isoforms vary in their ability
to activate Raf-1 and phosphoinositide 3-kinase.The Journal of Biological Chemistry
273:24052–24056DOI 10.1074/jbc.273.37.24052.
Young TW, Mei FC, Yang G, Thompson-Lanza JA, Liu JS, Cheng XD. 2004.Activation of antioxidant pathways in Ras-mediated oncogenic transformation of human surface ovarian epithelial cells revealed by functional proteomics and mass