Available Online at www
.
ijecse
.
org
ISSN- 2277-1956
Use of Information System and lean manufacturing to
reduce the waste in the process industry
Abhishek Kumar Singh
1, Rahul Singh Sisodiya
2, Rakesh Bisht
3, Ankur Maheshwari
4 1,3Assistant professor of Computer Science & Engineering2Assistant professor of Electronic & Communication Engineering 2Assistant professor of Electrical Engineering
1
Abstract:The objective of this paper is to introduce the work of information technology in the process industry. In the industry the time is used as the money. So here the main task is to save time. In the industry the maximum time spent due to the waste. Lean Manufacturing is a term that is used to reduce the waste from the industry. It also use the information system in the form of Kanban. Lean principles and techniques have been applied in a wide variety of organizations, from make-to-stock to engineer-to-order industries, and even in typical service sectors, such as healthcare. In order to apply lean principles in various areas, variants were developed of well known techniques, such as Kanban, Kaizen, SMED, and 5S. Here the discrete and continuous manufacturing benefits are distinguished by the value stream mapping. Here the Value stream mapping is used to first map the current state and then used to identify sources of waste and to identify lean tools to try to eliminate this waste.The future state map is then developed for a system with lean tools applied to it. This thesis focuses on the development of a simulation model of the industry.
Key Word: Lean Manufacturing, Value Stream Mapping, Simulation, Process Industries, Copper wire, Kanban.
---
I. Introduction
After the world war-II Japanese were using the scraps and build new usable thing. They build many types of machines and fulfill their other requirement. Japanese were facing financial problem too. So they tried to minimize the cost of
manufacturing the new product. So they focused on the unnecessary things and their elimination. So the lean concept came in focus.
By the US rule:
The rule fallowed by the Japanese was:
After success of LEAN in Japan other organization the term “Lean” as Womack and Jones (1994) define it denotes a system that produce the same output with less input as those created by a traditional mass production system. Lean is to manufacture only what is needed, when it is needed and what quantities ordered. As the Japanese rule the cost is deriving, it means that the Japanese always involved in reduction in the cost. For the reduction in the cost the information system played main role. Kanban is used as the form of information. In the industry information goes from the customer to retailer, retailer to manufacturer and manufacturer to supplier and the product goes from supplier to manufacturer, manufacturer to retailer and in the last retailer to customer. Here we can reduce the time of transportation to save the delivery time. But in the manufacturing unit the waste is not like only transportation but other wastes are also there like over production, over processing, unnecessary motion, waiting, transportation and inventory.
manufacture. He decided he must stop the repairing of poor quality by intense study of each stage of the process. In 1936, when Toyota won its first truck contract with the Japanese government, his processes hit new problems and he developed the "Kaizen" improvement teams. At Toyota, Shingo developed the concept of single minute exchange of dies (SMED) to reduce set up times (Shingo, 1997); for instance, setup times in large punch presses could be reduced from hours to less than ten minutes. This has a big effect on reducing lot sizes. Another way to reduce inventory is by trying to minimize machine downtime (Shingo, 1997). This can be done by preventive maintenance. All types of companies, manufacturing, process, distribution, software development or financial services can benefit from adopting lean philosophy. As long as a company can identify a value stream, from when the customer’s order product to when they receive it, lean principles can be applied and waste removed. (Singh, 1999).
Lean Manufacturing Tools and techniques:
The main lean manufacturing tools and techniques are quick change over, pull/kanban system, 5s system, value stream analysis, total productive maintenance and cellular manufacturing (ME, 2011).
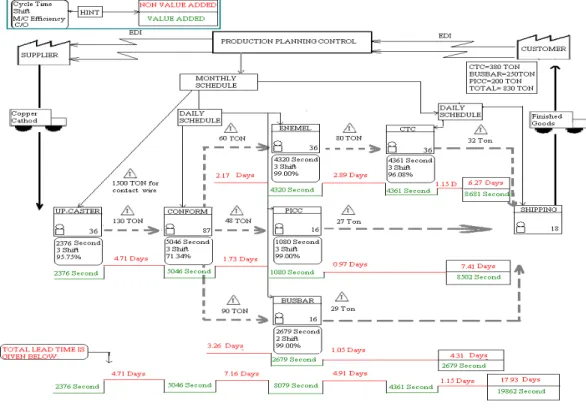
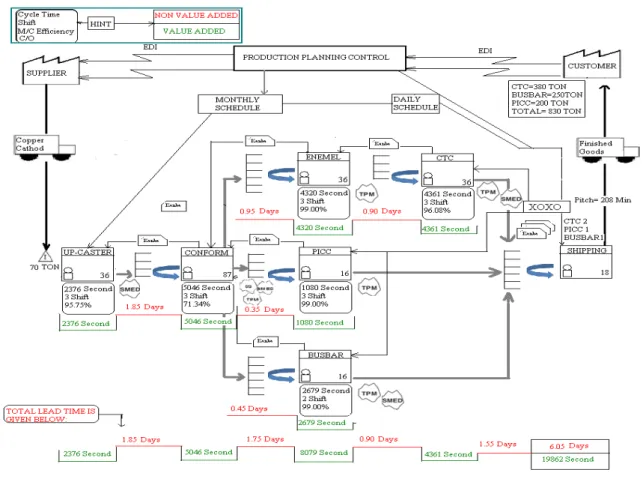
In the case of copper wire manufacturing unit the process starts with up-caster. The next machine is Conform Machine i.e. continuous extrusion machine. The third process is stripping, the strips are used in the three types of wire one is enameled to CTC, second is PICC and in the last the busbar. So, here we need production leveling method to stop the over production and wait time. In this company the two types of enameling method are available one is PVA and other is Epoxy. To under stand the structure of the industry we need to draw the current state map. The current state map is draw with the help of the Microsoft visio10 and the start e-VSM software. To draw the value stream mapping in the process industry for all variety is too difficult. Therefore here I took only one variety of a product. After the current state mapping we will draw the future state map. After the current state mapping we will draw the future state map. In the Future state mapping we can see the effect of elimination of waste. As we see the figure 1, the customer demand move to production planning and control department and then to supplier. Here the information are not come from the department like upcaster, conform, enamel, PICC, BUSBAR, and CTC. So the whole demand will give to supplier on the basis of hypothesis. This is the critical problem which can create two type of waste like waiting or inventory. Waiting arises, when demand goes less than the real demand. Inventory arises, when the demand goes more than real demand. So here we can introduce the term information system like KANBAN. The kanban is in the form of card which will produce with the required demand and after fixed amount spent. It is also helpful in scheduling. To compare these two techniques like current state map and future state map we need a VALUE STREM MAP.
II. Value Stream Map
The value stream map is a tool which draws the current state map and future state map. The current state mapping is one of the parts of the value steam mapping. From this mapping the wastes are identified easily. This mapping makes all the processes visual. Here the inventory is the main cause of waste. The inventory creates non value added time. It means lead time may be viewed as two related issues. The large amount of inventory waits for long time in queue for the process i.e. creates large lead time. Large amount of inventory is the main cause of increase in cost i.e. holding cost and maintenance cost. All the demands order by the customer from EDI (Electronic Data Interchange). Data collection for the material flow started at the shipping department and worked backward all the way to the blast furnace process, gathering snapshot data such as inventory levels before each process, process cycle times (CTs), number of workers and change over times. It should be noted that data was collected whilst walking the shop floor and talking to the foreman and operators at each workstation. Data collection for the material flow started at the shipping department, and worked backward all the way to the blast furnace process, gathering snapshot data such as inventory levels before each process, process cycle times, number of workers, and changeover times.
ton per day. Similarly we can find all the time before each process. Here we do not consider the amount of raw material at beginning of the production, the reason being that ABC owns their raw material sources and the raw material sources and raw material is thus not an issue for them.
Time for Inventory Triangle=
Figure 1. Current state map
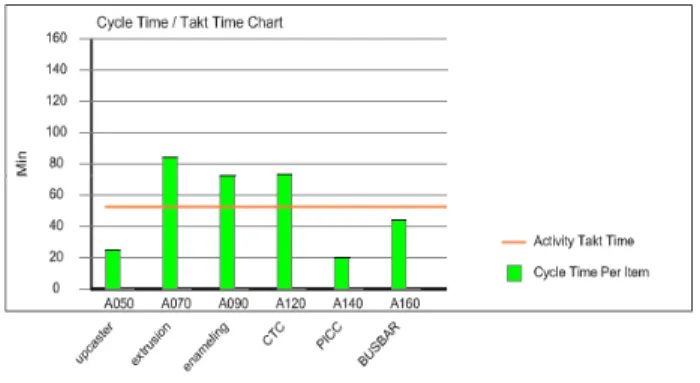
In this organization we calculate the takt time for extruded product like CTC, PICC and BUS-BAR. Here we can see in the fig 5.1 that total demand per month is 830 ton. Now we calculate the demand for a day i.e. 27.67 ton per day. In a day, 3 working shifts are available each shift has 8 hours. In each shift 8 hour (480 min) min are available. So for all shifts in a day total time is 480*3=1440 min. Therefore, Takt-Time= 1440/27.67 = 52.04 min/ton. This Takt time not mean that a ton of product has to be made in the 52.04 minutes, but rather that one must be completed every 52.04 minutes on average. A “supermarket” is nothing more than a buffer area (space allocated for product storage) for products that are ready to be shipped, located at the end of the production process (Rother and Shook, 1999). The shipping department can use a kanban signal to authorize the movement of the product from the supermarket. The amount of space designated would depend on the number of kanban allocated to the supermarket.Industry should designate an area at the warehouse (which would be called the supermarket) and store the coils based on a kanban system. Whenever the supermarket inventory is below a certain level this would trigger the temper mill to schedule the annealed products to replenish the supermarket according to the pitch.
A pull signal from the shipping area is eventually transmitted to enameling section to replenish the super market in front of the CTC.
The second, third and Fourth supermarkets are placed after the extrusion section and before the PICC, enameling section and BUSBAR. A kanban pull system will be used to regulate the replenishment of this supermarket. The kanban at the supermarkets follow the standard rules of a pull system. For example the enameling section (supplier) is allowed to process the next enameled flat copper wire (strip) in a line as long as there is an empty enameled strip in the super market for the strip before CTC (customer). IF the supermarket is at its capacity then it means enameling section does not need another strip. In this case there are two things that can be done either the extrusion line can slow its production rate to match that of CTC or it should be halted. The first option is costly in the copper industry, while the second is almost always infeasible. Therefore if the supermarket at the enameling line is full our recommendation is that it be switched to satisfy requirements for the other types, while avoiding shutting down the enameling line.
Manufacturing assets in the copper industry are such that they cannot easily move in to the classical cellular arrangement and batch size are typically fixed. However, ABC does have a continuous flow at its hot end i.e. up-caster. Rather than the up-caster in the industry there is no continuous flow, and cannot join due to scheduling restriction. Therefore, the focus at the cold end should be on developing a system to enable pull by the customer, rather than continuous flow.
Figure 2. Processes cycle time
chain (“pacemaker” Single point in the production process) To stop overproduction at any workstation in the value stream, only one point in the value stream need to be scheduled. This point is called the pacemaker process, because this point sets the pace of production for all the upstream process together. Every workstation upstream produces by a pull signal from the next downstream process and flow downstream from the pacemaker must occur in a continuous manner. The pacemaker process is usually the most downstream continuous flow in the value stream, so there should be no supermarket downstream of the pacemaker process (Rother and Shook, 1999).
Level the production at the pacemaker process ABC processes three variations of the extruded product. They are CTC, PICC, and BUSBAR. ABC should send a schedule to the pacemaker process (shipping department) that would ensure making every part at a constant rate. A formula will be used (Monden, 1993) that determines the product sequence that levels the mix and has a constant rate for the three different products. The formula is:
Xij= (j- 0.5)* i =1,2,...,n and j=1,2…Di
Where,
n= the number of different products to be made
Di= the integral number of units demanded per day for product i.
T= D1+D2+…+Dn be the total number of units of all products to be made
Xij= ideal completion or due date for job (unit) j of product i.
For our case n=3, while the Di values are: 13, 7, and 8 for CTC, PICC and BUSBAR, respectively. Thus T is equal to 28. Ordering these jobs according to dij sorted (shown in Table 4) one can see a pattern start to develop, yielding
the following approximate sequence for smooth production (CTC-CTC-BUSBAR-PICC), (CTC -BUSBAR-PICC- CTC)… etc. We could just simplify the sequence to (CTC-CTC-BUSBAR-PICC).
III. Production system
A push system and a pull system are two levels for comparison that are used for the production system factor. Here push system represent the current situation at the copper wire manufacturing company where the product are pushed by the system and the pull system shows the future state map in mind. The pull system is based on the kanban pull system where the product will be pulled from the upstream processes.
In the simulation model, the system modeled as a pull system using kanbans to control the inventory between the workstations. This is done by modeling each kanban between a pair of workstations as a resource. An arriving entity seizes one kanban and one workstation at the same time. As soon as the workstation finishes processing the entity, the workstation is released; however, the kanban is retained. The entity then proceeds to the next workstation. At this point the entity seizes the workstation and a new kanban from the kanban set for this latter workstation, while simultaneously releasing the kanban from the previous workstation. Thus the kanban from one workstation is held until the entity receives a kanban from the subsequent workstation. This ensures that the former does not begin work until it gets a pull signal from the latter. In other words, the part retains the kanban from the former workstation until it receives the next kanban authorization movement to the following workstation (Marek et al., 2001). Since each product in the super market has a kanban card attached to it, the average system WIP level may be found by calculating the sum of the average utilization of the kanban resources in the simulation. The comparison of WIP inventory for the push and the pull is based on the inventory ahead of Conform process and downstream to shipping.
IV. Total productive Maintenance
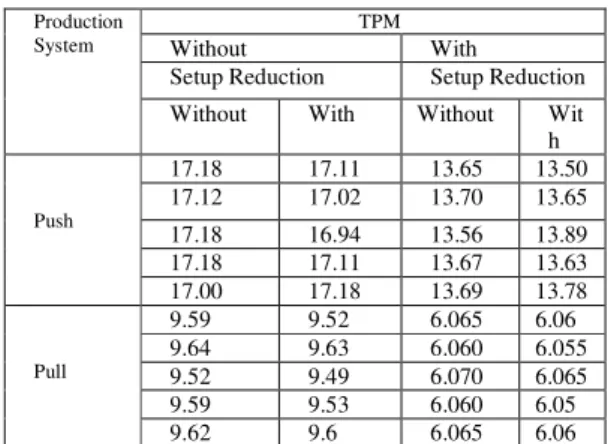
The two levels for the TPM factor are labeled “without” and “with.” The “without” level represents current maintenance procedures followed by company as explained in Question 8 in the future state map. The “with” level will be the proposed TPM procedure, which was also explained in Question 8. The latter procedure splits the scheduled maintenance time, i.e., separates the maintenance process into smaller portions that are done more frequently. Also, each individual unit is requiring maintenance must be planned in such a way that the inventory shortages that have been created by work stoppage for maintenance flow down through the process.
V. Setup Reduction
The two levels for the setup reduction factor are also labeled “without” and “with.” The “without” level is the current situation at company with setup times the same as they are now. The “with” level will assume that the proposed setup reduction procedure explained in Question 8 in the future state map will enable company to drive their changeover times down. Again, the changeover reduction times were selected based on a reasonable and optimistic approach, with values that are realistic for company to drive their changeover time down according to the procedures explained in previous in the future state map.
VI. Lead-time performance
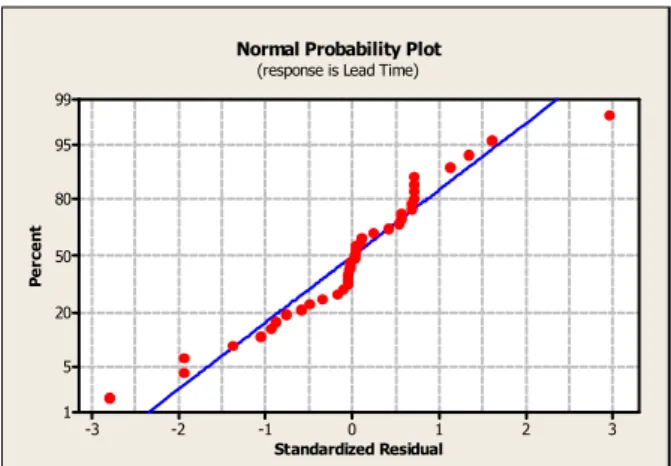
analysis of variance (anova) was used to formally study the results and determine the significance and magnitude of all effects and interactions. all the statistical analysis was done by the minitab 16. The estimated effects and coefficients for the fitted regression model and anova table are shown in table 1 and 2 respectively.
Table 2. Estimated effect and Coefficients for Lead-time
Table 3 Analysis of Variance for Lead-time
The ANOVA output from Minitab sums up the main effect for the three factors in one measures, which is shown written in ANOVA table as Main Effects” as shown in table 2.The p-value for the main effect is virtually equal to zero, so that we may conclude that some or all of the main effects are significant. Minitab uses the t test shown in Table 1. reveal that the production system and TPM are significant and that setup reduction, the 2-way interaction, and the 3- way interaction are not significant i.e. 2-way interaction means Prod Sys*TPM, Prod Sys*Setup red and TPM*Setup red, similarly 3-way interaction means Prod Sys*TPM*Setup Red and Main Effect is Prod Sys, TPM and Setup red.
Production System
TPM
Without With
Setup Reduction Setup Reduction Without With Without Wit
h
Push
17.18 17.11 13.65 13.50 17.12 17.02 13.70 13.65
17.18 16.94 13.56 13.89 17.18 17.11 13.67 13.63 17.00 17.18 13.69 13.78
Pull
3 2 1 0 -1 -2 -3 99
95
80
50
20
5
1
Standardized Residual
P
e
rc
e
n
t
Normal Probability Plot
(response is Lead Time)
Figure 3. Normal probability plot of residuals
Figure 4. Main effects plots for Average lead-time
VII. Revisited future state map
Fig. 5 Future state map
VIII. Conclusion and Future Scope
In the starting our goal is to investigate the effect of the lean manufacturing tools and technique and information system in the process industry with the case of Copper wire industry. We take three tools in the program to see the effect on the industry. We got that TPM, information system like kanban and Production system are the tools that affect the industry in large amount, but the setup reduction affect in minor amount. Here the test of this experiment is on the lead time. In the current state map we see the lead time is 17.93 days and in the future state map the lead time is of 6.05 days, a reduction of almost 66.25%. The lead time would not go down further if setup reduction was used and the analysis of the factorial design confirmed that setup reduction was not significant.
In the future scope of this project is that if we collect the cost of the waiting time, over production, failures of the system and other wastes then we can extend the model as cost oriented. By which we can get the actual cost of the waste that increase the cost of product.
Reference
[1]. Abdulmalek, A., & Rajgopal, J. (2007). Analyzing the benefits of lean manufacturing and value stream mapping via simulation: A process sector case study. International journal of production economics , 223-236.
[3]. Billesbach, J. (Third Quarter, 1994). Applying Lean Production Principles To A Process Facility. Production and Inventory Management Journal , 40-44.
[4]. Cook, R., & Rogowski, R. (1996). Applying JIT principles to continuous process manufacturing supply chains. Production and Inventory Management Journal , 12-16.
[5]. Fled, M. (2000). Lean Manufacturing: Tools, Techniques, and how to use them. Boca Raton, London: The St. Lucie Press. [6]. Jain, R. K. (2006). "Production Technology" a text book for engineering student. Khanna Publisher.
[7]. Levy, D. (winter 1997). Lean Production in an International Supply Chain. Sloan Management Review , 94-102. [8]. Liker, J. K., & Lamb, T. (2000). Lean Manufacturing Principles Guide (Version 0.5 ed.). University of Michigan.
[9]. Lixa, C., & Bo, M. (2011). The Three-Stage Method for Chinese Enterprises to Deploy TPM. Research Paper Published by Changchun University of Science and Technology , 5 (1), 51-58.
[10].Marek, R., Elkins, D., & Smith, D. (2001). Understanding the Fundamentals of Kanban and Conwip Pull Systems Using Simulation. Proceedings of the 2001 Winter Simulation Conference , 921-929.
[11].Monden, Y. (2003). Toyota Production System. Norcross, Georgia: Industrial Engineering and Management Press.
[12].Monden, Y. (1998). Toyota Production System-An Integrated Approach to Just-in-time (3rd edition ed.). Norcross, Georgia: Engineering & Management Press.
[13].Ohno, T. (1997). Toyota Production System. Beyond large-scale production.
[14].Riveraa, L., & Frank, C. F. (2007). Measuring the impact of Lean tools on the cost–time investment. Robotics and computer integrated manufacturing , 684–689.
[15].Rotaru, A. (2008). Implementing Lean Manufacturing. Published Article by University of Pitesti .
[16].Rother, M., & J., S. (1999). Learning to See: value stream mapping to add value and eliminate muda (1.2 ed.). Brookline, MA: The Lean Enterprise Institute.
[17].Shingo, S. (1997). A Study of the Toyota production system from an industrial engineering Viewpoint. Cambridge, MA: Productivity Press.