Application of Lean Strategy to Redesign the Assembly Process Flow of Glow Plug
Rahul Vylen * Department of Mechanical Engineering PES Institute of Technology Bangalore - 560085, India
Email addres: [email protected]
N. Rajesh Mathivanan Department of Mechanical Engineering PES Institute of Technology Bangalore - 560085, India Email addres:[email protected]
N. Shashidhar Chandrasekhar Process Engineering Department Robert Bosch India Private Limited Bangalore - 560030 , India Email addres:[email protected]
A B S T R A C T K E Y W O R D S
A R T I C L E I N F O
Assembly Flow Process, Six-Sigma,
Value Stream Mapping (VSM).
Received 01 January 2013 Accepted 01 June 2013 Available online 30 June 2013
Lean manufacturing is an applied methodology of scientific objective techniques which will improve the tasks in a process to be performed with a minimum of non-value-added activities. It is being increasingly adopted as a potential solution for many automotive manufacturing industries. This paper addresses the implementation of lean principles in an automotive component manufacturing company with a focus on current manufacturing practices and visual identification of non-value-added time, such as bottle necking, waiting time and material handling, etc. The typical operations involved in making the Glow Plug are caulking, tig welding, MgO filling & O-ring pressing, swaging, facing, thread rolling, inspection and assembly. The facing operation can be eliminated by stabilizing the variations generated during the MgO filling machine. The MgO filling activity contains various forms of non-value-added activities such as worn-out gripper, insufficient clamping tension, physical shaking of the WPC on the agitation unit instead of fine vibration, Jerky insertion of the WPC shank into the agitation locator. It was identified that approximately 15mm material was wasted per piece, though there is no value addition on
the part. This project utilizes Lean tools such as “Six Sigma” and “Value Stream Mapping” procedures. Resolving and improving the
above problems resulted in drastic increase in productivity by 87% from 82%, reduction in the rejections by 13% from 18%, reduction in the manufacturing lead time by 2.62 days/annum, reduction in the utilization of shop floor space by 6m2 and also the manufacturing cost by 1.16 million INR/ annum.
________________________________ * Corresponding Author
1. Introduction And Literature Review
2
widely used in discrete manufacturing (Womack and Jones, 1996). Applications have spanned many sectors including automotive, electronics, white goods, and consumer products manufacturing (Womack, 2000). In order to achieve the improved market share and compete with their global counterparts, automotive component manufacturing industries in India necessarily need to improve productivity while ensuring lower cost and world class quality. However, it is strongly believed that unnecessary capital investment is not going to solve the problem; rather this will turn out to be a waste in the long run. In this direction, the implementation of lean principles is highly recommended, in order to identify the areas generating waste, thus it further facilitates the optimization of the operating conditions in a minimal investment.
Six Sigma being one of the lean tools, was developed in 1986 by Motorola Inc. as a metric for measuring defects and improving quality. According to Krajewski et al. (2007), Six Sigma has evolved to being a comprehensive and flexible system for achieving, sustaining, and maximizing business success by minimizing defects and variability in processes. The principle basis of Six Sigma methodology is that, if one can measure how many defects or failures any business or process has, one can find ways to systematically eliminate them (Manual D, 2006). The name Six Sigma originates from the Greek letter sigma (σ) that is used by statisticians to denote the standard deviation or variability of a process. In a process with Six Sigma capability, process variation is reduced to no more than 3.4 defects, per million opportunities. This can be thought in two ways: a process is correct 99.9964% of the time, or 99.9965% of process fall within six standard deviations of the mean. A defect can be defined as non conformity of a product or service to its specifications. It is to be kept in mind that all processes vary, but too much variation is costly (Fairbanks, 2007).
Six Sigma by Define Measure Analyzse Improve and Control(DMAIC) approach which refers to a data-driven improvement cycle used for improving, optimizing and stabilizing business processes and designs (De Feo, 2005).
The five phases in the DMAIC project methodology are: • Define high-level project goals and the current process.
• Measure key aspects of the current process and collect relevant data.
• Analyze the data to verify cause-and-effect relationships. Determine what the relationships are, and attempt to ensure that all factors have been considered.
• Improve or optimize the process based upon data analysis using techniques like design of experiments.
• Control to ensure that any deviations from target are corrected before they result in defects. Set up pilot runs to establish process capability, move on to production, setup control mechanisms and continuously monitor the process.
DMAIC integrates itself into several quality control tools. These quality cont rol tools are very important to any organization as it is concerned with the quality of its product while it is important that quality requirements are satisfied and production schedules are meet, it is equally important that the finished product meets the established specifications.
3 2. Manufacturing Assembly Sequence
The lean tool Value Stream Mapping(VSM) applied as a method to lead the activities. In order to visualize the non-value-added activities it was decided to first construct the current state value map.
2.1 Constructing The Current State Value Stream Map
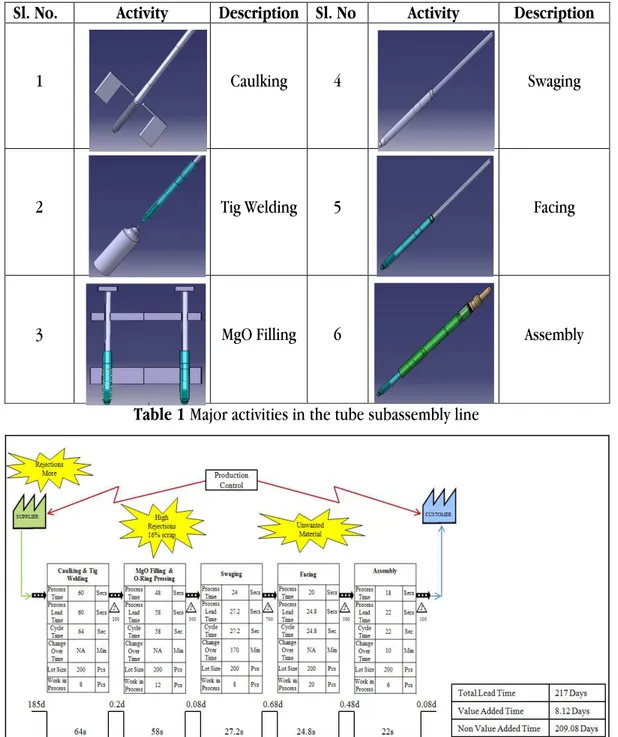
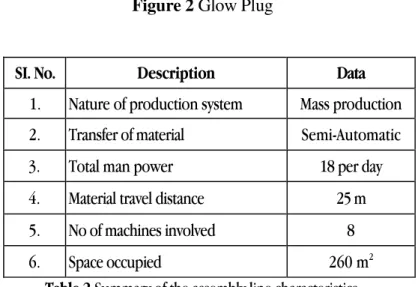
Relevant information from various departments was collected to construct the current state value stream. Information related to the assembly line, such as cycle time at each work stations, machine down time for each process, inventory, change-over time, set-up time, number of workers and operational hours per day are also collected and documented properly. Table 1 summarizes the major activities associated with tube subassembly line. To complete the value map, a timeline is added at the bottom of the map recording the total processing time and the value-added time. Finally, the value stream map for the current state is constructed as shown in Fig. 1.
Sl. No. Activity Description Sl. No Activity Description
1 Caulking 4 Swaging
2 Tig Welding 5 Facing
3 MgO Filling 6 Assembly
Table 1 Major activities in the tube subassembly line
4
From the current state value map, it is found that only 8.12 days were value-added activities, compared to 217 days of non-value-added activities. The following sub-sections describe a planned and integrated approach adopted to reduce the non-value-added activities.
3. PROBLEM DEFINITION
The objective of this paper is to use a case-based method to demonstrate how lean manufacturing principles when used appropriately, can help the industry to eliminate waste, improve product quality, reduce lead time and obtain better overall financial and operational control. A large scale automotive component manufacturing company's Glow Plug assembly line is used to illustrate the method followed. The company assembles Glow Plug for major automotive Original Equipment Manufacturers (OEM) companies. The typical operations involved for making the Glow Plug are caulking, tig welding, MgO filling, swaging, facing, thread rolling, inspection, NDT testing and assembly Fig. 2 shows the product handled in the assembly line. Table 2 summarizes the overall nature of the assembly line.
Figure 2 Glow Plug
SI. No. Description Data
1. Nature of production system Mass production 2. Transfer of material Semi-Automatic
3. Total man power 18 per day
4. Material travel distance 25 m
5. No of machines involved 8
6. Space occupied 260 m2
Table 2 Summary of the assembly line characteristics
To be a cost competitive among the similar product competitors, company had a target to reduce the manufacturing cost. After several brain storming and a thorough Value Stream Mapping walk in the shop floor, it was observed that the Glow Plug assemble line consists of various forms of non-value-added activities. The various forms of non-value-added activities are as follows:
Material wastage. More WIP inventory. Waiting time.
5 4. Implementation of Six Sigma by DMAIC approach
DMAIC is generally implemented in five improvement phases, Define, Measure, Analyze, Improve and Control. The DMAIC problem-solving methodology was implemented in a company is described as follows:
4.1 Define Phase
In the Define Phase, the problem statement, goals, and the factors which were critical to quality were identified and discussed. By doing so five major outputs were obtained from this phase:
Value Stream Mapping: Value and Non-Value-added processes.
Project Charter: many variables affecting the tolerance; the First yield Pass (FPY) was 82% and scrap was 18%.
Measurable customer requirements: The required length of the Connector was L6 (105.80±0.2mm). Rejection Pareto: Calculate the rejection rate of the present assembly flow.
Critical to Quality (CTQ): Identify the critical parameters in the process.
4.2 Measure Phase
In this phase Data Collection Plan (DCP) was plotted and was performed for duration of 6 weeks in order to collect the relevant data pertaining to the corresponding process in the assembly line. Statistical tools such as Process Capability and Process Capability Index (Cp Cpk) was used to calculate the process parameters of the MgO filling machine and Facing machine which did not meet the Global specification of 1.33. Hence the process was considered very unstable.
4.3 Analysis Phase:
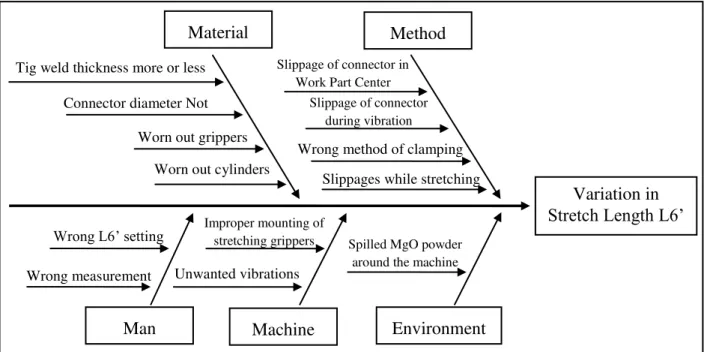
Based on the data collected from the measure phase, a Cause and Effect Diagram was plotted in order to make the process clear and understand MgO Filling machine.
Figure 3 Cause and Effect Diagram
A methodology was formulated to remove the variations generated during the MgO filling machine. The methodology consisted of various improvements, which are described in the Improve phase.
Slippage of connector during vibration
Material Method
Man Machine Environment
Variation in Stretch Length L6’
Connector diameter Not OK
Tig weld thickness more or less
Worn out grippers
Worn out cylinders
Slippage of connector in Work Part Center
Wrong method of clamping
Slippages while stretching
Wrong L6’ setting
Wrong measurement
Improper mounting of stretching grippers
Unwanted vibrations
6 4.4 Improve Phase:
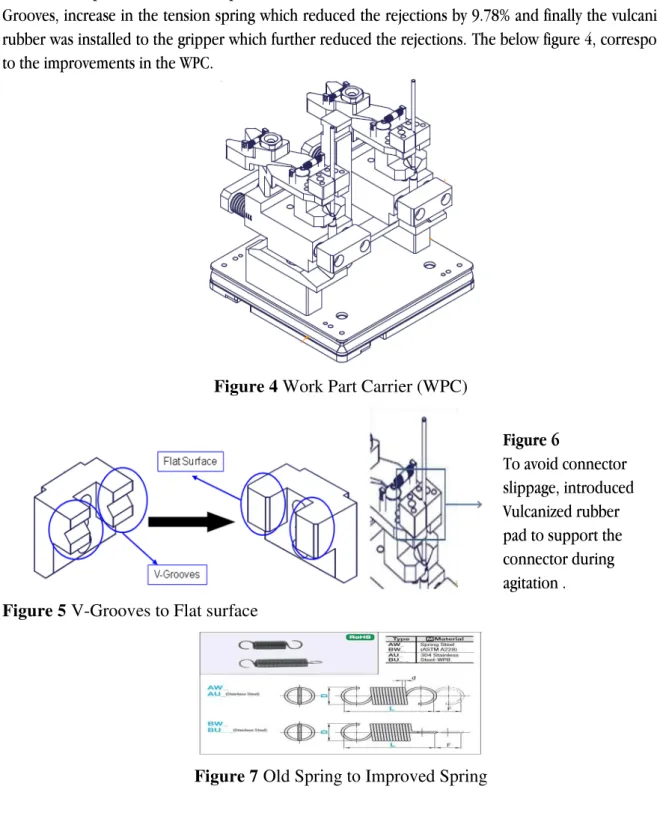
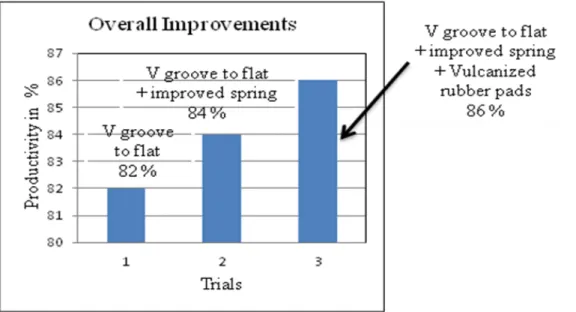
Various improvements were implemented to the WPC such as switch over from V-Grooves to Flat Grooves, increase in the tension spring which reduced the rejections by 9.78% and finally the vulcanized rubber was installed to the gripper which further reduced the rejections. The below figure 4, corresponds to the improvements in the WPC.
Figure 4 Work Part Carrier (WPC)
Figure 5 V-Grooves to Flat surface
Figure 7 Old Spring to Improved Spring
Table 3 Specifications of the springs
Specifications Old Spring (AWY4-20) Improved Spring (AWY10-30)
Wire diameter 0.4mm 1.0mm
Dynamic load
Max deflection F max 16.8mm 11.5mm
Max Load 3.24 N 15 N
Initial Tension 0.59 N 3.73 N
Spring constant 0.16 N/mm 0.98 N/mm
Figure 6
7 Figure 8 Overall Improvements
4.5 Control Phase:
Following are the controls taken up after standardization of improvements:
Initiated Engineering Change Request (ECR) for standardization of tension springs.
Established preventive maintenance inspection (second level) for vulcanized rubber and Grippers.
Updation of standard drawings of connector stretching station.
5. Elimination of the Facing machine
A series of trials were conducted on the connector lengths starting from 85mm to 65mm in the increments of 5mm, in order to meet the standard specifications of the customer requirement, and therefore eliminated the facing machine. 76.6mm±0.5mm from the default 90mm±0.5mm is the new connector length for the complete removal of the facing machine.
Finally a Value Stream Design (VSD) was plotted to indicate the redesign of the assembly flow process.
8 6. Conclusions
The implementation of lean principles has led to the following: Improvement in the sigma level from 2.42 to 2.67 Improvement in the production up to 87%.
Redesigning the assembly process flow by eliminating a machine in the assembly line.
Reduction in 14±1.5 mm connector length waste by increasing the quality level of the MgO filling machine.
An annual savings of 1.16 Million INR.
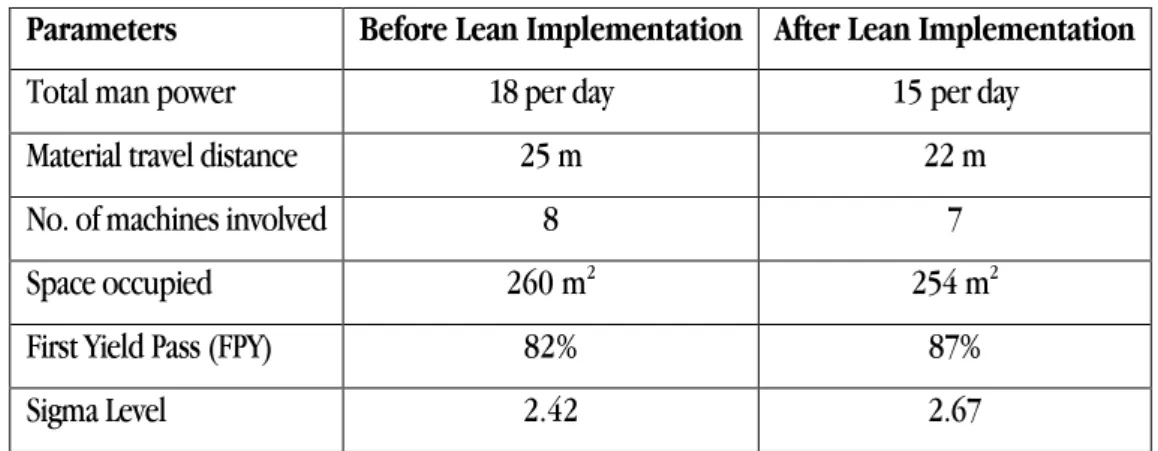
Parameters Before Lean Implementation After Lean Implementation
Total man power 18 per day 15 per day
Material travel distance 25 m 22 m
No. of machines involved 8 7
Space occupied 260 m2 254 m2
First Yield Pass (FPY) 82% 87%
Sigma Level 2.42 2.67
Table 4 Comparison before and after lean implementation
The above results shows drastic improvements by the use of lean technique, which has led to the increase in efficiency of the process line.
REFERENCE
De Feo, Joseph A; Barnard , William, JURAN Institute’s Six SigmaBreakthrough and Beyond – Quality Performance Breakthrough Methods. TataMcGraw–Hill Publishing Company Limited, 2005
Fairbanks C.B, Using Six Sigma and Lean Methodologies to Improve or Throughtput AORN86 (1), 2007, pp 79-82.
Krajewski J., Malhotra M., & Ritzman B., Operation Management-Process and Value Chains 8th edition. Upper Saddle Rives, Nj , USA: Pearson Education, Inc, 2007.
Liker JK , Becoming lean, Productivity Press, Portland, 1998.
Manual D, Six Sigma methodology: Reducing defect in business processes Filtration & Separation 43(1), 2006, pp. 34-36.
Womack and Jones, Lean Thinking: Banish waste and create wealth in your corporation. Simon & Schuster, New York, 1996.