Cholelithiasis and Nephrolithiasis in
HIV-Positive Patients in the Era of Combination
Antiretroviral Therapy
Kuan-Yin Lin1, Sih-Han Liao2, Wen-Chun Liu3, Aristine Cheng2, Shu-Wen Lin4,5, Sui-Yuan Chang6,7, Mao-Song Tsai8, Ching-Hua Kuo4,9, Mon-Ro Wu3, Hsiu-Po Wang3*, Chien-Ching Hung3,10,11*, Shan-Chwen Chang3
1Division of Infectious Diseases, Department of Internal Medicine, Taipei City Hospital, Kun-Ming Branch, Taipei, Taiwan,2Department of Internal Medicine, National Taiwan University Hospital Hsin-Chu Branch, Hsin-Chu, Taiwan,3Department of Internal Medicine, National Taiwan University Hospital and National Taiwan University College of Medicine, Taipei, Taiwan,4Department of Pharmacy, National Taiwan University Hospital, Taipei, Taiwan,5Graduate Institute of Clinical Pharmacy, National Taiwan University, Taipei, Taiwan,6Department of Laboratory Medicine, National Taiwan University Hospital, Taipei, Taiwan,
7Department of Clinical Laboratory Sciences and Medical Biotechnology, National Taiwan University College of Medicine, Taipei, Taiwan,8Department of Internal Medicine, Far Eastern Memorial Hospital, New Taipei City, Taiwan,9School of Pharmacy, National Taiwan University, Taipei, Taiwan,10 Department of Medical Research, China Medical University Hospital, Taichung, Taiwan,11China Medical University, Taichung, Taiwan
*[email protected](CCH);[email protected](HPW)
Abstract
Objectives
This study aimed to describe the epidemiology and risk factors of cholelithiasis and nephro-lithiasis among HIV-positive patients in the era of combination antiretroviral therapy.
Methods
We retrospectively reviewed the medical records of HIV-positive patients who underwent routine abdominal sonography for chronic viral hepatitis, fatty liver, or elevated aminotrans-ferases between January 2004 and January 2015. Therapeutic drug monitoring of plasma concentrations of atazanavir was performed and genetic polymorphisms, including UDP-glucuronosyltransferase (UGT) 1A1*28 and multidrug resistance gene 1 (MDR1) G2677T/ A, were determined in a subgroup of patients who received ritonavir-boosted or unboosted atazanavir-containing combination antiretroviral therapy. Information on demographics, clinical characteristics, and laboratory testing were collected and analyzed.
Results
During the 11-year study period, 910 patients who underwent routine abdominal sonogra-phy were included for analysis. The patients were mostly male (96.9%) with a mean age of 42.2 years and mean body-mass index of 22.9 kg/m2and 85.8% being on antiretroviral
ther-apy. The anchor antiretroviral agents included non-nucleoside reverse-transcriptase inhibi-tors (49.3%), unboosted atazanavir (34.4%), ritonavir-boosted lopinavir (20.4%), and
OPEN ACCESS
Citation:Lin K-Y, Liao H, Liu W-C, Cheng A, Lin S-W, Chang S-Y, et al. (2015) Cholelithiasis and Nephrolithiasis in HIV-Positive Patients in the Era of Combination Antiretroviral Therapy. PLoS ONE 10(9): e0137660. doi:10.1371/journal.pone.0137660
Editor:Giuseppe Vittorio De Socio, Azienda ospedaliero-universitaria di Perugia, ITALY
Received:March 9, 2015
Accepted:August 19, 2015
Published:September 11, 2015
Copyright:© 2015 Lin et al. This is an open access article distributed under the terms of theCreative Commons Attribution License, which permits unrestricted use, distribution, and reproduction in any medium, provided the original author and source are credited.
Data Availability Statement:All relevant data are within the paper.
ritonavir-boosted atazanavir (5.5%). The overall prevalence of cholelithiasis and nephro-lithiasis was 12.5% and 8.2%, respectively. Among 680 antiretroviral-experienced patients with both baseline and follow-up sonography, the crude incidence of cholelithiasis and nephrolithiasis was 4.3% and 3.7%, respectively. In multivariate analysis, the independent factors associated with incident cholelithiasis were exposure to ritonavir-boosted atazanavir for>2 years (adjusted odds ratio [AOR], 6.29; 95% confidence interval [CI], 1.12–35.16)
and older age (AOR, 1.04; 95% CI, 1.00–1.09). The positive association between duration
of exposure to ritonavir-boosted atazanavir and incident cholelithiasis was also found (AOR, per 1-year exposure, 1.49; 95% CI, 1.05–2.10). The associated factors with incident
nephrolithiasis were hyperlipidemia (AOR, 3.97; 95% CI, 1.32–11.93), hepatitis B or C
coin-fection (AOR, 3.41; 95% CI, 1.09–10.62), and exposure to abacavir (AOR, 12.01; 95% CI,
1.54–93.54). Of 180 patients who underwent therapeutic drug monitoring of plasma
ataza-navir concentrations and pharmacogenetic investigations, we found that the atazaataza-navir con-centrations and UGT 1A1*28 and MDR1 G2677T/A polymorphisms were not statistically significantly associated with incident cholelithiasis and nephrolithiasis.
Conclusions
In HIV-positive patients in the era of combination antiretroviral therapy, a high prevalence of cholelithiasis and nephrolithiasis was observed, and exposure to ritonavir-boosted atazana-vir for>2 years was associated with incident cholelithiasis.
Introduction
Both cholelithiasis and nephrolithiasis are widespread conditions constituting a major health burden, affecting an estimated 10–15% and 2–20% of the adult population, respectively [1]. The prevalence and incidence of cholelithiasis and nephrolithiasis vary with geographic loca-tions and have increased over the past decades [2,3]. The increasing rates of cholelithiasis and nephrolithiasis are multifactorial, and several demographic and metabolic factors have been identified as risk factors [1]. In contrast, few studies have investigated the epidemiology of cho-lelithiasis and nephrolithiasis in people infected with HIV [4,5]. Previous studies have linked protease inhibitors (PIs) to cholelithiasis and nephrolithiasis, for example indinavir, a first-gen-eration PI, which is well known for its crystallization in urine [6]. More recently, ritonavir-boosted atazanavir (atazanavir/ritonavir) has been associated with cholelithiasis and nephro-lithiasis [4,7,8]. However, the impact of atazanavir/ritonavir exposure on cholelithiasis and nephrolithiasis remains difficult to estimate since screening methods using sonography were not routinely performed [9].
Modifiable risk factors of cholelithiasis and nephrolithiasis such as offending drugs are worthwhile to identify. In some circumstances, therapeutic drug monitoring (TDM) has been applied to minimize indinavir-related nephrolithiasis [10,11]. While no direct evidence of the association has been established between plasma atazanavir concentrations and cholelithiasis and nephrolithiasis, switch from atazanavir/ritonavir to unboosted atazanavir guided by TDM may reduce atazanavir-related hyperbilirubinemia [12]. On the other hand, UDP-glucurono-syltransferase (UGT) 1A1 and multidrug resistance gene 1 (MDR1) 2677 may also alter plasma atazanavir concentrations, with unknown consequences on the rate of atazanavir-induced cho-lelithiasis and nephrolithiasis [13,14]. In this study, we aimed to investigate the prevalence and
incidence of cholelithiasis and nephrolithiasis, and to identify their associated factors among HIV-positive Taiwanese patients.
Patients and Methods
Ethics statement
This study was approved by the Research Ethics Committee of National Taiwan University Hospital (registration number, NTUH-201404010RIN). All patients signed written informed consent to provide their clinical and laboratory data for research before recruitment.
Study population and study setting
This retrospective cohort study was conducted at the National Taiwan University Hospital, which is the major designated hospital for HIV care in Taiwan. HIV-positive patients were eli-gible for recruitment if they were aged 20 years or greater and had undergone routine abdomi-nal sonography for chronic viral hepatitis, fatty liver, or elevated aminotransferases between January 2004 and January 2015. The sonography was performed according to routine clinical practice and not specifically for the study. Both antiretroviral-naive and-experienced patients were included, but patients with uncertain previous antiretroviral regimens and cholecystec-tomy prior to sonography were excluded.
According to the Taiwanese treatment guidelines for HIV infection, non-nucleoside reverse-transcriptase inhibitor (nNRTI)-containing regimens are the preferred regimens for antiretroviral-naive patients [15]. During the study period, the available PIs included nelfina-vir, saquinanelfina-vir, indinanelfina-vir, ritonavir-boosted lopinanelfina-vir, atazananelfina-vir, and darunavir.
Data collection
The abdominal sonography was performed by certified physicians, and the hepatobiliary and genitourinary systems were completely imaged on the sonography for detection of gallstones and renal stones. All patients were followed until gallstones or renal stones were detected, they were lost to follow-up, or to 31st January, 2015 when this study terminated, whichever
occurred first. Only the sonographic results after the diagnosis of HIV infection were recorded, and the first positive sonographic results or the latest negative sonographic results for gall-stones or renal gall-stones were used for analysis in patients having undergone sonography more than once.
A standardized case record form was used to collect clinical information prior to the sonog-raphy, which included demographics, body-mass index (BMI), underlying diseases, HIV-related factors such as hepatitis B or C coinfection, history and duration of antiretroviral ther-apy, baseline and follow-up CD4 lymphocyte counts, plasma HIV RNA loads (PVL), and labo-ratory data (liver-function tests, lipid profile, estimated glomerular filtration rate [GFR], serum uric acid, urine pH, and urinary crystal). We recorded the history of all prior and current anti-retroviral regimens with exposure duration>3 months before abdominal sonography, and a
history of exposure to nNRTIs or PIs for>2 years was regarded as a variable in logistic
regres-sion according to the previous study [4].
Chronic hepatitis B coinfection was defined as the persistence of hepatitis B virus surface antigen for>6 months, and hepatitis C coinfection was defined by positive HCV
Laboratory investigations
CD4 lymphocyte count and plasma HIV RNA load. CD4 lymphocyte count was deter-mined using flow cytometry (BD FACS Calibur, Becton Dickinson and Coulter Epics XL, Beck-man Coulter, CA, USA). PVL was quantified using the Cobas AmpliPrep/Cobas TaqMan HIV-I test (version 2.0, Roche Molecular Systems, Inc.) with a lower detection limit of 20 cop-ies/mL since June 2012.
Determination of plasma atazanavir concentrations. To optimize antiretroviral therapy, TDM of the two most commonly used antiretroviral agents, efavirenz and atazanavir, has been available at this hospital since 2009 [16]. In this study, the patients who underwent TDM of plasma atazanavir concentrations and determinations of genetic polymorphisms and had under-gone sonography were included to investigate the correlation between stone formation and plasma atazanavir concentrations. We collected the closest data that antedated the date of abdominal sonography. The recommended trough plasma concentration (Ctrough) of atazanavir
ranges between 0.15 and 0.85 mg/L, which is associated with virological suppression and less unconjugated hyperbilirubinemia [17]. Either mid-dosing interval (C12) or trough (C24)
concen-tration was determined using high-performance liquid chromatography (HPLC) based on a vali-dated method by Ramachandran et al. with minor modifications [18]. The detailed methods for determination of plasma atazanavir concentrations are available in the supplement(S1 Text).
Genetic polymorphisms. Two genetic polymorphisms of UGT 1A1 and MDR1 2677 were determined according to previous studies with minor modifications [19,20]. Genomic DNA was extracted from peripheral blood mononuclear cell with use of the Wizard Genomic DNA purification kit (Promega, WI, USA). The TATA box of the UGT1A1 promoter and genotypes at the MDR1 locus were determined by polymerase chain reaction (PCR) amplification and further sequenced or restriction fragment-length polymorphism (RFLP) analysis, respectively. The other detailed methods for determination of genetic polymorphisms are available in the supplement(S1 Text).
Investigations of prevalence and incidence of and factors associated
with cholelithiasis and nephrolithiasis
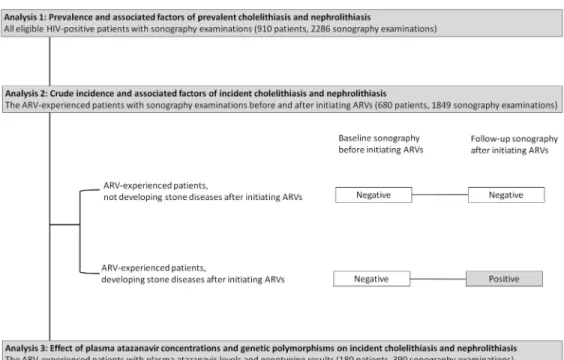
This study comprised separate analyses(Fig 1). Analysis 1 included all eligible HIV-positive patients who had undergone routine abdominal sonography to estimate the prevalence of cho-lelithiasis and nephrolithiasis and their associated factors. Analysis 2 included only the antire-troviral-experienced patients who had undergone sonography before and after initiating antiretroviral therapy to determine the crude incidence of cholelithiasis and nephrolithiasis and their associated factors. Patients in analysis 2 were classified as antiretroviral-experienced patients who did not develop cholelithiasis and/or nephrolithiasis and antiretroviral-experi-enced patients who developed cholelithiasis and/or nephrolithiasis after therapy. Analysis 3 included only the subset of patients on atazanavir for more than 3 months with TDM and genetic polymorphism data to determine the effect of plasma atazanavir concentrations and genetic polymorphisms on the occurrence of incident cholelithiasis and nephrolithiasis.
Statistical analysis
We used descriptive statistics to evaluate distributions of patients’demographics and clinical characteristics. Categorical variables were compared with a chi-square test or Fisher’s exact test if the expected values were<10. Continuous variables were described as mean ± standard deviation
tests were two-tailed andP<0.05 was considered statistically significant. The crude incidence of
stone disease was the rate at which new cases with cholelithiasis or nephrolithiasis occurred dur-ing the study period. Associated factors with prevalent or incident cholelithiasis and nephro-lithiasis were identified using multivariate logistic regression model. Variables considered for entry into multivariate logistic regression model included variables withPvalues<0.10 in
uni-variate analysis. 95% confidence intervals (CIs) of odds ratios (ORs) were computed to estimate the effects of each variable on cholelithiasis and nephrolithiasis. Statistical analyses were per-formed using SPSS software version 17.0 (SPSS Inc., Chicago, IL, USA).
Results
Analysis one: the prevalence and factors associated with prevalent
cholelithiasis and nephrolithiasis
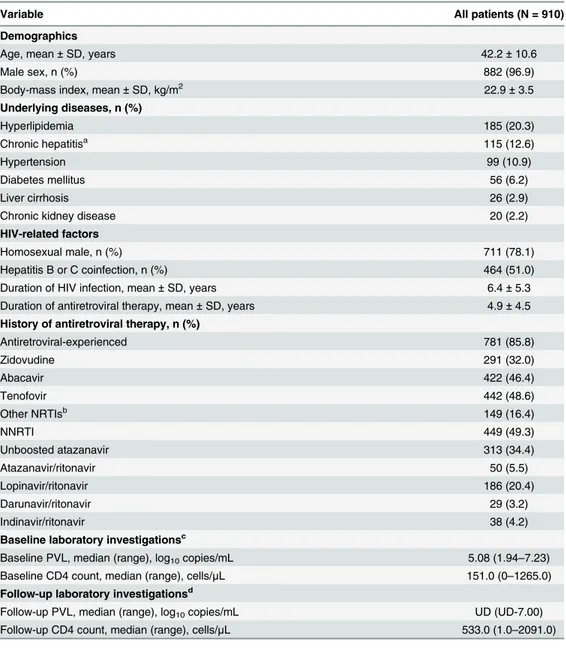
During the 11-year study period, we included 910 HIV-positive Taiwanese patients who had undergone abdominal sonography for chronic hepatitis B or C (464/910, 51.0%), fatty liver (343/910, 37.7%), or elevated aminotransferases (268/910, 29.5%). The total number of raphy performed among these patients was 2286, and the median interval of follow-up sonog-raphy was 329 days (interquartile range [IQR], 189–490 days). The demographics and clinical characteristics of these 910 patients are summarized inTable 1. Most patients were male (96.9%) with a mean age of 42.2 years and mean BMI of 22.9 kg/m2. Nearly half (51.0%) of the patients had had a history of chronic hepatitis B or C coinfection, for which serial follow-up abdominal sonography was performed. The major underlying diseases were hyperlipidemia (20.3%), followed by chronic hepatitis (12.6%) and hypertension (10.9%). The percentage of patients who were taking antiretroviral therapy was 85.8% (781/910), and the anchor antiretro-viral agents combined with 2 NRTIs included nNRTIs (49.3%), unboosted atazanavir (34.4%), lopinavir/ritonavir (20.4%), and atazanavir/ritonavir (5.5%).
Fig 1. Flow diagram of patient selection for three analyses. Abbreviation:ARV, antiretroviral.
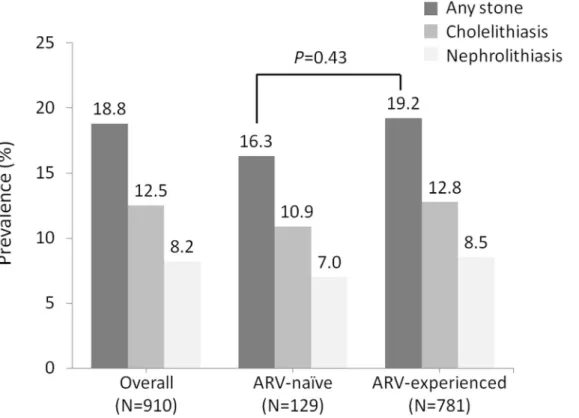
The overall prevalence of cholelithiasis and/or nephrolithiasis was 18.8% (171/910), which included 12.5% (114/910) for cholelithiasis and 8.2% (75/910) for nephrolithiasis. Only 19 patients (19/171, 11.1%) had subsequent complications (i.e. cholecystitis and hydronephrosis) and 16 patients received further interventions to relieve the symptoms. In antiretroviral-naïve and antiretroviral-experienced patients, the prevalence of cholelithiasis and/or nephrolithiasis Table 1. The demographics and clinical characteristics of 910 HIV-positive patients who had under-gone abdominal sonography.
Variable All patients (N = 910)
Demographics
Age, mean±SD, years 42.2±10.6
Male sex, n (%) 882 (96.9)
Body-mass index, mean±SD, kg/m2 22.9±3.5
Underlying diseases, n (%)
Hyperlipidemia 185 (20.3)
Chronic hepatitisa 115 (12.6)
Hypertension 99 (10.9)
Diabetes mellitus 56 (6.2)
Liver cirrhosis 26 (2.9)
Chronic kidney disease 20 (2.2)
HIV-related factors
Homosexual male, n (%) 711 (78.1)
Hepatitis B or C coinfection, n (%) 464 (51.0)
Duration of HIV infection, mean±SD, years 6.4±5.3
Duration of antiretroviral therapy, mean±SD, years 4.9±4.5
History of antiretroviral therapy, n (%)
Antiretroviral-experienced 781 (85.8)
Zidovudine 291 (32.0)
Abacavir 422 (46.4)
Tenofovir 442 (48.6)
Other NRTIsb 149 (16.4)
NNRTI 449 (49.3)
Unboosted atazanavir 313 (34.4)
Atazanavir/ritonavir 50 (5.5)
Lopinavir/ritonavir 186 (20.4)
Darunavir/ritonavir 29 (3.2)
Indinavir/ritonavir 38 (4.2)
Baseline laboratory investigationsc
Baseline PVL, median (range), log10copies/mL 5.08 (1.94–7.23)
Baseline CD4 count, median (range), cells/μL 151.0 (0–1265.0) Follow-up laboratory investigationsd
Follow-up PVL, median (range), log10copies/mL UD (UD-7.00)
Follow-up CD4 count, median (range), cells/μL 533.0 (1.0–2091.0)
Abbreviations:NNRTI, non-nucleoside transcriptase inhibitor; NRTI, nucleoside reverse-transcriptase inhibitor; PVL, plasma HIV RNA load; SD, standard deviation; UD, undetectable.
aChronic hepatitis was de
fined as persistent elevation in serum aminotransferases for 6 months or longer.
bOther NRTIs included stavudine, didanosine, and zalcitabine.
cBaseline laboratory investigations were the laboratory data obtained at the diagnosis of HIV.
dFollow-up laboratory investigations were the laboratory data obtained within 6 months before abdominal
sonography.
was 16.3% (21/129) and 19.2% (150/781), respectively (P= 0.43)(Fig 2). The prevalence of cholelithiasis and/or nephrolithiasis in patients with exposure to atazanavir or atazanavir/rito-navir, PIs other than atazaatazanavir/rito-navir, and nNRTIs was 22.0%, 20.8%, and 18.9%, respectively (all P>0.05 compared with antiretroviral-naïve patients). In multivariate analysis, the independent
factors associated with prevalent cholelithiasis were exposure to atazanavir/ritonavir for>2
years (adjusted OR [AOR], 4.70; 95% CI, 1.34–16.54), older age (AOR, per 1-year increase, 1.04; 95% CI, 1.01–1.06), duration of antiretroviral therapy (AOR, per 1-year increase, 0.91; 95% CI, 0.84–0.99), and elevated serum total bilirubin (AOR, per 1-mg/dL increase, 1.29; 95% CI, 1.05–1.57)(S1 Table). For nephrolithiasis, the associated factors were increasing age (AOR, per 1-year increase, 1.03; 95% CI, 1.00–1.06), decreased estimated GFR (AOR, per 1-ml/min/ 1.73m2decrease, 1.02; 95% CI, 1.01–1.03), and elevated serum total cholesterol (AOR, per 1-mg/dL increase, 1.01; 95% CI, 1.01–1.02)(S1 Table).
Analysis two: crude incidence and factors associated with incident
cholelithiasis and nephrolithiasis
A total of 680 antiretroviral-experienced patients who had undergone sonography before and after initiating antiretroviral therapy were included to estimate the crude incidences of choleli-thiasis and nephrolicholeli-thiasis. The total number of sonography performed among these patients was 1849, and the median interval of follow-up sonography was 332 days (IQR, 189–492 days). The indications of sonography were hepatitis B or C (346/680, 50.9%), fatty liver (240/680, 35.3%), or elevated aminotransferases (142/680, 20.9%). The demographics and clinical charac-teristics of patients with or without incident cholelithiasis and nephrolithiasis are shown in
Table 2. The cumulative crude incidence of developing cholelithiasis and/or nephrolithiasis Fig 2. The prevalence of cholelithiasis and/or nephrolithiasis in 910 HIV-positive patients who had undergone abdominal sonography. Abbreviation:ARV, antiretroviral.
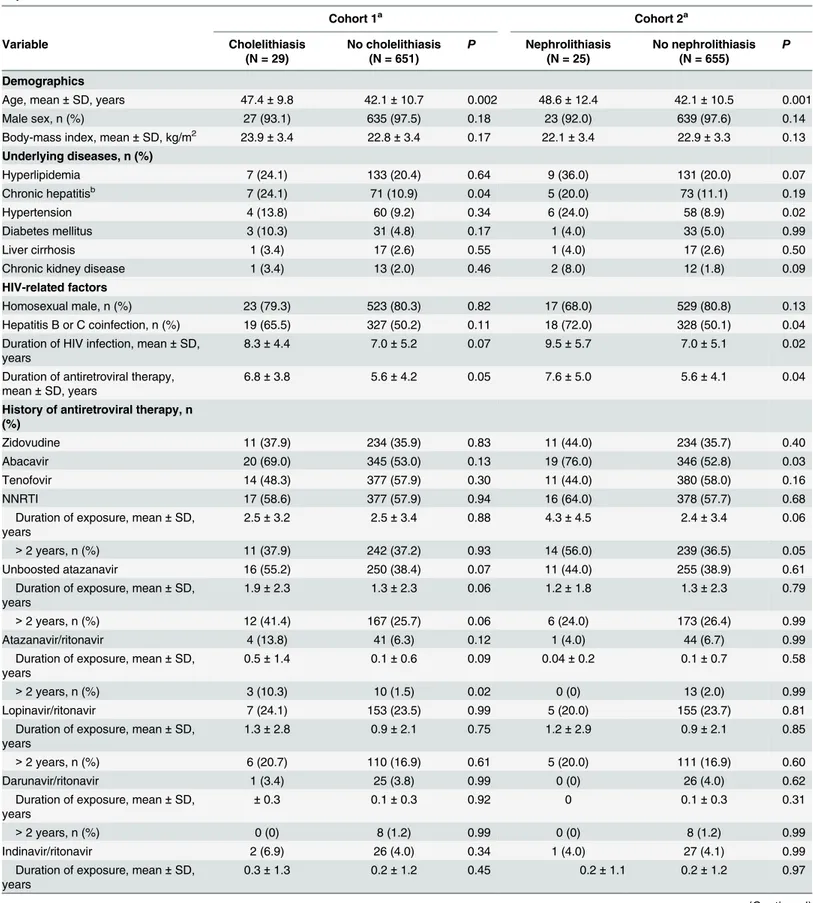
Table 2. The demographics and clinical characteristics of 680 antiretroviral-experienced patients with or without incident cholelithiasis and nephrolithiasis.
Cohort 1a Cohort 2a
Variable Cholelithiasis
(N = 29)
No cholelithiasis (N = 651)
P Nephrolithiasis (N = 25)
No nephrolithiasis (N = 655)
P
Demographics
Age, mean±SD, years 47.4±9.8 42.1±10.7 0.002 48.6±12.4 42.1±10.5 0.001
Male sex, n (%) 27 (93.1) 635 (97.5) 0.18 23 (92.0) 639 (97.6) 0.14
Body-mass index, mean±SD, kg/m2 23.9±3.4 22.8±3.4 0.17 22.1±3.4 22.9±3.3 0.13 Underlying diseases, n (%)
Hyperlipidemia 7 (24.1) 133 (20.4) 0.64 9 (36.0) 131 (20.0) 0.07
Chronic hepatitisb 7 (24.1) 71 (10.9) 0.04 5 (20.0) 73 (11.1) 0.19
Hypertension 4 (13.8) 60 (9.2) 0.34 6 (24.0) 58 (8.9) 0.02
Diabetes mellitus 3 (10.3) 31 (4.8) 0.17 1 (4.0) 33 (5.0) 0.99
Liver cirrhosis 1 (3.4) 17 (2.6) 0.55 1 (4.0) 17 (2.6) 0.50
Chronic kidney disease 1 (3.4) 13 (2.0) 0.46 2 (8.0) 12 (1.8) 0.09
HIV-related factors
Homosexual male, n (%) 23 (79.3) 523 (80.3) 0.82 17 (68.0) 529 (80.8) 0.13
Hepatitis B or C coinfection, n (%) 19 (65.5) 327 (50.2) 0.11 18 (72.0) 328 (50.1) 0.04
Duration of HIV infection, mean±SD, years
8.3±4.4 7.0±5.2 0.07 9.5±5.7 7.0±5.1 0.02
Duration of antiretroviral therapy, mean±SD, years
6.8±3.8 5.6±4.2 0.05 7.6±5.0 5.6±4.1 0.04
History of antiretroviral therapy, n (%)
Zidovudine 11 (37.9) 234 (35.9) 0.83 11 (44.0) 234 (35.7) 0.40
Abacavir 20 (69.0) 345 (53.0) 0.13 19 (76.0) 346 (52.8) 0.03
Tenofovir 14 (48.3) 377 (57.9) 0.30 11 (44.0) 380 (58.0) 0.16
NNRTI 17 (58.6) 377 (57.9) 0.94 16 (64.0) 378 (57.7) 0.68
Duration of exposure, mean±SD, years
2.5±3.2 2.5±3.4 0.88 4.3±4.5 2.4±3.4 0.06
>2 years, n (%) 11 (37.9) 242 (37.2) 0.93 14 (56.0) 239 (36.5) 0.05
Unboosted atazanavir 16 (55.2) 250 (38.4) 0.07 11 (44.0) 255 (38.9) 0.61
Duration of exposure, mean±SD, years
1.9±2.3 1.3±2.3 0.06 1.2±1.8 1.3±2.3 0.79
>2 years, n (%) 12 (41.4) 167 (25.7) 0.06 6 (24.0) 173 (26.4) 0.99
Atazanavir/ritonavir 4 (13.8) 41 (6.3) 0.12 1 (4.0) 44 (6.7) 0.99
Duration of exposure, mean±SD, years
0.5±1.4 0.1±0.6 0.09 0.04±0.2 0.1±0.7 0.58
>2 years, n (%) 3 (10.3) 10 (1.5) 0.02 0 (0) 13 (2.0) 0.99
Lopinavir/ritonavir 7 (24.1) 153 (23.5) 0.99 5 (20.0) 155 (23.7) 0.81
Duration of exposure, mean±SD, years
1.3±2.8 0.9±2.1 0.75 1.2±2.9 0.9±2.1 0.85
>2 years, n (%) 6 (20.7) 110 (16.9) 0.61 5 (20.0) 111 (16.9) 0.60
Darunavir/ritonavir 1 (3.4) 25 (3.8) 0.99 0 (0) 26 (4.0) 0.62
Duration of exposure, mean±SD, years
±0.3 0.1±0.3 0.92 0 0.1±0.3 0.31
>2 years, n (%) 0 (0) 8 (1.2) 0.99 0 (0) 8 (1.2) 0.99
Indinavir/ritonavir 2 (6.9) 26 (4.0) 0.34 1 (4.0) 27 (4.1) 0.99
Duration of exposure, mean±SD, years
0.3±1.3 0.2±1.2 0.45 0.2±1.1 0.2±1.2 0.97
was 7.2% (4 9/680), which included 4.3% (29/680) for cholelithiasis and 3.7% (25/680) for nephrolithiasis after initiating antiretroviral therapy. The crude incidence in patients receiving regimens containing nNRTI, unboosted/boosted atazanavir, and PIs other than atazanavir was 7.6%, 8.8%, and 6.8%, respectively. The crude incidences were not statistically different among the patients receiving different antiretroviral regimens (P>0.05).
In univariate analysis, the factors associated with incident cholelithiasis were advanced age, chronic hepatitis, exposure to atazanavir/ritonavir for>2 years, higher baseline or follow-up
PVL, and elevated serum total bilirubin(S2 Table). For incident nephrolithiasis, the associated factors were advanced age, hypertension, hepatitis B or C coinfection, longer duration of HIV infection or antiretroviral therapy, exposure to abacavir, and elevated serum total cholesterol (allP<0.05)(S2 Table). In multivariate analysis, the independent factors associated with
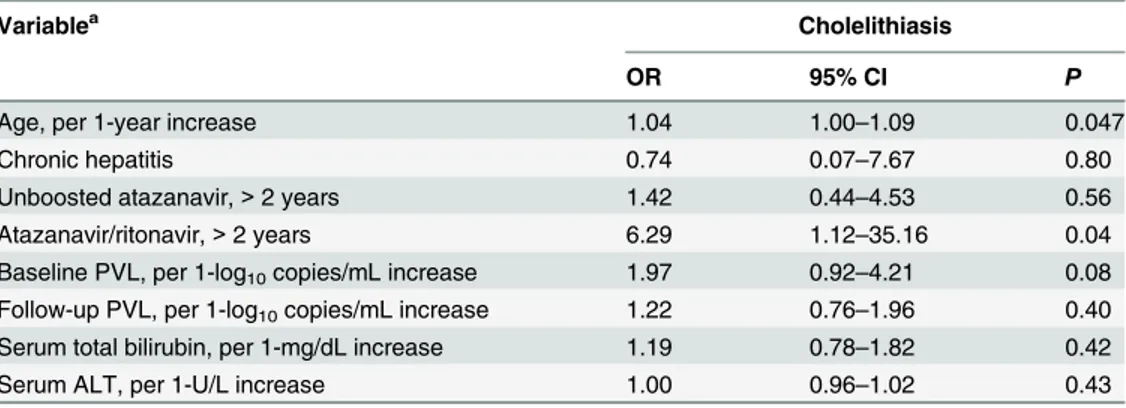
inci-dent cholelithiasis included exposure to atazanavir/ritonavir for>2 years (AOR, 6.29; 95% CI,
1.12–35.16;P= 0.04) and advanced age (AOR, per 1-year increase, 1.04; 95% CI, 1.00–1.09; P= 0.047)(Table 3). If we considered atazanavir/ritonavir exposure as a continuous variable, a Table 2. (Continued)
Cohort 1a Cohort 2a
Variable Cholelithiasis
(N = 29)
No cholelithiasis (N = 651)
P Nephrolithiasis (N = 25)
No nephrolithiasis (N = 655)
P
>2 years, n (%) 1 (3.4) 22 (3.4) 0.99 1 (4.0) 22 (3.4) 0.58
Baseline laboratory investigationsc Baseline PVL, median (range), log10
copies/mL
5.42 (4.14–7.00) 5.05 (1.94–7.00) 0.05 5.35 (3.91–5.96) 5.08 (1.94–7.00) 0.21
Baseline CD4 count, median (range), cells/μL
67.0 (1–591.0) 157.0 (0–1265.0) 0.22 84.0 (0–448.0) 155.0 (0–1265.0) 0.10
Follow-up laboratory investigationsd
Follow-up PVL, median (range), log10
copies/mL
UD (UD-4.91) UD (UD-5.27) 0.07 UD (UD-2.96) UD (UD-5.27) 0.41
Follow-up CD4 count, median (range), cells/μL
502.0 (4.0–1316.0) 565.0 (8.0–1965.0) 0.32 458.5 (76.0–1012.0) 565.0 (4.0–1965.0) 0.27
Estimated GFR, mean±SD, mL/min/ 1.73m2
92.5±19.5 99.1±21.6 0.12 93.0±32.5 99.1±21.0 0.33
Serum total bilirubin, mean±SD, mg/ dL
2.2±3.9 1.2±1.0 0.25 1.4±1.7 1.2±1.2 0.57
Serum ALT, mean±SD, U/L 49.1±86.3 34.5±37.9 0.25 31.3±24.7 35.3±41.6 0.93
Serum total cholesterol, mean±SD, mg/dL
173.7±35.4 171.6±35.1 0.72 189.3±40.5 171.1±34.7 0.02
Serum triglyceride, mean±SD, mg/ dL
163.0±104.6 155.5±129.6 0.37 170.0±82.8 155.3±130.0 0.10
Serum uric acid, mean±SD, mg/dL NA NA NA 4.9±0.0 6.2±2.0 0.39
Urine pH, mean±SD, unit NA NA NA 6.2±0.6 6.0±0.6 0.10
Urinary crystal, n (%) NA NA NA 0 (0) 15 (2.3) 0.99
Abbreviations:ALT, alanine aminotransferase; GFR, glomerularfiltration rate; NNRTI, non-nucleoside reverse-transcriptase inhibitor; NRTI, nucleoside reverse-transcriptase inhibitor; PVL, plasma HIV RNA load; SD, standard deviation; UD, undetectable.
a
Cohort 1 was the cohort for the comparison between patients with and those without incident cholelithiasis, and cohort 2 was the cohort for the comparison between patients with and those without incident nephrolithiasis.
b
Chronic hepatitis was defined as persistent elevation in serum aminotransferases for 6 months or longer.
c
Baseline laboratory investigations were the laboratory data obtained at the diagnosis of HIV.
d
Follow-up laboratory investigations were the laboratory data obtained within 6 months before abdominal sonography.
positive association between the cumulative exposure and incident cholelithiasis was also found (AOR, per 1-year exposure, 1.49; 95% CI, 1.05–2.10;P= 0.02). For nephrolithiasis, the associated factors were hyperlipidemia (AOR, 3.97; 95% CI, 1.32–11.93;P= 0.01), hepatitis B or C coinfection (AOR, 3.41; 95% CI, 1.09–10.62;P= 0.04), and exposure to abacavir (AOR, 12.01; 95% CI, 1.54–93.54;P= 0.02)(Table 4). There were no cases of nephrolithiasis among those exposed to atazanavir/ritonavir for>2 years or those exposed to darunavir/ritonavir.
The cumulative exposure of atazanavir/ritonavir was also not statistically significantly corre-lated with incident nephrolithiasis.
Table 3. Multivariate logistic analysis to identify the factors associated with incident cholelithiasis in 680 antiretroviral-experienced patients.
Variablea Cholelithiasis
OR 95% CI P
Age, per 1-year increase 1.04 1.00–1.09 0.047
Chronic hepatitis 0.74 0.07–7.67 0.80
Unboosted atazanavir,>2 years 1.42 0.44–4.53 0.56
Atazanavir/ritonavir,>2 years 6.29 1.12–35.16 0.04
Baseline PVL, per 1-log10copies/mL increase 1.97 0.92–4.21 0.08
Follow-up PVL, per 1-log10copies/mL increase 1.22 0.76–1.96 0.40
Serum total bilirubin, per 1-mg/dL increase 1.19 0.78–1.82 0.42
Serum ALT, per 1-U/L increase 1.00 0.96–1.02 0.43
Abbreviations:ALT, alanine aminotransferase; CI, confidence interval; OR, odds ratio; PVL, plasma HIV RNA load.
a
Variables considered for entry into multivariate logistic regression model included variables withPvalues
<0.10 in univariate analysis.
doi:10.1371/journal.pone.0137660.t003
Table 4. Multivariate logistic analysis to identify the factors associated with incident nephrolithiasis in 680 antiretroviral-experienced patients.
Variablea Nephrolithiasis
OR 95% CI P
Age, per 1-year increase 1.03 0.98–1.08 0.21
Hyperlipidemia 3.97 1.32–11.93 0.01
Hypertension 0.48 0.07–3.43 0.47
Chronic kidney disease 2.99 0.28–32.25 0.37
Hepatitis B or C coinfection 3.41 1.09–10.62 0.04
Duration of HIV infection, per 1-year increase 1.08 0.96–1.23 0.21
Duration of antiretroviral therapy, per 1-year increase 0.91 0.78–1.07 0.25
Use of abacavir 12.01 1.54–93.54 0.02
NNRTI exposure>2 years 1.14 0.34–3.78 0.83
Serum total cholesterol, per 1-mg/dL increase 1.00 0.99–1.02 0.62
Urine pH, per 1-unit increase 2.31 0.98–5.45 0.06
Abbreviations:CI, confidence interval; NNRTI, non-nucleoside reverse-transcriptase inhibitor; OR, odds ratio.
aVariables considered for entry into multivariate logistic regression model included variables withPvalues
<0.10 in univariate analysis.
Analysis three: effects of plasma atazanavir concentrations and genetic
polymorphisms on incident cholelithiasis and nephrolithiasis
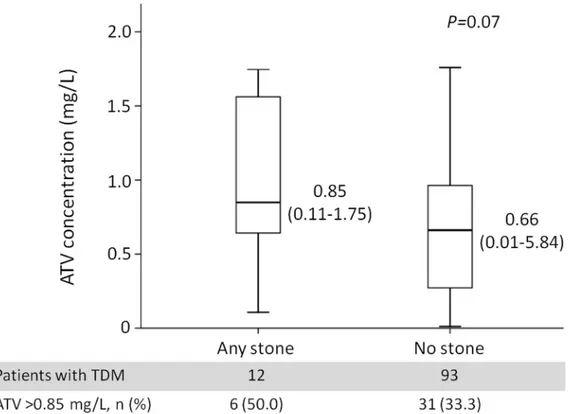
A total of 180 patients underwent TDM of plasma atazanavir concentrations, including 16 patients who developed cholelithiasis and/or nephrolithiasis and 164 patients who did not. The total number of sonography performed among these patients was 390, and the median interval of follow-up sonography was 375 days (IQR, 189–734 days). The indications of sonography were hepatitis B or C (65/180, 36.1%), fatty liver (81/180, 45.0%), or elevated aminotransferases (36/180, 20.0%). The atazanavir C12and C24were compared separately.Fig 3shows the
com-parison of atazanavir C12between 12 patients with and 93 patients without incident
cholelithi-asis and/or nephrolithicholelithi-asis. The atazanavir C12was higher (median, 0.85 mg/L; range, 0.11–
1.75) in patients with incident stones compared with patients without stones (median, 0.66 mg/L; range, 0.01–5.84), but the difference was of borderline significance (P= 0.07). The per-centage of patients with atazanavir C12above 0.85 mg/L, the upper limit of the therapeutic
win-dow, was 50.0% (6/12) and 33.3% (31/93) in patients with and without incident stones, respectively (P= 0.34). Only 4 patients with incident stones had atazanavir C
24levels, which
were lower than that in patients without stones, but the difference was not statistically signifi-cant (P= 0.25).
The genotyping results of UGT1A128 and MDR1 2677, which may affect atazanavir metabolism and lead to hyperbilirubinemia, are shown inTable 5. The frequency of the UGT1A128 allele in 16 patients with and 161 patients without incident stones was 12.5% and 19.9%, respectively (P= 0.74) and that of the MDR1 G2677T/A in 7 patients with and 86 patients without incident stones was 71.4% and 70.9%, respectively (P= 0.99).
Fig 3. Plasma atazanavir concentrations (C12) of patients with (N = 12) and without (N = 93) incident cholelithiasis and/or nephrolithiasis.
Abbreviations:ATV, atazanavir; TDM, therapeutic drug monitoring.
Discussion
This study demonstrates a high prevalence of cholelithiasis and nephrolithiasis in the HIV-pos-itive Taiwanese population receiving routine abdominal sonography for chronic viral hepatitis and other indications. Exposure to atazanavir/ritonavir for over 2 years is associated with a 6.29-fold increase in the risk for incident cholelithiasis. However, plasma atazanavir concentra-tions and genetic polymorphisms related to metabolism of atazanavir are not identified as asso-ciated factors, perhaps due to insufficient sample size. To the best of our knowledge, this study is the first analysis that attempts to elucidate the correlation between plasma atazanavir con-centrations and stone formation using routine follow-up sonography.
The prevalence and incidence of cholelithiasis and nephrolithiasis are enormously affected by geography and ethnicity, and are relatively lower in Asian countries compared with Western countries [2,3]. The prevalence and incidence of gallstones have been reported to be 4.6–10.7% and 6.32 per 1000 person-years, respectively, in the general Asian population [21,22], with the prevalence and incidence of renal stones being 7.4% in the Taiwanese population, and 1.14 per 1000 person-years in the Japanese population [23,24]. In the HIV-positive population, recent studies conducted in Japan reported higher rates of cholelithiasis (9.8%) and nephrolithiasis (7.1%) by means of clinical diagnosis and imaging performed for various indications [4,7]. To avoid overestimation, we enrolled patients who underwent routine abdominal sonography since sonography has been accepted as the initial imaging modality of choice for the detection of gallstones and renal stones [2,25]. Our findings, similar to those previously reported by Japa-nese investigators [4,7], also showed a high prevalence of cholelithiasis (12.5%) and nephro-lithiasis (8.2%), which was previously attributed to antiretrovirals, especially exposure to PIs [4,6,7,8]. In our study, the high rates of cholelithiasis and nephrolithiasis were found both in antiretroviral-naïve and antiretroviral-experienced patients without statistically significant dif-ference, suggesting that there may be other contributing factors in addition to antiretrovirals in the HIV-positive population. Because the majority of our patients had chronic hepatitis B or C infection (51.0%), the high rates in antiretroviral-naïve patients may result from the impact of hepatitis C coinfection, which has been recognized as a risk factor for cholelithiasis [26]. Table 5. Comparisons of genotype frequencies for UGT1A1 and MDR1 2677 between patients with and without incident cholelithiasis and/or nephrolithiasis.
Genotype Any stonen/N (%)a No stone n/N (%)a P
UGT1A1*28
TA6/TA6 14/16 (87.5) 129/161 (80.1) 0.74
TA6/TA7 2/16 (12.5) 32/161 (19.9)
MDR1 2677
G/G 2/7 (28.6) 25/86 (29.1) 0.99
G/T 2/7 (28.6) 29/86 (33.7)
T/T 1/7 (14.3) 12/86 (14.0)
T/A 1/7 (14.3) 6/86 (7.0)
G/A 1/7 (14.3) 13/86 (15.1)
A/A 0/7 (0) 1/86 (1.2)
MDR1 2677 (T or A) 5/7 (71.4) 61/86 (70.9) 0.99
Abbreviations:MDR1, multidrug resistance gene 1; UGT, UDP-glucuronosyltransferase.
aN was the total number of patients with determinations of UGT1A1
*28 or MDR1 2677 polymorphisms, and n was the number of patients with specific genotypes.
Whether HIV infection itself may contribute to cholelithiasis and nephrolithiasis warrants fur-ther investigations.
Some important risk factors for cholelithiasis and nephrolithiasis have been identified previ-ously [2,27], such as older age, female sex, metabolic syndrome, liver diseases, specific diet and drugs for cholelithiasis and male sex, metabolic syndrome, reduced urinary volume and urine pH, hyperuricosuria, and specific diet and drugs for nephrolithiasis. Among the HIV-infected patients, previously identified risk factors were hepatitis B or C coinfection and exposure to PIs, including indinavir and atazanavir [6,28,29]. Atazanavir-induced cholelithiasis and nephrolithiasis were observed in patients with cumulative exposure to atazanavir/ritonavir for
>2 years [4,30–32]. These findings were based on the clinical practice that most patients
received atazanavir/ritonavir as their PI-based regimens. In our study, a substantial proportion of the patients received unboosted atazanavir (34.4%) instead of atazanavir/ritonavir (5.5%). The independent factors associated with incident cholelithiasis were exposure to atazanavir/ ritonavir for>2 years and older age. Our findings indicate that patients with cumulative
expo-sure to atazanavir/ritonavir, rather than unboosted atazanavir, had a 6.29-fold increase in the risk for incident cholelithiasis. In contrast, our study failed to correlate nephrolithiasis with cumulative exposure to atazanavir/ritonavir. A recent retrospective study using insurance data-bases also showed no evidence of an increased risk of nephrolithiasis among patients on ataza-navir compared with other PIs, but a positive association was observed when atazaataza-navir was compared with PI-free regimens [33]. While no previous studies have ever identified an associ-ation between exposure to abacavir and incident nephrolithiasis, the positive associassoci-ation found in our study suggests the direct effect of abacavir or the fact that patients with decreased esti-mated GFR were more likely to receive abacavir. More studies are needed to confirm our findings.
Two mechanisms are hypothesized for atazanavir-induced cholelithiasis and nephrolithia-sis, including precipitation of atazanavir in the less acidic bile and urine and atazanavir-related hyperbilirubinemia facilitating the formation of gallstones [29,34]. To elucidate the effect of atazanavir exposure, plasma atazanavir concentrations and genetic polymorphisms altering the metabolism and transportation of atazanavir need to be examined. To date, only one recent study addressed the relationship between genetic polymorphisms of UGT1A-3’-UTR and ata-zanavir-induced nephrolithiasis [13]. We examined two well-known genetic polymorphisms of UGT1A128 and MDR1 2677 related to atazanavir-induced hyperbilirubinemia [14], but failed to demonstrate statistically significant correlation between the genetic polymorphisms and incident cholelithiasis and nephrolithiasis. In terms of the plasma atazanavir concentrations, atazanavir C12was numerically higher in patients with incident cholelithiasis and
nephrolithia-sis without reaching statistical significance, which is likely caused by the small sample size in our study. The minimum sample size in each group to detect a difference in atazanavir levels with a power of 80% at 95% confidence level estimated by STPLAN 4.5 would be 100. While our results should be interpreted with caution, our findings suggest that cumulative atazanavir exposure has more impact than plasma drug levels on stone formation.
treatment-experienced patients. In this study, we used crude incidence instead and excluded patients without baseline sonography from the analysis for identifying associated factors. Third, 180 patients with atazanavir exposure had determinations of plasma atazanavir concentrations and genetic polymorphisms and only 16 patients had cholelithiasis and/or nephrolithiasis. The small sample size may preclude us from identifying correlations between plasma atazanavir concentrations, genetic polymorphisms, and cholelithiasis and nephrolithiasis. Fourth, the information on the previous history of cholelithiasis and nephrolithiasis, diet and other medi-cations except antiretroviral therapy that could contribute to cholelithiasis and nephrolithiasis may not have been recorded in the medical records, and the stone composition was not known. Therefore, we were not able to rule out other contributing factors. Lastly, our study included only Taiwanese and the results may not be generalizable to HIV-positive patients of other ethnicities in other geographic locations.
In conclusion, in HIV-positive Taiwanese patients who had undergone routine abdominal sonography for chronic viral hepatitis and other indications, a high prevalence of cholelithiasis and nephrolithiasis was observed. The cumulative exposure to atazanavir/ritonavir for>2
years was associated with incident cholelithiasis. With the limitation of insufficient sample size, we failed to demonstrate statistically significant associations between plasma atazanavir con-centrations, genetic polymorphisms altering atazanavir metabolism and incident cholelithiasis and nephrolithiasis.
Supporting Information
S1 Table. Logistic analysis to estimate the factors associated with prevalent cholelithiasis and nephrolithiasis in 910 HIV-positive patients who had undergone abdominal sonogra-phy.
(DOCX)
S2 Table. Univariate logistic analysis to estimate the factors associated with incident chole-lithiasis and nephrochole-lithiasis in 680 antiretroviral-experienced patients.
(DOCX)
S1 Text. The detailed methods for determination of plasma atazanavir concentrations and genetic polymorphisms.
(DOCX)
Acknowledgments
We would like to thank Taiwan Centers for Disease Control and National Taiwan University Hospital for research grant support.
Author Contributions
Conceived and designed the experiments: KYL SHL HPW CCH. Performed the experiments: KYL SHL WCL SWL SYC MRW HPW CCH. Analyzed the data: KYL SHL WCL SWL SYC MRW HPW CCH AC. Contributed reagents/materials/analysis tools: KYL SHL WCL SWL SYC MST CHK MRW HPW CCH SCC. Wrote the paper: KYL SWL SYC CCH AC.
References
2. Stinton LM, Shaffer EA. Epidemiology of gallbladder disease: cholelithiasis and cancer. Gut Liver. 2012; 6: 172–187. doi:10.5009/gnl.2012.6.2.172PMID:22570746
3. Romero V, Akpinar H, Assimos DG. Kidney stones: a global picture of prevalence, incidence, and asso-ciated risk factors. Rev Urol. 2010; 12: e86–96. PMID:20811557
4. Nishijima T, Shimbo T, Komatsu H, Hamada Y, Gatanaga H, Kikuchi Y, et al. Cumulative exposure to ritonavir-boosted atazanavir is associated with cholelithiasis in patients with HIV-1 infection. J Antimi-crob Chemother. 2014; 69: 1385–1389. doi:10.1093/jac/dkt514PMID:24379301
5. Raheem OA, Mirheydar HS, Palazzi K, Chenoweth M, Lakin C, Sur RL, et al. Prevalence of nephro-lithiasis in human immunodeficiency virus infected patients on the highly active antiretroviral therapy. J Endourol. 2012; 26: 1095–1098. doi:10.1089/end.2011.0639PMID:22429050
6. Crixivan (Indinavir Sulfate): Full Prescription Information (Package Insert). Whitehouse station: Merck & Co., 2013.
7. Nishijima T, Hamada Y, Watanabe K, Komatsu H, Kinai E, Tsukada K, et al. Ritonavir-boosted daruna-vir is rarely associated with nephrolithiasis compared with ritonadaruna-vir-boosted atazanadaruna-vir in HIV-infected patients. PLoS One. 2013; 8: e77268. doi:10.1371/journal.pone.0077268PMID:24130871
8. Hamada Y, Nishijima T, Watanabe K, Komatsu H, Tsukada K, Teruya K, et al. High incidence of renal stones among HIV-infected patients on ritonavir-boosted atazanavir than in those receiving other prote-ase inhibitor-containing antiretroviral therapy. Clin Infect Dis. 2012; 55: 1262–1269. doi:10.1093/cid/
cis621PMID:22820542
9. Hamada Y, Nishijima T, Komatsu H, Teruya K, Gatanaga H, Kikuchi Y, et al. Is ritonavir-boosted ataza-navir a risk for cholelithiasis compared to other protease inhibitors? PLoS One. 2013; 8: e69845. doi: 10.1371/journal.pone.0069845PMID:23875004
10. Boyd MA, Siangphoe U, Ruxrungtham K, Reiss P, Mahanontharit A, Lange JM, et al. The use of phar-macokinetically guided indinavir dose reductions in the management of indinavir-associated renal toxic-ity. J Antimicrob Chemother. 2006; 57: 1161–1167. PMID:16595641
11. Collin F, Chene G, Retout S, Peytavin G, Salmon D, Bouvet E, et al. Indinavir trough concentration as a determinant of early nephrolithiasis in HIV-1-infected adults. Ther Drug Monit. 2007; 29: 164–170.
PMID:17417069
12. Foca E, Ripamonti D, Motta D, Torti C. Unboosted atazanavir for treatment of HIV infection: rationale and recommendations for use. Drugs. 2012; 72: 1161–1173. doi:
10.2165/11631070-000000000-00000PMID:22646049
13. Nishijima T, Tsuchiya K, Tanaka N, Joya A, Hamada Y, Mizushima D, et al. Single-nucleotide polymor-phisms in the UDP-glucuronosyltransferase 1A-3' untranslated region are associated with atazanavir-induced nephrolithiasis in patients with HIV-1 infection: a pharmacogenetic study. J Antimicrob Che-mother. 2014; 69: 3320–3328. doi:10.1093/jac/dku304PMID:25151207
14. Park WB, Choe PG, Song KH, Jeon JH, Park SW, Kim HB, et al. Genetic factors influencing severe ata-zanavir-associated hyperbilirubinemia in a population with low UDP-glucuronosyltransferase 1A1*28 allele frequency. Clin Infect Dis. 2010; 51: 101–106. doi:10.1086/653427PMID:20504240
15. Centers for Disease Control, R.O.C. (Taiwan). Guidelines for diagnosis and treatment of HIV/AIDS. 2013. Available:
http://www.cdc.gov.tw/uploads/files/201310/1e64c227-32fc-49ab-8bfc-9484ec50c4f3.pdf. Accessed 9 March 2015.
16. Lee KY, Lin SW, Sun HY, Kuo CH, Tsai MS, Wu BR, et al. Therapeutic drug monitoring and pharmaco-genetic study of HIV-infected ethnic Chinese receiving efavirenz-containing antiretroviral therapy with or without rifampicin-based anti-tuberculous therapy. PLoS One. 2014; 9: e88497. doi:10.1371/ journal.pone.0088497PMID:24551111
17. Colombo S, Buclin T, Cavassini M, Decosterd LA, Telenti A, Biollaz J, et al. Population pharmacokinet-ics of atazanavir in patients with human immunodeficiency virus infection. Antimicrob Agents Che-mother. 2006; 50: 3801–3808. PMID:16940065
18. Ramachandran G, Kumar AK, Swaminathan S, Venkatesan P, Kumaraswami V, Greenblatt DJ, et al. Simple and rapid liquid chromatography method for determination of efavirenz in plasma. J Chromatogr B. 2006; 835: 131–135.
19. Cascorbi I, Gerloff T, Johne A, Meisel C, Hoffmeyer S, Schwab M, et al. Frequency of single nucleotide polymorphisms in the P-glycoprotein drug transporter MDR1 gene in white subjects. Clin Pharmacol Ther. 2001; 69: 169–174. PMID:11240981
20. Aono S, Adachi Y, Uyama E, Yamada Y, Keino H, Nanno T, et al. Analysis of genes for bilirubin UDP-glucuronosyltransferase in Gilbert's syndrome. Lancet. 1995; 345: 958–959. PMID:7715297
22. Chen JY, Hsu CT, Liu JH, Tung TH. Clinical predictors of incident gallstone disease in a Chinese popu-lation in Taipei, Taiwan. BMC Gastroenterol. 2014; 14: 83. doi:10.1186/1471-230X-14-83PMID: 24775330
23. Huang WY, Chen YF, Carter S, Chang HC, Lan CF, Huang KH, et al. Epidemiology of upper urinary tract stone disease in a Taiwanese population: a nationwide, population based study. J Urol. 2013; 189: 2158–2163. doi:10.1016/j.juro.2012.12.105PMID:23313204
24. Yasui T, Iguchi M, Suzuki S, Kohri K. Prevalence and epidemiological characteristics of urolithiasis in Japan: national trends between 1965 and 2005. Urology. 2008; 71: 209–213. doi:10.1016/j.urology.
2007.09.034PMID:18308085
25. Smith-Bindman R, Aubin C, Bailitz J, Bengiamin RN, Camargo CA Jr., Corbo J, et al. Ultrasonography versus computed tomography for suspected nephrolithiasis. N Engl J Med. 2014; 371: 1100–1110.
doi:10.1056/NEJMoa1404446PMID:25229916
26. Acalovschi M, Buzas C, Radu C, Grigorescu M. Hepatitis C virus infection is a risk factor for gallstone disease: a prospective hospital-based study of patients with chronic viral C hepatitis. J Viral Hepat. 2009; 16: 860–866. doi:10.1111/j.1365-2893.2009.01141.xPMID:19486279
27. Moe OW. Kidney stones: pathophysiology and medical management. Lancet. 2006; 367: 333–344.
PMID:16443041
28. Malavaud B, Dinh B, Bonnet E, Izopet J, Payen JL, Marchou B. Increased incidence of indinavir nephrolithiasis in patients with hepatitis B or C virus infection. Antivir Ther. 2000; 5: 3–5. PMID:
10846585
29. Reyataz (Atazanavir Sulfate): Full Prescription Information (Package Insert). Princeton: Bristol-Myers Squibb, 2012.
30. Chan-Tack KM, Truffa MM, Struble KA, Birnkrant DB. Atazanavir-associated nephrolithiasis: cases from the US Food and Drug Administration's Adverse Event Reporting System. AIDS. 2007; 21: 1215–
1218. PMID:17502736
31. Rakotondravelo S, Poinsignon Y, Borsa-Lebas F, de la Blanchardiere A, Michau C, Jantzem H, et al. Complicated atazanavir-associated cholelithiasis: a report of 14 cases. Clin Infect Dis. 2012; 55: 1270–1272. doi:10.1093/cid/cis620PMID:22820540
32. Lafaurie M, De Sousa B, Ponscarme D, Lapidus N, Daudon M, Weiss L, et al. Clinical features and risk factors for atazanavir (ATV)-associated urolithiasis: a case-control study. PLoS One. 2014; 9: e112836. doi:10.1371/journal.pone.0112836PMID:25409506
33. Nkhoma E, Kumar M, Hines P, Moorthy V, Klauck I, Keever AV, et al. Nephrolithiasis and renal failure among patients exposed to atazanavir, other PIs and PI-free regimens. Journal of the International AIDS Society. 2014; 17:19560. doi:10.7448/IAS.17.4.19560PMID:25394067
34. Zhang D, Chando TJ, Everett DW, Patten CJ, Dehal SS, Humphreys WG, et al. In vitro inhibition of UDP glucuronosyltransferases by atazanavir and other HIV protease inhibitors and the relationship of this property to in vivo bilirubin glucuronidation. Drug Metab Dispos. 2005; 33: 1729–1739. PMID:
16118329