GLÁUCIA SOARES TOLENTINO
GRUPOS
FUNCIONAIS,
USO
DOS
RECURSOS
E
DIVERSIDADE
FUNCIONAL
DE
PLANTAS
LENHOSAS
NO
CERRADO
Tese apresentada à Universidade Federal de Viçosa, como parte das exigências do Programa de Pós-Graduação em Botânica, para obtenção do título de Doctor Scientiae.
VIÇOSA
B
IOGRAFIA
Gláucia Soares Tolentino nasceu em 22 de junho de 1987. Cresceu a infância nos limites entre a Bahia e Minas Gerais. Aprendeu sobre xadrez, desenho e poesia e arriscou encontrar conhecimento nas ciências da natureza.
Í
NDICE
Resumo... vi
Abstract ... viii
Introdução Geral... 1
Referências bibliográficas ... 3
Functional traits and the role of soil attributes in niche overlap among plant functional groups in the Cerrado ... 6
1. Introduction ... 6
2. Material and methods ... 8
2.1. Study area ... 8
2.2. Vegetation and environmental characterization ... 9
2.3. Functional traits ... 10
2.4. Data analysis ... 11
3. Results ... 12
4. Discussion ... 17
5. References ... 18
6. Supporting information ... 22
Composição isotópica e uso de recursos por grupos funcionais de plantas no Cerrado ... 27
1. Introdução ... 27
2. Material e métodos ... 28
2.1. Área de estudo ... 28
2.2. Amostragem de material vegetal e traços funcionais ... 30
2.3. Análise elementar e isotópica das plantas ... 31
2.4. Caracterização ambiental ... 31
2.5. Análise dos dados ... 32
3. Resultados ... 33
5. Referências bibliográficas ... 40
6. Material suplementar ... 45
Como os gradientes ambientais influenciam a diversidade funcional de árvores no Cerrado? ... 48
1. Introdução ... 48
2. Material e métodos ... 50
2.1. Área de estudo ... 50
2.2. Estrutura da vegetação e caracterização ambiental ... 51
2.3. Matriz de traços funcionais ... 52
2.4. Análise dos dados ... 54
3. Resultados ... 54
3.1. Características ambientais e estruturais ... 54
3.2. Diversidade e traços funcionais ... 55
4. Discussão ... 60
5. Referências bibliográficas ... 63
6. Material suplementar ... 68
R
ESUMO
TOLENTINO, Gláucia Soares, D.Sc., Universidade Federal de Viçosa, setembro de 2015. Grupos funcionais, uso dos recursos e diversidade funcional de plantas lenhosas no Cerrado. Orientador: João Augusto Alves Meira-Neto.
A variação fisionômica e na composição de espécies em comunidades de plantas do Cerrado é comumente atribuída às propriedades do solo. Contudo, a influência do solo na seleção de traços funcionais e estratégias ecológicas e seu papel na determinação da diversidade funcional da comunidade são pouco conhecidos. O objetivo deste trabalho é avaliar a influência dos gradientes ambientais na distinção de grupos funcionais, na seleção de estratégias ecológicas e na diversidade funcional de plantas do Cerrado. O trabalho foi desenvolvido em um fragmento de Cerrado com ampla variação de solos, o que o torna um sistema adequado para o estudo de diferentes adaptações no uso dos recursos e na tolerância ao estresse. Foram inventariados 3 ha de vegetação arbustivo-arbórea, a partir dos quais foram selecionadas as espécies mais representativas para (i) mensuração de características funcionais, (ii) definição de grupos funcionais, (iii) avaliação de estratégias de uso dos recursos através da aplicação de isótopos estáveis (ẟ13C e ẟ15N) e (iv) análises da diversidade funcional ao longo dos gradientes de solo e abertura do dossel. Nossos resultados indicam a definição de três grupos funcionais distintos: espécies resistentes ao alumínio, geralmente associadas a solos pobres e ácidos; espécies de cerradão ou floresta seca, que têm abundância expressiva nas manchas de solo de maior fertilidade; e espécies leguminosas fixadoras de N2, comuns ao longo de todo o gradiente de solos. Os traços
A
BSTRACT
TOLENTINO, Gláucia Soares, D.Sc., Universidade Federal de Viçosa, September, 2015. Functional groups, resource use and functional diversity of woody plants in the Cerrado. Advisor: João Augusto Alves Meira-Neto.
The variation in physiognomy and species composition in plant communities of the Cerrado is commonly attributed to soil properties. However, the influence of soil in the selection of functional traits and ecological strategies and their role in determining the functional diversity of the community are not well known. This study aimed to evaluate the influence of environmental gradients on distinction of plant functional groups, on the strategies of resource use and on functional diversity of woody plants in the Cerrado. Sampling was carried out in a Cerrado fragment with wide range of soils, making it a suitable system for the study of different adaptations in the use of resources and stress tolerance by plants. It was surveyed 3 ha of tree-shrub vegetation, from which the most representative species were selected for (i) measurement of functional traits, (ii) definition of functional groups, (iii) evaluation of strategies of resource use with the application of stable isotopes (ẟ13C and
ẟ15
N) and (iv) analyzes of functional diversity over the gradients of soil and canopy openness. Our results indicated the definition of three distinct functional groups: aluminium-resistant species, generally associated with poor and acid soils; species of cerrado woodlands or dry forest, which have significant abundance in the most fertile soil stands; and N2-fixing leguminous species, commonly found throughout the soil gradient. The
functional traits and values of ẟ13C and ẟ15N were congruent to demonstrate the contrast between the aluminum-resistants plants and species from dry forests. Poor and stressful soils represent an ecosystem with low N loss rates, where plants have small size, low specific leaf area, high C/N ratio and low wood density, with ẟ15N impoverished values. Species from cerrado woodlands and dry forests, instead, have characteristics that indicate a capacity of rapid growth in a nutritionally more favorable soil, where N loss rates are high and plants are
15
I
NTRODUÇÃO
G
ERAL
Entre os ambientes tropicais com maior riqueza taxonômica está o Cerrado, bioma brasileiro que ocupa aproximadamente dois milhões de quilômetros quadrados, cobrindo originalmente cerca de 22% do território (Oliveira-Filho e Ratter 2002). Sua biodiversidade abrange um total estimado de 7.000 espécies de plantas vasculares e alta taxa de endemismo (Mittermeier et al 2005, Ribeiro e Walter 2008). Apesar de sua importância para a conservação da biodiversidade, o Cerrado sofre constante perda de área pela expansão da agricultura e da pecuária (Klink e Machado 2005). O avanço do desmatamento e as mudanças no uso da terra tornam o Cerrado um dos biomas mais ameaçados do planeta, onde suas espécies são perdidas em uma taxa maior que aquela em que se conhece o seu papel no ecossistema (Mittermeier et al 2005).
O declínio da biodiversidade não se limita ao aumento das taxas de extinção de espécies, mas inclui também perdas da diversidade genética e funcional em populações, comunidades, ecossistemas e paisagens (Naeem et al 1999). Um dos principais desafios para a conservação do Cerrado é demonstrar o papel que a biodiversidade desempenha no funcionamento dos seus ecossistemas, aliando as implicações das mudanças ambientais para o debate “desenvolvimento versusconservação” (Klink e Machado 2005).
No Domínio do Cerrado, manchas de vegetação com diferentes densidades de árvores ocorrem sob as mesmas condições climáticas, razão pela qual o controle do gradiente de fisionomias tem sido atribuído às características dos solos (Ruggiero et al 2002, Neri et al 2012). Sua vegetação varia de campos abertos com arbustos dispersos a matas fechadas (Oliveira-Filho e Ratter 2002), em solos antigos, distróficos, ácidos, com alto teor de alumínio trocável (Goodland e Pollard 1973, Furley e Ratter 1988, Motta et al 2002) e variável grau de retenção de água (Assis et al 2011). Este conjunto de características implica na variação da abertura do dossel (Tolentino 2011), de forma que a disponibilidade de luz pode atuar como mais um determinante da distribuição de espécies.
afeta as interações entre os componentes bióticos e abióticos do ecossistema (Schöb et al 2013).
Uma das principais características dos solos do Cerrado é a variação do pH, que determina tanto a disponibilidade de nutrientes quanto a toxicidade por Al3+ (Haridasan 2008). Enquanto o alumínio é prejudicial para a maioria das plantas, algumas espécies do Cerrado apresentam resistência fisiológica para a sobrevivência em solos ricos em Al3+, sendo consideradas acumuladoras de alumínio (Haridasan 1982, Jansen et al 2002, Kochian et al 2005). Por outro lado, muitas espécies de florestas secas, comumente associadas a solos com pH superior ocorrem em manchas de solo mais fértil dentro do Cerrado e são intolerantes ao alumínio (Haridasan 1987, Furley e Ratter 1988, Neri et al 2012). Essas espécies, que apresentam perfis ecológicos que diferem quanto à resistência ao Al3+ e à preferência por solos férteis, são comumente encontradas próximas no Cerrado. Sua co-ocorrência se dá pela distinção nas preferências ambientais e diferenças no padrão de alocação de recursos, em que o custo energético envolvido nos mecanismos de resistência ao estresse compromete o crescimento e impede que essas espécies suprimam aquelas que ocupam solos nutricionalmente mais favoráveis (Sarmiento et al 1985, Westoby et al 2002). Esta relação conflitiva para a alocação de recursos é denominada trade-off e fundamenta a coexistência de espécies ecologicamente antagônicas (Kitajima e Poorter 2008). O entendimento das bases fisiológicas que fundamentam estes trade-offs e a promoção da coexistência de espécies é uma das principais questões a serem respondidas pela ecologia atual (Sutherland et al 2013).
variação ambiental, com levantamento da vegetação arbustivo-arbórea que ocorre ao longo de diferentes classes de solo. Características morfológicas e razões isotópicas de C e N das plantas foram utilizadas para a ordenação de grupos funcionais e como indicadores das estratégias de uso dos recursos. Por fim, avaliamos qual o papel da variação ambiental sobre a diversidade funcional da comunidade de plantas lenhosas.
Referências bibliográficas
ASSIS, A. C. C.; COELHO, R. M.; PINHEIRO, E. S.; DURIGAN, G. 2011. Water availability determines physiognomic gradient in an area of low-fertility soils under Cerrado vegetation. Plant Ecology, v.212, p.1135-1147.
BIERAS, A. C.; SAJO, M. G. 2008. Leaf structure of the cerrado (Brazilian savanna) woody plants. Trees, v.23, n.3, p.451-471.
DÍAZ, S.; CABIDO, M. 2001. Vive la differénce: plant functional diversity matters to ecosystem processes. Trends in Ecology and Evolution, v.16, n.11, p.646-655.
FURLEY, P. A.; RATTER, J. A. 1988.Soil resources and plant communities of the Central Brazilian Cerrado and their development. Journal of Biogeography, v.15, p.97-108.
GOODLAND, R.; POLLARD, R. 1973. The Brazilian Cerrado vegetation: a fertility gradient. The Journal of Ecology, v.61, n.1, p.219-224.
GRIME, J. P. Plant strategies, vegetation processes, and ecosystem properties. Chichester: John Wiley& Sons, 2nd ed., 2001. 417p.
HARIDASAN, M. 1982. Aluminium accumulation by some cerrado native species of central Brazil.Plant and Soil, v.65, n.2, p.265-273.
HARIDASAN, M. 1987. Distribution and mineral nutrition of aluminium accumulating species in different plant communities of the cerrado region of central Brazil.p.309-348. In: SAN JOS, J.J. MONTES, R. (eds.). La Capacidad Bioproductiva de Sabanas. I.V.I.C., Caracas, Venezuela, 545p. HARIDASAN, M. 2008. Nutritional adaptations of native plants of the Cerrado biome in acid
soils.Brazilian Journal of Plant Physiology, v.20, n.3, p.183-195.
HOOPER, D. U.; CHAPIN III, F. S.; EWEL, J, J.; HECTOR, A.; INCHAUSTI, P.; LAVOREL, S.; LAWTON, J. H.; LODGE, D. M.; LOREAU, M.; NAEEM, S.; SCHMID, B.; SETÄLÄ, H.; SYMSTAD, A. J.; VANDERMEER, J.; WARDL, D. A. 2005. Effects of biodiversity on ecosystem functioning: a consensus of current knowledge. Ecological Monographs, v.75, n.1, p.3–35.
KITAJIMA, K.; POORTER, L. 2008. Functional basis for resource niche partitioning by tropical trees. p. 160-181. In: CARSON, W.; SCHNITZER, S. (Eds.). Tropical forest community ecology. Wiley Blackwell, 536p.
KLINK, C. A.; MACHADO, R. B. 2005. A conservação do Cerrado brasileiro. Megadiversidade, v.1, n.1, p-147-155.
KOCHIAN, L. V.; PIÑEROS, M. A.; HOEKENGA, O. A. 2005.The physiology, genetics and molecular biology of plant aluminum resistance and toxicity. Plant and Soil, v.274, p.175-195.
MITTERMEIER, R. A.; GIL, P. R.; HOFFMAN, M.; PILGRIM, J.; BROOKS, T.; MITTERMEIER, C. G.; LAMOEUX, J.; FONSECA, G. A. B. Hotspots Revisited: Earth‟s biologically richest and most endangered terrestrial ecoregions. Conservation International: The University of Chicago Press, 2005, 392p.
MOTTA, P. E. F.; CURI, N.; FRANZMEIER, D. P. 2002. Relation of soils and geomorphic surfaces in the Brazilian Cerrado.p.13-32.In:OLIVEIRA, P. S.; MARQUIS, R. J. (Eds.).The Cerrados of Brazil : Ecology and Natural History of a Neotropical Savanna.Columbia University Press, 367p.
MOUILLOT, D.; GRAHAM, N. A. J.; VILLÉGER, S.; MASON, N. W. H.; BELLWOOD, D. R. 2013. A functional approach reveals community responses to disturbances. Trends in Ecology and Evolution, v.28, n.3, p.167-177.
NAEEM, S.; Chapin III, F. S.; COSTANZA, R.; EHRLICH, P. R.; GOLLEY, F. B.; HOOPER, D. U.; LAWTON, J. H.; NEIL, R. V. O.; MOONEY, H. A.; SALA, O. E.; SYMSTAD, A. J.; TILMAN, D. 1999. Biodiversity and ecosystem functioning: maintaining natural life support processes. Issues in Ecology, published by Ecological Society of America, n.4, p.1-12.
NERI, A. V.; SCHAEFER, C. E. G. R.; SILVA, A. F.; SOUZA, A. L.; FERREIRA-JUNIOR, W. G.; MEIRA-NETO, J. A. A. 2012. The influence of soils on the floristic composition and community structure of an area of Brazilian Cerrado vegetation. Edinburgh Journal of Botany, v.69, n.1, p.1-27.
OLIVEIRA-FILHO, A. T.; RATTER, J. A. 2002. Vegetation Physiognomies and Woody Flora of the Cerrado Biome. p.91-120. In: OLIVEIRA, P. S.; MARQUIS, R. J. (Eds.). The Cerrados of Brazil: Ecology and Natural History of a Neotropical Savanna. Columbia University Press, 367p.
PALHARES, D.; FRANCO, A. C.; ZAIDAN, L. B. P. 2010. Respostas fotossintéticas de plantas de cerrado nas estações seca e chuvosa. Revista Brasileira de Biociências, v.8, n.2, p.213-220.
RIBEIRO, J.F.; WALTER, B.M.T. 2008. As principais fitofisionomias do bioma Cerrado. p.151-212. In: SANO, M. S.; ALMEIDA, S. P.; RIBEIRO, J. F. (Eds.) Cerrado: Ecologia e Flora. Brasília, DF: Embrapa Informação Tecnológica, 406p.
RUGGIERO, P.G.C.; BATALHA, M. A.; PIVELLO, V. R.; MEIRELLES, S. T. 2002. Soil-vegetation relationships in Cerrado (Brazilian savanna) and semideciduous forest, Southeastern Brazil. Plant Ecology, v.160, p.1-16.
SCHÖBE, C.; ARMAS, C.; GULER, M.; PRIETO, I.; PUGNAIRE, F. 2013. Variability in functional traits mediates plant interactions along stress gradients. Journal of Ecology v.101, p.753–762
SUTHERLAND, W. J.; FRECKLETON, R. P.; GODFRAY, H. C. J. et al. 2013. Identification of 100 fundamental ecological questions. Journal of Ecology, v.101, p.58–67.
TOLENTINO, G. S. Composição e partição de nicho em gradientes de solo e luz no Cerrado. 2011. 80p. Dissertação (Mestrado em Botânica) - Universidade Federal de Viçosa, Viçosa, MG, 2011. WESTOBY, M.; FALSTER, D. S.; MOLES, A. T.; VESK, P. A.; WRIGHT, I. J. 2002. Plant ecological
F
UNCTIONAL TRAITS AND THE ROLE OF SOIL ATTRIBUTES IN NICHE
OVERLAP AMONG PLANT FUNCTIONAL GROUPS IN THE
C
ERRADO
1. Introduction
Differences in species composition from Cerrado plant communities have been primarily associated with soil properties (Goodland and Pollard 1973, Ruggiero et al 2002, Neri et al 2012), which can therefore be key determinants of species density in these ecosystems (Silva et al 2013). However, the linkage between soil attributes and plant characteristics in determining functional groups with distinct ecological strategies in this ecosystem remains unclear.
Cerrado vegetation varies from open grasslands with scattered shrubs to woodlands, mostly on old, dystrophic and acid soils (Goodland 1971, Oliveira-Filho and Ratter 2002). On these soils, high levels of exchangeable aluminium is the main source of stress for plants (Furley and Ratter 1988, Motta et al 2002). However, patches of mesotrophic to eutrophic soils are commonly found within a domain of predominant poor soils, possessing species selected by greater nutrient availability, hence enhancing the number of ecological strategies (Oliveira-Filho and Ratter 2002, Neri et al 2012). Although important for biodiversity conservation, the Cerrado is among the most endangered ecosystems worldwide, whose species have become extinct before science could assess their role in the ecosystem (Mittermeier et al 2005). Due to their environmental characteristics and wide range of plant adaptation to several combined stress (Bieras and Sajo 2008, Palhares et al 2010), it is possible to assume the Cerrado system as a model for understanding how soil characteristics may play a critical role in species distribution and functional traits changes (Carvalho and Batalha 2013, Silva et al 2013).
encompasses leguminous plants, adapted to nutrient-poor Cerrado soils, where its ability to incorporate nitrogen into the system provides a distinct advantage over other plant species, as nitrogen is a key factor for growth and development (Sprent 2007, Ferguson et al 2013). Finally, the transition between Cerrado and seasonally dry forests enhances the representativeness of drought-tolerant species (Oliveira-Filho and Ratter 2002), formed by species growing on patches of more fertile soils, representing the third plant functional group in Cerrado.
Although the concepts involved in classification of these groups could be envisaged as intuitive, the arbitrariness in qualifying differences between species as functionally significant is one of the most important problems associated with assigning groups (Vitousek and Hooper 1993). So, we suggest the functional classification through the use of key functional traits, in order to incorporate metrics and reduce the arbitrariness of the functional diversity approaches (Villéger et al 2008). Functional traits have been widely adopted by ecologists because they reduce the dimensionality intrinsec in species-rich ecosystems, providing a feasible way to make inferences on community dynamics and ecosystem functioning (McGill et al 2006, Carvalho and Batalha 2013). It is fundamental to remind that functional traits may provide different information at different scales (Kang et al 2014), but they only reveal their full significance when set in the context of their variance (Messier et al 2010). Studies at large scale have been suggested that functional traits should be addressed under specific environmental conditions (e.g. Paine et al 2015), which can be critical in ecosystems where there is an abrupt change in soils.
abiotic variables, what is the main factor in determining abundance and distribution of each one of them?
2. Material and methods
2.1. Study area
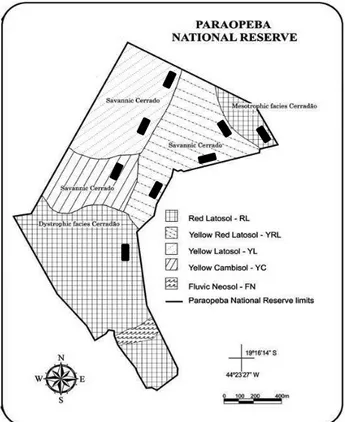
This study was carried out at Paraopeba Reserve, Minas Gerais (19°20'S, 44°20'W), which covers an area of 200 ha (Figure 1). Paraopeba Reserve is a Sustainable Use Conservation Unit, according to the Brazilian System of Conservation Units (SNUC 2000), which ensures the multiple uses of forest resources and scientific research, focusing on methods for sustainable exploitation of native forests. The climate of this region is classified as Aw (tropical humid) by the Köppen system (IBGE, 2007), with a rainy summer from October to March and a dry season from April to September. The annual mean temperature and the total annual rainfall are 20.9°C and 1328 mm, respectively. According to Silva-Júnior (1984) and personal statements from former employees, the Paraopeba Reserve vegetation regenerated after clear-cutting in 1952. There are records of fires in 1960 and 1963 but, after that, this area as a whole has been protected from fire. For this reason, as did by Neri et al (2012), we did not include fire influence in our analysis.
Figure 1. Paraopeba Reserve, MG: soil types and plots in different physiognomies of Cerrado. Adapted from Neri et al (2012).
2.2. Vegetation and environmental characterization
The structure of the tree-shrub layer was taken by placing 75 plots of 20 x 20 m equally distributed along the soil gradient mentioned. As Cerrado vegetation at Paraopeba Reserve is spread into five categories of soil, each one have been represented by 15 plots grouped into three transects (Figure 1). From July 2011 to September 2012 we recorded all woody individuals with stem circumference equal to or larger than 10 cm at ground level. The classification of species into families followed APG III (APG III 2009), with nomenclature of species and abbreviations in agreement with Brazilian Flora Checklist (floradobrasil.jbr.gov.br).
with a 5 m radius centred in the plot. Soil samples taken for chemical analysis were air-dried and sieved. Since Cerrado soils generally show low nutrient status and fertility have been shown to influence its vegetation, we used cation exchange capacity (CEC), inorganic N and pH as proxy for soil fertility. Furthermore, as pH determines the Al3+ availability, it was also considered as a source of stress. The pH values were obtained at aqueous solution and inorganic N was gathered from the sum of nitrate (NO3-) and ammonium (NH3). For the
NO3- and NH3 measurements, colorimetric analyses were used. All these variables were
determined in the Soil Laboratory at the Federal University of Viçosa, following methods described by Embrapa (1997).
As a proxy for light availability, canopy openness was described by taking hemispherical photographs (Breshears and Ludwig 2010). At 300 subplots of 10 x 10 m, images were taken by a digital camera Nikon Coolpix 5700 with extender Nikon UR-E12 and fisheye lens Nikon FC-E9, supported 1.5 m height by a tripod. Sampling was carried out in perfectly overcast conditions or in the last hours of the day, with no direct light (Jonckheere et al 2004), between the middle and the end of the rainy season (February 2012), when the canopy cover was maximum and the light could act as a limiting factor for plants. Pictures were taken on three different exposures (-1.3, 0.0, +1.3), which made us able to pick that one with higher contrast and better representation of the canopy cover. Photos were analysed on Gap Light Analyzer® (GLA) software (Frazer et al 1999). For each plot of 20 x 20 m, canopy openness values were obtained by averaging four 10 x 10 m subplots.
2.3. Functional traits
Despite the broad floristic richness of Cerrado, usually just a few species encompass most of the basal area and abundance of the community. So, we assigned that only those species which collectively made up 75% of the local abundance were responsible for changes in functional diversity, as suggested by Cornelissen et al (2003) and Pérez-Harguindeguy et al (2013). Thus, we evaluated functional traits on 34 species, accounting for 74.06% of the cumulative relative abundance in Cerrado of Paraopeba Reserve. For each species, five individuals were selected for traits measurement at that environment where it was more abundant.
and stress tolerance (Cianciaruso et al 2012, Pérez-Harguindeguy et al 2013). All traits, except wood density, were measured according to the protocols proposed by Cornelissen et al (2003) and Pérez-Harguindeguy et al (2013). We determined wood density using data available on The Global Wood Density (GWD) database, subsection Tropical South America (Chave et al 2009). Although we have adopted relative abundance of species as criteria to choose species for traits measurement, our sampling is plot-specific, which allowed us to focus on environmental effects (Cianciaruso et al 2009). So, we assembled functional traits measured on individuals of a plot as a measure of functional traits of this plot. Because data on wood density was obtained from the online database, there was no variability for it.
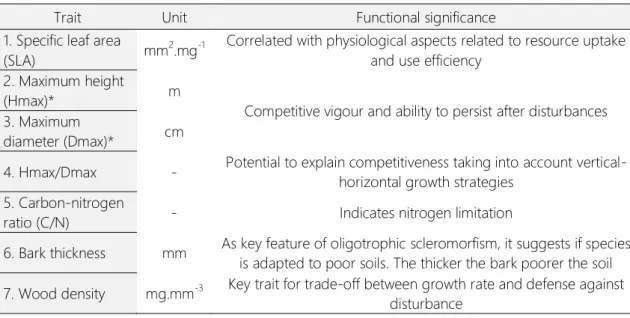
Table 1. Plant traits used to analyze functional groups of a Cerrado community at Paraopeba, Minas Gerais. (*) indicates a trait that was not directly used for data analysis, but which is part of a rate.
Trait Unit Functional significance
1. Specific leaf area
(SLA) mm
2.mg-1 Correlated with physiological aspects related to resource uptake
and use efficiency 2. Maximum height
(Hmax)* m
Competitive vigour and ability to persist after disturbances 3. Maximum
diameter (Dmax)* cm
4. Hmax/Dmax - Potential to explain competitiveness taking into account vertical-horizontal growth strategies
5. Carbon-nitrogen
ratio (C/N) - Indicates nitrogen limitation
6. Bark thickness mm As key feature of oligotrophic scleromorfism, it suggests if species is adapted to poor soils. The thicker the bark poorer the soil 7. Wood density mg.mm-3 Key trait for trade-off between growth rate and defense against
disturbance
2.4. Data analysis
We constructed a numerical matrix with averaged values of SLA, Hmax/Dmax, C/N, bark thickness and woody density for 34 species, from which we were able to check the consistency of three functional groups previously labeled: Al-resistants, dry and legumes. All traits were filled with continuous values, which supported us to use Principal Component Analysis followed by a PERMANOVA, both performed on software PAST 3.06.
To evaluate how much the distribution of these groups is overlapped, we calculated the niche overlap index (NOk) proposed by Mouillot et al (2005). We used separately pH,
applied to any data distribution. In addition to the index generated by pairwise combinations, it also reports an average value of niche overlap in the community.
To further investigate relationships between abiotic effects and abundance of these three functional groups, we created generalized linear models (GLMs) applying abundance of each group as response variable and cation exchange capacity (CEC), pH, inorganic N, canopy openness and abundance of another two groups as explanatory variables. GLMs were carried out using the glm.nb function from the MASS package. We used negative binomial errors distribution for count data, as data showed a great overdispersion. Through dredge function from the MuMIn package we tested all possible combinations of variables included in full model. To identify which of these factors were most conclusive for changes in abundance of functional groups we used the Akaike's Information Criteria of Second Order (AICc), which is suitable for small samples and where the best model is indicated by the lower value of AICc (Burnham et al 2011). All these analysis were performed within the R environment (R Development Core Team 2015).
3. Results
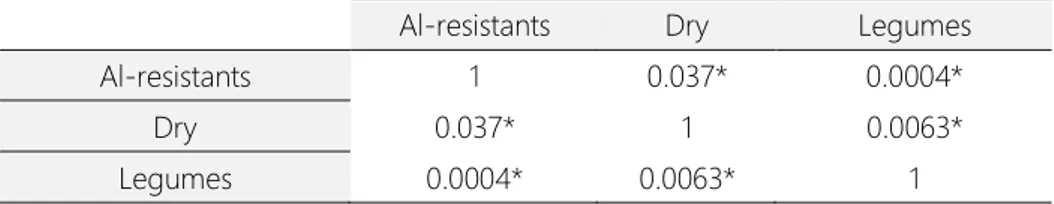
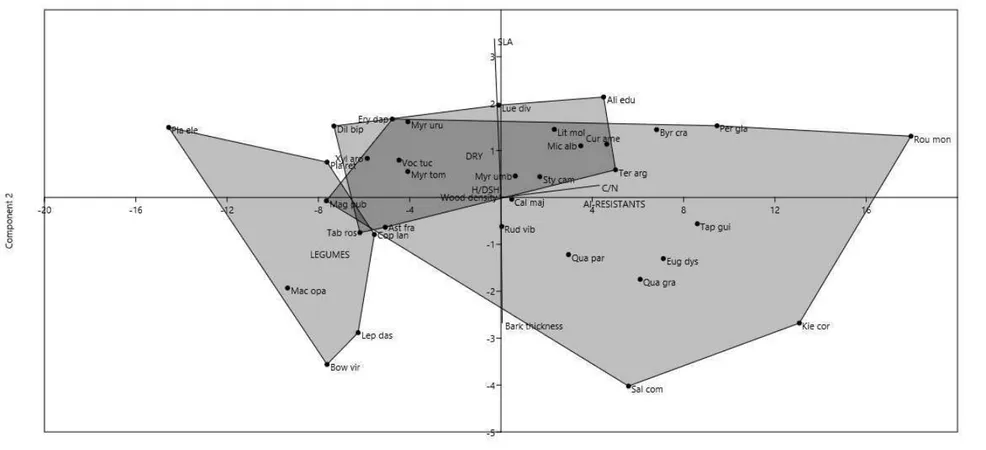
We found 14,671 individuals from tree-shrub layer in 3ha of Cerrado vegetation, spread into 174 species and 51 families. Among them, 10,866 individuals belongs to those 34 species which made up 74,06% of the total abundance of community. PERMANOVA (p=0.0002) and PCA based on functional traits showed that this community has three distinguishable functional groups (Table 2, Figure. 2). For detailed functional traits values of species and their respective classification in functional groups, please check Appendix S1. Appendix S2 lists all information about abundance of groups as well environmental characteristics from plots used in this analysis.
Table 2. p-values from PERMANOVA for three distinguishable plant functional groups from Cerrado
at Paraopeba Reserve, Minas Gerais. (* indicates p≤0,05).
Al-resistants Dry Legumes
Al-resistants 1 0.037* 0.0004*
Dry 0.037* 1 0.0063*
Niche overlap analysis demonstrated that environmental factors may affect the distribution and overlap between plant functional groups. As shown in Table 3, each group pair had highest overlap at a specific habitat condition or resource. Al-resistants and dry species were more overlapped at an inorganic N gradient, whereas cation exchange capacity was the gradient along which Al-resistants strongly overlapped with legumes. On the other hand, legumes and dry species had greater niche overlap at a canopy openness gradient. Figures illustrating the niche overlapping between all combinations are available on Appendix S3.
Table 3. Niche overlap values (NOk) between pairs of three functional groups of Cerrado vegetation
at Paraopeba Reserve, Minas Gerais. pH, CEC (cation exchange capacity), inorganic N and canopy openness are environmental axis along which individuals of groups were found.
Al-resistant vs. Dry Al-resistant vs. Legumes Legumes vs. Dry Community
pH 0.568 0.743 0.627 0.534
CEC 0.484 0.859 0.611 0.484
Inorganic N 0.823 0.681 0.698 0.606
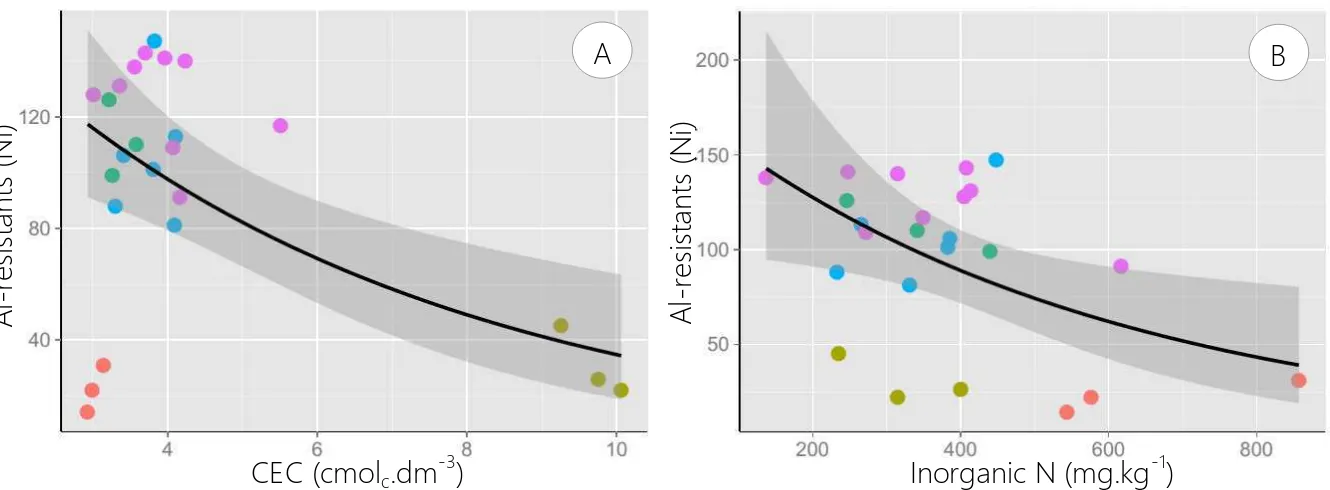
The best model according to AICc for Al-resistants indicated that only CEC and inorganic N amount are important to define the abundance of this group (Figure 3, Table 4). Abundance of species from tropical dry forests was defined by pH and canopy openness, as well by the abundance of Al-resistant species (Figure 4, Table 4). The canopy openness and
dry species‟ abundance are the factors that best explain variation in abundance of legumes
(Figure 5, Table 4).
Table 4. Results from GLMs for effects of environment and distinct functional groups on abundance of plant functional groups. (pH = pH, CEC = cation exchange capacity (cmolc.dm-3), InorgN =
inorganic nitrogen (mg.kg-1), CpyOpen = % canopy openness, Al-resistants = number of individuals of functional group which assemble aluminium-resistant species, Dry = number of individuals of species from tropical dry forests, Legumes = number of individuals of legume species). Only the best model is showed for each group. Values indicate coefficient estimates and standard errors.
pH CEC InorgN CpyOpen
Al-resistants Dry Legumes AICc weight
Al-resistants
-0.197
(0.045)***
-0.002
(0.0006)*** 249.7 0.258
Dry 0.655
(0.118)***
-0.115
(0.010)***
0.007
(0.001)*** 193.3 0.58
Legumes -0.073
(0.018)***
-0.014
(0.004)*** 174.7 0.179
P-values: 0 „***‟ 0.001 „**‟ 0.01 „*‟ 0.05 „.‟
Figure 3. Graphs of the best model for abundance of Al-resistant functional group at Cerrado of Paraopeba Reserve.
CEC (cmolc.dm-3)
A l-re si st a n ts ( N i) A A l-re si st a n ts ( N i)
Inorganic N (mg.kg-1)
B
Savanna on Red Yellow Latosol.
Mesotrophic woodland, Savanna on dystrophic Cambisol, Savanna on Yellow
Figure 5. Graphs of the best model for abundance of legume functional group in response to environmental conditions and abundance of another functional groups (al-resistants and dry species).
D ry ( N i) pH
A B
Canopy openness (%)
D ry ( N i) D ry ( N i) Al-resistants (Ni)
C Figure 4. Graphs of the best model for abundance of species from tropical dry forests in relation to environment and abundance of another functional groups at Cerrado of Paraopeba Reserve. Le g u m e s (N i) Dry (Ni) B
Canopy openness (%)
Le g u m e s (N i) A
Savanna on Red Yellow Latosol. Mesotrophic woodland,
Savanna on Savanna on dystrophic Cambisol,
Dystrophic woodland
Yellow Latosol and
Savanna on Red Yellow Latosol.
Mesotrophic woodland, Savanna on dystrophic Cambisol, Savanna on Yellow
4. Discussion
Our results demonstrated that the plant traits used in the analysis of functional groups were consistent for distinction of the three groups suggested a priori. Since these traits are related to main description of Cerrado habitats, where nutrient status of soil imposes strong stress and determines different uses of resources (Pérez-Harguindeguy et al 2013), it appears to be the worthy subject for future functional diversity studies of these communities. Revealing how plant traits vary on habitat gradients and how ecological processes may mediate such variation is important for understanding plant community assembly (Kang et al 2014).
According to niche theory, environmental conditions are the main factor which hinders species without certain traits from occurring in local communities (Lambers et al 2012), so that different habitat characteristics may play a kind of role in selecting different ecological strategies. While dry species were positively related to pH and negatively related to canopy openness, both of them being good indicators of soil fertility, species into Al-resistants group show lower abundance in soils with more cation exchange capacity and high levels of inorganic N than in poor soils (Figure 3), which reinforces the idea about niche partitioning between different ecological strategies along a fertility gradient (Grime 2001). This is probably the oldest idea about community assembly in Cerrado (Goodland and Pollard 1973), but for the first time we demonstrated which environmental variables are critical in distribution of its species from the perspective of functional traits and functional groups. Al-resistants seems to illustrate a good example of trade-off between resistance to stress and competition ability (Grime 2001), once investment in mechanisms of aluminium resistance on poor soils may reduce competition ability onto fertile soils. For this ecological strategy, abiotic factors appear to be more selective than the biotic ones.
Except for the inorganic N gradient, in which N2 fixation makes legumes
independent, the highest niche overlap indices along environmental gradients (pH, cation exchange capacity and canopy openness) were found for the pairs involving legumes. Also, legumes suffered the less evident influence of environmental characteristics and had the highest range of distribution, while resistant aluminum were related to poor and acid soils and dry species were more prevalent on soils with higher pH and lower light availability. So, our results show an antagonism between Al-resistants and dry species, while suggesting legumes as group with greater plasticity among these three ones. Of course, biotic factors which may affect the degree to which the distribution of the groups are overlapped (e.g. competition) should be directly evaluated, but we have now showed from the perspective of resource availability and stress tolerance what are the environmental preferences of each functional group of Cerrado plants.
Although species from different functional groups may be matched in isolated aspects of their environmental adaptation strategies (like aluminium resistance shared by Al-resistants and legumes or shade tolerance shared by dry and legumes), the distinctness of functional groups reveals a more consistent pattern of plant response to environmental variations (Lavorel and Garnier 2002), adding evidence of functional traits as supporters of important mechanisms for coexistence of different ecological strategies (Ratnam et al 2008, Souza et al 2011) in Cerrado.
5. References
A.P.G. [= Angiosperm Phylogeny Group] III. 2009. An update of the Angiosperm Phylogeny Group classification for the orders and families of flowering plants: APG III. Botanical Journal of Linnean Society. 161: 105-121.
BIERAS, A. C.; SAJO, M. G. 2008. Leaf structure of the cerrado (Brazilian savanna) woody plants. Trees, v.23, n.3, p.451-471.
BRESHEARS, D. D.; LUDWIG, J. A. 2010. Near-ground solar radiation along the grassland–forest continuum: Tall-tree canopy architecture imposes only muted trends and heterogeneity. Austral Ecology, v.35, p.31-40.
BURNHAM, K. P.; ANDERSON, D. R.; HUYVAERT, K. P. 2011. AIC model selection and multimodel inference in behavioral ecology: some background, observations, and comparisons. Behavioral Ecology and Sociobiology, v.65, p.23–35.
CHAVE, J.; COOMES, D.; JANSEN, S.; LEWIS, S. L.; SWENSON, N. G.; ZANNE, A. 2009. Towards a worldwide wood economics spectrum. Ecology Letters, v.12, p.351-366.
CIANCIARUSO, M. V.; SILVA, I. A.; BATALHA, M. A. 2009. Diversidades filogenética e funcional: novas abordagens para a Ecologia de Comunidades. Biota Neotropica, v.9, n.3, p.93-101.
CIANCIARUSO, M. V.; SILVA, I. A.; BATALHA, M. A.; GASTON, K. J.; PETCHEY, O. L. 2012. The influence of fire on phylogenetic and functional structure of woody savannas: moving from species to individuals. Perspectives in Plant Ecology, Evolution and Systematics, v.14, p.205-216.
CORNELISSEN, J. H. C.; LAVOREL, S.; GARNIER, E.; DÍAZ, S.; BUCHMANN, N.; GURVICH, D. E.; REICH, P. B.; ter STEEGE, H.; MORGAN, H. D.; van der HEIJDEN, M. G. A.; PAUSAS, J. G.; POORTER, H. 2003. A handbook of protocols for standardised and easy measurement of plant functional traits worldwide. Australian Journal of Botany, v.51, p.335-380.
DÍAZ, S.; CABIDO, M. 2001. Vive la differénce: plant functional diversity matters to ecosystem processes. Trends in Ecology and Evolution, v.16, n.11, p.646-655.
FERGUSON, B. J.; LIN, M. H.; GRESSHOFF, P. M. 2013. Regulation of legume nodulation by acidic growth conditions. Plant Signaling & Behavior, v.8, n.3, e23426, DOI: 10.4161/psb.23426.
FRAZER, G.W.; CANHAM, C.D.; LERTZMAN, K.P. Gap Light Analyzer (GLA), Version 2.0: Imaging software to extract canopy structure and gap light transmission indices from true-colour fisheye
photographs, user‟s manual and program documentation. Simon Fraser University, Burnaby, British Columbia and the Institute of Ecosystem Studies, Millbrook, New York, 1999. 36p.
FURLEY, P. A.; RATTER, J. A. 1988. Soil resources and plant communities of the Central Brazilian Cerrado and their development. Journal of Biogeography, v.15, p.97-108.
GOODLAND, R.; POLLARD, R. 1973. The Brazilian Cerrado vegetation: a fertility gradient. The Journal of Ecology, v.61, n.1, p.219-224.
GOODLAND, R.; POLLARD, R. 1973. The Brazilian Cerrado vegetation: a fertility gradient. The Journal of Ecology, v.61, n.1, p.219-224.
GRIME, J. P. Plant strategies, vegetation processes, and ecosystem properties. Chichester: John Wiley& Sons, 2nd ed., 2001. 417p.
HARIDASAN, M.; PAVIANI, T. I.; SCHIAVINI, I. 1986. Localization of aluminium in the leaves of some aluminium-accumulating species. Plant and Soil, v.94, p.435-437.
JANSEN, S.; BROADLEY, M.; ROBBRECHT, E.; SMETS, E. 2002. Aluminium hyperaccumulation in angiosperms: a review of its phylogenetic significance. Botanical Review, v.68, p.235-269.
KANG, M.; CHANG, S. X.; YAN, E.; WANG, X. 2014. Trait variability differs between leaf and wood tissues across ecological scales in subtropical forests. Journal of Vegetation Science, v.25, p.703-714. KOCHIAN, L. V.; PIÑEROS, M. A.; HOEKENGA, O. A. 2005.The physiology, genetics and molecular
KRAFT, N. J. B.; VALENCIA, R.; ACKERLY, D. O. 2008. Functional traits and niche-based tree community assembly in an Amazonian forest. Science, v.322, p.580-582.
LAMBERS, J. H. R.; ADLER, P. B.; HARPOLE, W. S.; LEVINE, J. M.; MAYFIELD, M. M. 2012. Rethinking community assembly through the lens of coexistence theory. Annual Reviews of Ecology, Evolution and Systematics, v.43, p.227–248.
LAVOREL, S.; GARNIER, E. 2002. Predicting changes in community composition and ecosystem functioning from plant traits: revisiting the Holy Grail. Functional Ecology, v.16, p.545-556.
MAGNAGO, L. F. S.; EDWARDS, D. P.; EDWARDS, F. A.; MAGRACH, A.; MARTINS, S. V.; LAURANCE, W. F. 2014. Functional attributes change but functional richness is unchanged after fragmentation of Brazilian Atlantic forests. Journal of Ecology, v.102, p.475–485.
McGILL, B. J.; ENQUIST, B. J.; EIHER, E.; WESTOBY, M. 2006. Rebuilding community ecology from functional traits. TRENDS in Ecology and Evolution, v.21, n.4, p.178-185.
MESSIER, J.; McGILL, B. J.; LECHOWICZ, M. J. 2011. How do traits vary across ecological scales? A case for trait-based ecology. Ecology Letters, v13, p838–848.
MITTERMEIER, R. A.; GIL, P. R.; HOFFMAN, M.; PILGRIM, J.; BROOKS, T.; MITTERMEIER, C. G.; LAMOEUX, J.; FONSECA, G. A. B. Hotspots Revisited: Earth‟s biologically richest and most endangered terrestrial ecoregions. Conservation International: The University of Chicago Press, 2005, 392p.
MOUILLOT, D.; STUBBS, W.; FAURE, M.; DUMAY, O.; TOMASINI, A.; WILSON, J. B.; DO CHI, T. 2005. Niche overlap estimates based on quantitative functional traits: a new family of non-parametric indices. Oecologia, v.145, p.345–353.
NERI, A. V.; SCHAEFER, C. E. G. R.; SILVA, A. F.; SOUZA, A. L.; FERREIRA-JUNIOR, W. G.; MEIRA-NETO, J. A. A. 2012. The influence of soils on the floristic composition and community structure of an area of Brazilian Cerrado vegetation. Edinburgh Journal of Botany, v.69, n.1, p.1-27.
OLIVEIRA-FILHO, A. T.; JARENKOW, J. A.; RODAL, M. J. N. 2006. Floristic relationships of Seasonally Dry Forests of Eastern South America based on tree species distribution patterns. p.151-184. In: PENNINGTON, R. T.; RATTER, J. A.; LEWIS, G. P. (Eds.). Neotropical savannas and dry forests: Plant diversity, biogeography and conservation. The Systematics Association Special volume Series 69, CRC Press – Taylor and Francis Group, Boca Raton, Florida, USA, 504p.
PAINE, C. E. T. et al. 2015. Globally, functional traits are weak predictors of juvenile tree growth, and we do not know why. Journal of Ecology, v.103, n.4, p.978-989.
PÉREZ-HARGUINDEGUY, N.; SÍAZ, S.; GARNIER, E.; LAVOREL, S.; POORTER, H.; JAUREGUIBERRY, P.; BRET-HARTE, M. S.; CORNWELL, W. K.; CRAINE, J. M.; GURVICH, D. E.; URCELAY, C.; VENEKLAAS, E. J.; REICH, P. B.; POORTER, L.; WRIGHT, I. J.; RAY, P.; ENRICO, L.; PAUSAS, J. G.; de VOS, A. C.; BUCHMANN, N.; FUNES, G.; QUÉTIER, F.; HODGSON, J. G.; THOMPESON, K.; MORGAN, H. D.; ter STEEGE, H.; van der HEIDJEN, M. G. A.; SACK, L.; BLONDER, L.; POSCHLOD, P.; VAIERETTI, M. V.; CONTI, G.; STAVER, A. C.; AQUINO, S.; CORNELISSEN, J. H. C. 2013. New handbook for standardised measurement of plant functional traits worldwide. Australian Journal of Botany, v.61, n.3, p.167-234.
PUGNAIRE, F. I.; LUQUE, M. T. 2001. Changes in plant interactions along a gradient of environmental stress. Oikos, v.93, n.1. p.42-49.
R Development Core Team. 2015. R: A language and environment for statistical computing.R Foundation for Statistical Computing, Vienna, Austria. ISBN: 3-900051-07-0, http://www.R-project.org/.
RATNAM, J., SANKARAN, M.; HANAN, N. P.; GRANT, R. C.; ZAMBATIS, N. 2008. Nutrient resorption patterns of plant functional groups in a tropical savanna: variation and functional significance. Oecologia, v.157, n.1, p.141-151.
RUGGIERO, P.G.C.; BATALHA, M. A.; PIVELLO, V. R.; MEIRELLES, S. T. 2002. Soil-vegetation relationships in Cerrado (Brazilian savanna) and semideciduous forest, Southeastern Brazil. Plant Ecology, v.160, p.1-16.
SILVA JUNIOR, M. C. Composição florística, estrutura e parâmetros fitossociológicos do cerrado e sua relação com solo na Estação Florestal de Experimentação de Paraopeba, MG. 1984. 130p. Dissertação (Mestrado em Ciência Florestal) – Universidade Federal de Viçosa, Viçosa, MG, 1984. SILVA, D. M.; BATALHA, M. A.; CIANCIARUSO, M. V. Influence of fire history and soil properties on
plant species richness and functional diversity in a neotropical savanna. Acta Botanica Brasilica, v.27, n.3, p.490-497.
SOUZA, J. P.; PRADO, C. H. B. A.; ALBINO, A. L. S.; DAMASCOS, M. A.; SOUZA, G. M. 2011. Network analysis of tree crowns distinguishes functional groups of Cerrado species. Plant Ecology, v.212, p.11–19.
THORPE, A. S.; ASCHEHOUG, E. T.; ATWATER, D. Z.; CALLAWAY, R. M. 2011. Interactions among plants and evolution. Journal of Ecology, v.,99, p.729–740.
VILLÉGER, S.; MASON, N. W. H.; MOUILLOT, D. 2008.New multidimensional functional diversity indices for a multifaceted framework in functional ecology. Ecology, v.89, n.8, p.2290–2301. VITOUSEK, P. M.; HOOPER, D, U. 1993.Biological diversity and terrestrial ecosystem
6. Supporting information
Appendix S1. Functional traits values of 34 species averaged from five individuals at Cerrado at Paraopeba, Minas Gerais. (Al-resistants = functional group which assemble aluminium-resistant species, Dry = species from tropical dry forests, Legumes = legume species, SLA = specific leaf area (mm².mg-1), Hmax/Dmax = maximum height/maximum diameter ratio, C/N = carbon : nitrogen ratio, Bark = bark thickness (mm), Wood = wood density (mg.mm-3), NiTotal = individuals of species at whole community, %abund = relative abundance of the species). Wood density is the only trait not averaged, once it was gathered from an online database (Chave et al 2009).
Code Species Family Functional group SLA Hmax/Dmax C/N Bark Wood NiTotal %abund
Ali edu Alibertia edulis Rubiaceae dry 7.41 0.43 32.54 0.86 0.76 1981 0.1350
Ast fra Astronium fraxinifolium Anacardiaceae dry 5.25 0.97 22.81 1.68 0.82 159 0.0108
Bow vir Bowdichia virgilioides Leguminosae legumes 3.01 0.54 20.08 3.30 0.79 163 0.0111
Byr cra Byrsonima crassifolia Malpighiaceae Al-resistants 7.21 0.27 34.84 1.94 0.58 370 0.0252
Cal maj Callisthene major Vochysiaceae Al-resistants 5.41 0.47 28.37 1.44 0.73 195 0.0133
Cop lan Copaifera langsdorffii Leguminosae legumes 4.91 0.48 22.30 1.44 0.60 128 0.0087
Cur ame Curatella americana Dilleniaceae Al-resistants 6.96 0.39 32.64 1.91 0.65 139 0.0095
Dil bip Dilodendron bipinnatum Sapindaceae dry 8.38 0.79 20.76 1.94 0.69 101 0.0069
Ery dap Erythroxyllum daphnites Erythroxyllaceae Al-resistants 7.80 0.35 23.29 1.21 0.71 449 0.0306
Eug dys Eugenia dysenterica Myrtaceae Al-resistants 5.27 0.35 34.99 3.95 0.73 378 0.0258
Kie cor Kielmeyera coriacea Clusiaceae Al-resistants 3.52 0.47 40.83 4.52 0.29 269 0.0183
Lep das Leptolobium dasycarpum Leguminosae legumes 4.96 0.58 21.55 4.81 0.78 197 0.0134
Lit mol Lithraea molleoides Anacardiaceae dry 7.00 0.55 30.34 1.24 0.51 111 0.0076
Lue div Luehea divaricata Malvaceae dry 9.05 0.76 28.03 2.78 0.56 461 0.0314
Mac opa Machaerium opacum Leguminosae legumes 5.01 0.54 18.48 3.04 0.80 109 0.0074
Mag pub Magonia pubescens Sapindaceae Al-resistants 6.70 1.06 20.31 2.36 0.77 251 0.0171
Appendix S1, cont.
Code Species Family Functional group SLA Hmax/Dmax C/N Bark Wood NiTotal %abund
Myr uru Myracrodruon urundeuva Anacardiaceae dry 8.13 0.50 23.99 1.80 1.00 207 0.0141
Myr tom Myrcia tomentosa Myrtaceae dry 6.36 0.84 23.88 1.26 0.80 203 0.0138
Myr umb Myrsine umbellata Primulaceae Al-resistants 6.11 0.59 28.57 1.55 0.49 372 0.0254
Per gla Pera glabrata Peraceae Al-resistants 6.09 0.52 37.44 0.65 0.67 559 0.0381
Pla ret Plathymenia reticulata Leguminosae legumes 7.72 0.60 20.40 2.32 0.49 67 0.0046
Pla ele Platypodium elegans Leguminosae legumes 8.59 0.49 13.51 1.55 0.75 452 0.0308
Qua gra Qualea grandiflora Vochysiaceae Al-resistants 4.52 0.46 33.92 3.61 0.63 405 0.0276
Qua par Qualea parviflora Vochysiaceae Al-resistants 5.83 0.33 30.86 4.12 0.63 372 0.0254
Rou mon Roupala montana Proteaceae Al-resistants 5.95 0.48 45.93 1.66 0.73 227 0.0155
Rud vib Rudgea viburnoides Rubiaceae Al-resistants 4.98 0.45 27.90 1.79 0.64 244 0.0166
Sal com Salvertia convallariodora Vochysiaceae Al-resistants 3.58 0.20 33.32 6.03 0.65 37 0.0025
Sty cam Styrax camporum Styracaceae Al-resistants 5.97 0.36 29.63 1.49 0.34 241 0.0164
Tab ros Tabebuia roseo-alba Bignoniaceae dry 5.82 0.83 21.72 2.47 0.78 65 0.0044
Tap gui Tapirira guianensis Anacardiaceae Al-resistants 3.90 0.39 36.42 1.15 0.46 368 0.0251
Ter arg Terminalia argentea Combretaceae dry 5.88 0.54 32.96 1.47 0.81 232 0.0158
Voc tuc Vochysia tucanorum Vochysiaceae Al-resistants 6.79 0.39 23.51 1.37 0.48 101 0.0069
Xyl aro Xylopia aromatica Annonaceae Al-resistants 7.31 0.52 22.15 1.83 0.56 305 0.0208
Appendix S2. Abundance of three plant functional groups and environmental variables from 24 plots at Cerrado at Paraopeba, Minas Gerais. (pH = pH, CEC = cation exchange capacity (cmolc.dm-3),
InorgN = inorganic nitrogen (mg.kg-1), CpyOpen = % canopy openness, Al-resistants = functional group which assemble aluminium-resistant species, Dry = species from tropical dry forests, Legumes = legume species, Ni = number of individuals, %abund = relative abundance).
Plot Habitat Al-resistants Dry Legumes pH CEC InorgN CpyOpen Ni %abund Ni %abund Ni %abund
Appendix S3. Niche overlap (NOk) between plant functional groups at Cerrado of Paraopeba Reserve.
Graphs illustrates abundance of functional groups on environmental gradients along which plants were found. NOk is based on kernel density function. (pH = pH, CEC = cation exchange capacity
(cmolc.dm-3), InorgN = inorganic nitrogen (mg.kg-1), CpyOpen = % canopy openness, Alres =
functional group which assemble aluminium-resistant species, Dry = species from tropical dry forests, Leg = leguminous species).
Alres vs. Dry NOk= 0.823
Alres vs. Dry vs. Leg NOk= 0.606
Dry vs. Leg NOk= 0.698
Alres vs. Leg NOk= 0.681
Inorganic N (mg.kg-1) Inorganic N (mg.kg-1)
Alres vs. Dry NOk= 0.568
Alres vs. Leg NOk= 0.743
Dry vs. Leg NOk= 0.627
Alres vs. Dry vs. Leg
NOk= 0.534
Appendix S3, cont.
Alres vs. Dry NOk= 0.484
Alres vs. Leg NOk= 0.859
Dry vs. Leg NOk= 0.611
Alres vs. Dry vs. Leg
NOk= 0.484
CEC (cmolc.dm-3) CEC (cmolc.dm-3)
Alres vs. Dry NOk= 0.479
Alres vs. Leg NOk= 0.618
Dry vs. Leg NOk= 0.818
Alres vs. Dry vs. Leg NOk= 0.479
C
OMPOSIÇÃO ISOTÓPICA E USO DE RECURSOS POR GRUPOS
FUNCIONAIS DE PLANTAS NO
C
ERRADO
1. Introdução
A compreensão dos fatores que determinam a distribuição das espécies de florestas e savanas tem importantes implicações para o manejo destes ecossistemas, especialmente sob a perspectiva da sua resposta a distúrbios naturais e antrópicos e alterações no clima (Hoffmann et al 2012). Embora a ocorrência de formações florestais e savânicas em escala global seja associada a padrões climáticos, no Cerrado manchas de vegetação com diferentes densidades de árvores ocorrem sob as mesmas condições de sazonalidade na temperatura e precipitação (Neri et al 2012, Dantas et al 2013). Assim, o entendimento deste gradiente de fisionomias, que varia de campos com arbustos dispersos a matas fechadas (Goodland 1971, Castro e Kauffman 1998, Oliveira-Filho e Ratter 2002), deve considerar fatores ambientais atuantes em escala regional e local.
A coexistência entre estas espécies é possível pelos fatores da história de vida que possibilitam a partição de recursos e as diferentes estratégias de sobrevivência (Goodland e Ferri 1979, Jackson et al 1999, Palhares et al 2010). Entre espécies que coexistem, a partição tem sido demonstrada através do uso de isótopos estáveis (Stratton et al 2000, Franco et al 2005, Codron et al 2013). A razão deste uso é que os processos de transferência e transformação dos elementos ao longo dos ciclos biogeoquímicos discriminam os átomos mais pesados, criando diferenças na assinatura isotópica (ẟ‰) em cada fase destes processos (Farquhar et al 1989, Martinelli et al 2009). Quando se conhece a assinatura isotópica de dois componentes do ciclo, é possível concluir o quanto a fonte e o dreno do recurso estão relacionadas (Martinelli et al 2009). Recentemente a abordagem de grupos funcionais baseada em isótopos estáveis demonstrou ser um método eficiente para a análise do funcionamento de plantas em nível de comunidade (Werner et al 2012). O δ13C mostrou-se uma forte ferramenta na distinção de grupos funcionais de plantas, integrando características estruturais, fenológicas e fisiológicas (Werner e Máguas 2010). Além disso, a aplicação de δ15N em comunidades de Cerrado indicou que as espécies compartilham o mesmo habitat utilizando diferentes fontes de nitrogênio (Bustamante et al 2004).
O objetivo deste trabalho foi avaliar como o ẟ13C, ẟ15N e C/N variam entre grupos funcionais de plantas, a fim de detectar o potencial destas variáveis como indicadoras de estratégias ecológicas distintas. Assim, analisamos sua relação com (i) traços morfológicos e fisiológicos que subsidiam a definição dos grupos e com (ii) os principais fatores abióticos em diferentes ecossistemas de Cerrado.
2. Material e métodos
2.1. Área de estudo
O estudo foi realizado na Floresta Nacional (FLONA) de Paraopeba, Minas Gerais (19°20'S, 44°20'W), que ocupa uma área de 200 ha (Figura 1). De acordo com o Sistema Nacional de Unidades de Conservação (SNUC 2000), a FLONA é uma Unidade de Conservação para Uso Sustentável que visa garantir o uso múltiplo dos recursos da floresta e a pesquisa científica, com foco principal aos métodos de exploração sustentável das espécies nativas.
média anual e a precipitação acumulada anualmente são de 20,9°C e 1328mm, aproximadamente. De acordo com Silva-Júnior (1984) e informações obtidas com antigos funcionários, a vegetação da FLONA de Paraopeba está em regeneração desde o corte raso que sofreu em 1952. Há registros de fogo nos anos de 1960 e 1963, mas, desde então, a área tem sido completamente protegida de queimadas. Por esta razão a influência do fogo não foi incluída em nossas análises (Neri et al 2012).
Os solos são classificados como Cambissolo Amarelo, Latossolo Amarelo, Latossolo Vermelho Amarelo e Latossolo Vermelho, sendo este último em fases distrófica e eutrófica (Embrapa 2006, Neri 2007). Ao longo deste gradiente, quanto mais vermelho e escuro é o solo maior é a biomassa e a densidade da vegetação (Neri et al 2012). Tanto a fase distrófica quanto a eutrófica dos solos vermelhos são influenciadas por material coluvial calcário ou pela alteração in situ das rochas calcárias (Neri et al 2012). Os cerrados savânicos, por sua vez, são relacionados a solos amarelos rasos ou profundos (Cambissolo/Latossolo) desenvolvidos de ardósia, uma rocha metamórfica pelítica rica em alumínio e pobre em nutrientes (Neri et al 2012). A forte distinção de características ambientais na área da FLONA de Paraopeba torna este fragmento um sistema adequado para o estudo da relação entre o ambiente e as estratégias de aquisição e uso de recursos por plantas de Cerrado.
2.2. Amostragem de material vegetal e traços funcionais
Estudos anteriores nos indicaram as espécies mais representativas da vegetação do Cerrado de Paraopeba (Ver Capítulo I). Neste artigo deu-se ênfase às 34 espécies que respondem por 74,06% da abundância relativa da comunidade, considerando que são potencialmente capazes de indicar diferenças no uso dos recursos entre os três grupos funcionais propostos: (i) espécies resistentes ao Al3+, (ii) espécies leguminosas e (iii) espécies características de floresta seca. Cada uma das espécies foi representada por cinco indivíduos, selecionados no ambiente em que a espécie apresentou abundância mais expressiva, assegurando-se que não fosse amostrado mais que um indivíduo da mesma espécie numa mesma parcela.
Ramos de indivíduos em boas condições fitossanitárias e estádio de maturidade fisiológica equivalente foram coletados em Março de 2013, durante a estação chuvosa (Cornelissen et al 2003). Consideramos quatro traços funcionais críticos para as estratégias ecológicas em questão, relacionados ao vigor competitivo, uso dos recursos e tolerância ao estresse (Cianciaruso et al 2012, Pérez-Harguindeguy et al 2013) (Tabela 1). Com exceção da densidade da madeira, todos os traços foram mensurados de acordo com os protocolos propostos por Cornelissen et al (2003) e Pérez-Harguindeguy et al (2013). Os valores de densidade da madeira foram obtidos através do The Global Wood Density (GWD) database, subseção Tropical South America (Chave et al 2009).
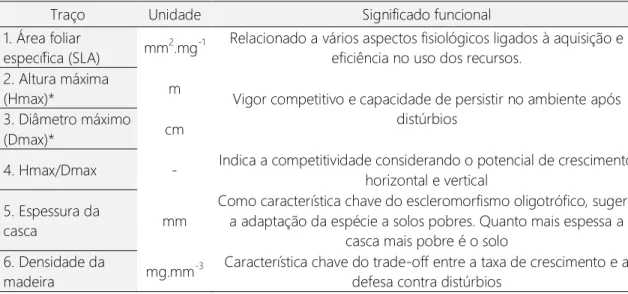
Tabela 1. Traços funcionais avaliados para espécies de plantas do Cerrado de Paraopeba, Minas Gerais. (*) indica um traço que não foi diretamente aplicado, mas que subsidia o cálculo de uma razão empregada nas análises estatísticas.
Traço Unidade Significado funcional
1. Área foliar
específica (SLA) mm
2.mg-1 Relacionado a vários aspectos fisiológicos ligados à aquisição e
eficiência no uso dos recursos. 2. Altura máxima
(Hmax)* m Vigor competitivo e capacidade de persistir no ambiente após distúrbios
3. Diâmetro máximo
(Dmax)* cm
4. Hmax/Dmax - Indica a competitividade considerando o potencial de crescimento horizontal e vertical
5. Espessura da
casca mm
Como característica chave do escleromorfismo oligotrófico, sugere a adaptação da espécie a solos pobres. Quanto mais espessa a
casca mais pobre é o solo 6. Densidade da
madeira mg.mm
-3 Característica chave do trade-off entre a taxa de crescimento e a
2.3. Análise elementar e isotópica das plantas
Cinco folhas de cada indivíduo foram coletadas durante a estação chuvosa (Março de 2013) e secas em estufa a 70-80°C, com exclusão do pecíolo e das nervuras evidentes. O material seco foi triturado em moinho de esferas para redução a partículas de, no máximo, 40 µm. Para a análise elementar do C e N, 5 µg de amostra foram pesados em balança de precisão (XM 1000 P, Sartorius) e depositadas em cápsulas 5x9 de estanho (EuroVector, Milano).
A razão C/N e a razão dos isótopos estáveis 13C/12C e 15N/14N foram determinadas por espectrometria de massa de razão de isótopos estáveis em modo de fluxo contínuo (CF- IRMS), num espectrômetro de massas Isoprime (GV, Reino Unido), acoplado a um Analisador Elementar EuroEA (EuroVector, Itália), que efetua a preparação automática das amostras por combustão de Dumas. Para o C, foram utilizados os materiais de referência IAEA-CH6 e IAEA-CH7. Já para o N foram usados os materiais de referência IAEA-CN1 e USGS-35. A combustão foi feita em excesso de oxigênio (H2O < 3ppm, CnHm < 0.5 ppm)
(Airliquide, Portugal) e gás cromatográfico carregado com hélio (He) (H2O < 3ppm,O2 <
2ppm, CnHm < 0.5 ppm) (Airliquide, Portugal).
Os valores de δ13C apresentam-se na escala determinada pelo PeeDee Belemnite (PDB), enquanto os valores de δ15N se reportam ao ar atmosférico. Todos os valores de δ foram determinados segundo a equação seguinte:
(
– )
onde xx é a massa atômica do isótopo mais pesado da razão e R expressa a relação entre o isótopo raro e o isótopo mais abundante na amostra e na fonte do elemento de interesse (E). Os valores de R têm notação em delta por mil (ẟ‰) (Farquhar et al 1989). As análises foram realizadas no SIIAF (Stable Isotopes and Instrumental Analysis Facility), do Centro de Biologia Ambiental da Faculdade de Ciências de Lisboa, Portugal.
2.4. Caracterização ambiental
círculo com raio de 5 m centralizado na parcela, em profundidade de 0-10 cm. Para análise química, as amostras foram secas ao ar e peneiradas. Avaliamos características pedológicas indicativas de fertilidade (capacidade de troca catiônica e quantidade de nitrogênio total) e estresse para as plantas. O nitrogênio inorgânico foi obtido pela soma de nitrato (NO3-) e amônio (NH3), determinados por análise colorimétrica. A disponibilidade de Al3+ no solo,
considerada uma efetiva fonte de estresse para as plantas (Haridasan 2008), foi determinada por extração em KCl 1,0 mol/L. Todas as variáveis foram determinadas no Laboratório de Solos da Universidade Federal de Viçosa, segundo os métodos descritos pela Embrapa (1997).
A abertura do dossel foi determinada por meio de fotografias hemisféricas (Anderson 1964, Breshears e Ludwig 2010). Em subparcelas de 10 x 10m, as imagens foram obtidas por uma câmera digital Nikon Coolpix 5700 com extensor Nikon UR-E12 e objetiva olho-de-peixe Nikon FC-E9, apoiada a 1,5m do chão por um tripé. As fotografias foram realizadas em condições de céu encoberto ou nas últimas horas do dia, com ausência de luz direta (Jonckheere et al 2004), entre o meio e o fim da estação chuvosa, quando a cobertura das copas é máxima e a luz pode se tornar um fator limitante para as plantas. Para cada parcela foram tomadas imagens com três exposições diferentes (-1.3, 0.0, +1.3), para escolha daquela com maior contraste e melhor representação da estrutura do dossel. As imagens foram analisadas com o software Gap Light Analyzer® (GLA) (Frazer et al 1999). Para cada parcela de 20 x 20m, a abertura do dossel foi obtida pela média entre quatro subparcelas de 10 x 10 m.
2.5. Análise dos dados
Foram criados GLMs (Generalized Linear Models, família de erros Gaussian) para avaliar a diferença dos valores de C/N, δ13C e δ15N entre os grupos funcionais e a relação entre estas variáveis. Após análises exploratórias os valores da espécie Roupala montana foram excluídos devido à forma como sua discrepância tendenciou os demais resultados, especialmente no que se refere ao δ15N. Até o momento sugerimos que seja mais adequado tratar esta espécie como um grupo funcional à parte, uma vez que sua assinatura de 15N indica o uso de uma fonte distinta de nitrogênio.
de distribuição de erros Gaussian), com o SLA, densidade da madeira, razão altura:diâmetro e espessura da casca. Para o segundo caso foram construídos GLMMs (Generalized Linear Mixed Models) com a capacidade de troca catiônica (CEC, cation exchange capacity), pH, nitrogênio total, nitrogênio inorgânico, abertura do dossel e grupo funcional como variáveis preditoras. Os GLMMs foram criados utilizando a função lmer do pacote lme4, com distribuição de erros Gaussian (24 parcelas, n=100 observações), com as variáveis citadas como efeito fixo e as parcelas como efeito aleatório. Através da função dredge do pacote MuMIn foram testadas todas as combinações possíveis das variáveis incluídas no modelo global, onde os fatores mais decisivos para a C/N, δ13C e δ15N foram identificados através da abordagem teórica AICc (Akaike's Information Criteria of Second Order), que aponta o melhor modelo pelo menor valor de AICc (Burnham et al 2011). Todas as análises foram realizadas na plataforma R versão 3.1.2 (R Development Core Team 2015).
3. Resultados
Houve relação significativa entre o ẟ13C e o ẟ15N (Figura 3A). A menor proporção de
13
C indica que plantas que utilizam uma fonte de nitrogênio empobrecida em 15N estão em condições mais favoráveis à fotossíntese, ao passo que as espécies que se encontram em circunstâncias de limitação à fotossíntese (i.e. maior proporção de 13C) utilizam o nitrogênio enriquecido em 15N que já sofreu altas taxas de fracionamento no ecossistema (Figura 3A). Este padrão demonstra um antagonismo entre as espécies resistentes ao Al3+ e as plantas de floresta seca, e sugere que os mecanismos de resistência não comprometem a produtividade das espécies capazes de tolerar o Al3+ do solo. As leguminosas encontram-se em condições fotossintéticas intermediárias e com valores de ẟ15N entre -3‰ e 1,4‰, o que indica que a fixação de N2 atmosférico é um dos processos de incorporação de
nitrogênio ao sistema. A C/N apresentou influência negativa sobre o ẟ13C e o ẟ15N, de forma que quanto maior a proporção de carbono para nitrogênio no tecido foliar mais as plantas são empobrecidas em 13C e 15N (Figuras 3B e 3C).
Figura 2. Valores de C/N, ẟ13C e ẟ15N de grupos funcionais de plantas arbustivo-arbóreas do Cerrado de Paraopeba, Minas Gerais. Letras iguais indicam ausência de diferença estatística a p<0,05.
Dry
ẟ Resistentes ao Al3+ Dry Leguminosas
C
/N
a
b
c A
ẟ
13 C
Resistentes ao Al3+ Dry Leguminosas
b
a a
B
Resistentes ao Al3+ Dry Leguminosas
ẟ
15 N
b
a a
A C/N relacionou-se à área foliar específica (SLA), densidade da madeira e razão altura:diâmetro (Tabela 2, Figura 4), sendo também influenciada pelo grupo funcional (Tabela 2, Figura 2A). O SLA aumenta do grupo das espécies resistentes ao Al3+ para as espécies tolerantes à seca, onde as leguminosas apresentam valores de SLA entre estes dois extremos (Figura 4A). Assim como o SLA, a densidade da madeira e a razão altura:diâmetro relacionam-se negativamente à razão C/N (Figura 4B e 4C). Espécies resistentes ao Al3+ apresentam maiores valores de C/N e menores valores de SLA, densidade da madeira e razão altura:diâmetro. Ao mesmo tempo, espécies tolerantes à seca possuem características opostas, o que reafirma o antagonismo entre estes dois grupos. As espécies leguminosas demonstraram uma condição intermediária quanto a todos os traços funcionais avaliados.
Dentre os traços funcionais considerados neste trabalho, a densidade da madeira foi o único determinante do δ13C e do δ15N, de forma que plantas que apresentam maior densidade da madeira (em geral as tolerantes à seca e as leguminosas) de alguma forma
Figura 3. Relações entre a composição isotópica de ẟ13C, ẟ15N e C/N de plantas arbustivo-arbóreas de diferentes grupos funcionais do Cerrado de Paraopeba, Minas Gerais. Espécies resistentes ao Al3+, dry e leguminosas. A
ẟ
13 C
ẟ15
N
B
ẟ
13 C
C/N C
ẟ
15 N
estão sob condições de limitação à fotossíntese (portanto, enriquecidas em 13C) (Figura 5) e utilizam uma fonte de nitrogênio enriquecida em 15N (Figura 6). Os valores de C/N, δ13C,
δ15
N e de traços funcionais para as espécies deste estudo encontram-se detalhados no Apêndice S1.
Tabela 2. Resultado dos GLMs para a relação entre os traços e grupos funcionais e a C/N, δ13C e δ15N de plantas arbustivo-arbóreas do Cerrado de Paraopeba, Minas Gerais. Somente o melhor modelo selecionado pelo valor de AICc é apresentado. Os valores indicam o coeficiente da relação e o erro padrão.
SLA Densidade da madeira
Altura : Diâmetro
Espessura
da casca Grupo AICc weight C/N -1,527 (0,478)** -10,03 (5,113), -13,72(4,133)** + 193,6 0,507
δ13C 2,075(1,002)* 87,9 0,135
δ15
N 3,697(1,840). 2,35 (1,417)ns 125,8 0,170
Valores de significância: 0 „***‟ 0.001 „**‟ 0.01 „*‟ 0.05 „.‟ ns „não significativo‟
Figura 4. Gráficos do melhor modelo para a relação entre os traços funcionais e a razão C/N de plantas arbustivo-arbóreas de diferentes grupos funcionais do Cerrado de Paraopeba, Minas Gerais. Espécies resistentes ao Al3+, dry e leguminosas.
A B