❊♥s❛✐♦s ❊❝♦♥ô♠✐❝♦s
❊s❝♦❧❛ ❞❡ Pós✲●r❛❞✉❛çã♦ ❡♠ ❊❝♦♥♦♠✐❛ ❞❛ ❋✉♥❞❛çã♦ ●❡t✉❧✐♦ ❱❛r❣❛s
◆◦ ✹✻✹ ■❙❙◆ ✵✶✵✹✲✽✾✶✵
❇r❛③✐❧✐❛♥ ▼❛❝r♦❡❝♦♥♦♠✐❝s ❲✐t❤ ❛ ❍✉♠❛♥
❋❛❝❡✿ ▼❡tr♦♣♦❧✐t❛♥ ❈r✐s✐s✱ P♦✈❡rt② ❛♥❞ ❙♦✲
❝✐❛❧ ❚❛r❣❡ts
▼❛r❝❡❧♦ ❈♦rt❡s ◆❡r✐
❖s ❛rt✐❣♦s ♣✉❜❧✐❝❛❞♦s sã♦ ❞❡ ✐♥t❡✐r❛ r❡s♣♦♥s❛❜✐❧✐❞❛❞❡ ❞❡ s❡✉s ❛✉t♦r❡s✳ ❆s
♦♣✐♥✐õ❡s ♥❡❧❡s ❡♠✐t✐❞❛s ♥ã♦ ❡①♣r✐♠❡♠✱ ♥❡❝❡ss❛r✐❛♠❡♥t❡✱ ♦ ♣♦♥t♦ ❞❡ ✈✐st❛ ❞❛
❋✉♥❞❛çã♦ ●❡t✉❧✐♦ ❱❛r❣❛s✳
❊❙❈❖▲❆ ❉❊ PÓ❙✲●❘❆❉❯❆➬➹❖ ❊▼ ❊❈❖◆❖▼■❆ ❉✐r❡t♦r ●❡r❛❧✿ ❘❡♥❛t♦ ❋r❛❣❡❧❧✐ ❈❛r❞♦s♦
❉✐r❡t♦r ❞❡ ❊♥s✐♥♦✿ ▲✉✐s ❍❡♥r✐q✉❡ ❇❡rt♦❧✐♥♦ ❇r❛✐❞♦ ❉✐r❡t♦r ❞❡ P❡sq✉✐s❛✿ ❏♦ã♦ ❱✐❝t♦r ■ss❧❡r
❉✐r❡t♦r ❞❡ P✉❜❧✐❝❛çõ❡s ❈✐❡♥tí✜❝❛s✿ ❘✐❝❛r❞♦ ❞❡ ❖❧✐✈❡✐r❛ ❈❛✈❛❧❝❛♥t✐
❈♦rt❡s ◆❡r✐✱ ▼❛r❝❡❧♦
❇r❛③✐❧✐❛♥ ▼❛❝r♦❡❝♦♥♦♠✐❝s ❲✐t❤ ❛ ❍✉♠❛♥ ❋❛❝❡✿ ▼❡tr♦♣♦❧✐t❛♥ ❈r✐s✐s✱ P♦✈❡rt② ❛♥❞ ❙♦❝✐❛❧ ❚❛r❣❡ts✴
▼❛r❝❡❧♦ ❈♦rt❡s ◆❡r✐ ✕ ❘✐♦ ❞❡ ❏❛♥❡✐r♦ ✿ ❋●❱✱❊P●❊✱ ✷✵✶✵ ✭❊♥s❛✐♦s ❊❝♦♥ô♠✐❝♦s❀ ✹✻✹✮
■♥❝❧✉✐ ❜✐❜❧✐♦❣r❛❢✐❛✳
BRAZILIAN MACROECONOMICS WITH A HUMAN FACE:
METROPOLITAN CRISIS, POVERTY AND SOCIAL TARGETS
∗∗Marcelo Neri1
∗ I would like to thank Andrés Marinakis, Rolph Van der Hoeven, Roberto Frenkel Andres Solimano and other participants of the ILO Seminar held at Santiago for their comments. I would also like to thank Alexandre Pinto, Luisa Carvalhais, Lucélia Santos, Daniela Costa and Fabiano Giovanini for excellent research assistance and Roberto Neri for doing most of the translation. All remaining errors are my responsability.
1
INDEX
1 – Introduction ………4
1.1- Motivation………..4
1.2- Plan of the Paper………...………5
2 Macroeconomic Environment and Income Distribution: An Overview ..………...7
2.1- Macroeconomic Background………7
2.2- Overview of income distribution in the nineties……….7
i) Chronic Uncertainty (1990 –1993)………12
ii) Post-stabilization boom (1993-1996)……….12
iii) Critical uncertainty (1996-1999)...………..15
3 – Anatomy of the crisis (1996 – 1999) by city size...………..15
3.1- Unemployment…...………..………15
3.2- Informality…...………16
3.3- Per capita family labor income……..………17
3.4- Per capita family income from all sources…...……….17
3.5- Poverty...………...18
3.6- Spatial correlation patterns...………...18
4 –Collateral Effects of the crisis (1996 – 1999)…...………..………20
4.1- Violence………20
4.2- Elections………...20
5 – Possible Causes of the crisis (1996 – 1999)…..………...21
5.1- Administrative reform………22
5.2- Labor reform…...………23
5.3- Trade Opening……….………24
5.4- Social security……….……….25
5.5- Minimum wage reform………….………..25
6 – Unemployment crisis…..………..26
6.1- Concepts………...26
6.2- National Unemployment…...………..27
6.3- Unemployment in the Upper Class…...……….27
6.4- Zoom in the metropolitan crisis………..………….………..28
6.5- Metropolitan unemployment crisis………30
7 – Individual Labor Risks and Aggregate Recessions..….………..…………..31
7.1- Methodology……….31
7.2- Unemployment and Inactivity………32
8 – Macro determinants of poverty and per capita income distribution: a time series approach
Analysis………..…………..35
Level of activity...………38
Inflation………...39
Real interest rates………...39
Minimum Wages……….40
Exchange Rates………...41
CPI based real exchange rates………...41
Decomposing CPI based exchange rates………...41
WPI based real exchange rates………..43
Decomposing WPI based exchange rates……….44
9 – VAR of inflation, unemployment and poverty………..……….45
9.1-Theoretical Considerations...45
9.2- Empirical Model...46
9.3- Impulse Response Functions………...48
10 – Social Targets………..50
10.1- Concept………...50
10.2- Macro Economic and Social Commitments………51
10.3- What targets to settle for?………52
10.4- Summary of the Objectives of Social Targets ...………53
11- Scenarios of Inequality, Growth and Misery……….53
11.1 Ravallion-type prospective Simulations………...55
BRAZILIAN MACROECONOMICS WITH A HUMAN FACE: METROPOLITAN CRISIS , POVERTY AND SOCIAL TARGETS
1 – Introduction
1.1 Motivation
This paper analysis the impacts of Brazilian macroeconomic developments during the
1990´s on labor market and social indicators. Special emphasis is given to the period marked
by the adverse effects of external shocks such as the Asian crisis of 1997, the Russian crisis of
1998 and the Brazilian devaluation crisis of 1999. Our main conclusion is that the description
of the social impacts of these crisis does not fit a single story. We show that the plot of the
main stories observed depend on at least three dimensions: i) Who was affected by the
shocks? that is to what extend the crisis affected more the Brazilian elite or those initially
situated below the poverty line? ii) What? to what extend the crisis affected labor income vis
a vis other income sources such as government transfers, social security benefits and capital
income. iii) Where? was the social crisis more acute in rural areas and small cities or in the
core of metropolitan areas.
The answer to the questions posed above is that the epicenter of the crisis was labor
earnings of middle and upper segments living in larger urban areas. This period can not be
refered as a national poverty crisis, since poverty rates in rural areas and small cities fell
during this period. While labor markets specially in big cities were quite adversely affected,
incomes derived from social security, unemployment insurance and other government
transfers played a crucial role cushioning the micro consequences of macro shocks observed.
In this sense, “metropolitan unemployment crisis” seems an appropriate way to label the
1996-99 period. Unemployment rates (specially long term unemployment) rose by more than
one third of its initial value after the arrival of the Asian crisis in Brazil. This point is
noteworthy since the main input of the Brazilian social debate are unemployment rates
derived from monthly employment surveys performed only in the main metropolitan areas.
The paper argues in favor of the use of per capita income based social measures that can be
1.2. Plan of the Paper
Besides this introduction, the conclusion and two sections on policy prescriptions the
main body of the paper is empirical. This part is organized in two blocks according to the
main data sources used, that is PNAD (a Nationa l Household Survey) and PME (a Monthly
Employment Survey performed in the six main metropolitan areas).
Section 2 presents an overview the main stylized facts of the Brazilian economy in the
last two decades. Section 2.1 describes the main changes of macroeconomic policies and
environment occured. Section 2.2 describes the evolution of Brazilian Income distribution in
the 1990s. It analyses the economic performance of three income groups (elite, middle class
and the poor) during three sub-periods of the 1990s (1990-93, 1993-96 and 1996-99) at a
national level.
The following three sections detail the social performance during the latter period by
six different city sizes (rural areas, small cities, mid-sized cities, large cities and metropolitan
areas divided into core and suburbs). Section 3 compares the evolution of standard social
indicators (such as unemployment rates, labor income, informality, income from all sources
and poverty). Section 4 analyzes other behavioral consequences of the crisis by city size, such
as the effects exerted on immigration patterns, violence and electoral outcomes. The
following section analyses institutional changes as possible determinants of the different
social patterns observed by city size. In particular, we look on sensitivity measures to
different items of the structural reform agenda implemented during the 1990s (or yet to be
implemented) such as administrative reform, trade opening, labor reform, minimum wage and
social security reform.
Section six attempts to smooth the transition between the two main data sources used
in the paper. The strategy is to simulate the results obtained from PME by gradually
restricting PNAD spatial coverage and income concepts. This section work as a zoom
departing from national social measures based on all income sources to metropolitan labor
market indicators.
The second half of the empirical part of the paper looks at longer time horizons using
PME. Section 7 implements an episodic analysis of the main booms and recessions observed
in Brazil during the last two decades. The idea here is to provide a basis of comparisson
between the recent external crisis with the main downturns and upturns observed in Brazil.
First, it describes the main changes of macroeconomic policies and regimes and its social
in metropolitan areas. In particular, this section takes advantage of the longitudinal aspect of
PME to assess the effects of adverse macro environments at the individual level. We estimate
the probabilities of entering (or exiting) precarious states such as unemployment and poverty
in various sub-periods.
Section 8 and 9 explore the possibility of constructing monthly time series on poverty
(P0, P1 and P2 using different poverty lines) and income distribution (earnings deciles,
inequality measures) to assess their main macro determinants. Section 8 extracts simple and
partial correlation patterns between these social indicators and macro variables (GDP,
unemployment, inflation, interest rates, minimum wages and exchange rates). We also
attempt to disentangle correlation patterns derived from pure exchange rates movements from
those derived from deviations from equilibrium exchange rates as measures of exchange rate
policies.
Section 9 implements a structural time series model. It estimates a VAR that specifies
the dynamic relations between shocks to inflation, unemployment and poverty using impulse
response functions. The two identification strategies assumed correspond to commitment and
discretionary regimes of the so-called Barro-Gordon model. The objective of this exercise is
to set a basis for the discussion of restrictions imposed by setting targets on poverty target
when there is (and when there is not) inflation targeting.
Section 10 describes the main objectives, limitations and desired features of a system
of poverty targeting. Section 11 presents counterfactual exercises on poverty measures based
on different scenarios for growth and inequality changes using Ravallion-type
2 –Macroeconomic Environment and Income Distribution: An Overview
2.1 Macroeconomic Background
This section presents a macroeconomic background of the Brazilian Economy in the
last twenty years. Graphs 1 to 4 below presents monthly time series of unemployment,
inflation, inequality and GDP with their respective moving averages.
Graph 1 - Unemployment Rates Graph 2 - Inflation Rates
0.02 0.03 0.04 0.05 0.06 0.07 0.08 0.09 0.10 Jun/ 80 Mai /81 Abr /82 Mar /83 Fev /84 Jan/ 85 Dez /85 Nov /86 Out /87 Set/ 88 Ag/ 89 Jul/90
Jun/ 91 Mai /92 Abr /93 Mar /94 Fev /95 Jan/ 96 Dez /96 No/ 97 Out /98 -0.10 0.00 0.10 0.20 0.30 0.40 0.50 0.60 0.70 0.80 0.90 Jun/ 80 Mai /81 Abr /82Mar/83Fev/84
Jan/ 85
Dez /85
No/ 86 Out/87Set/88
Ag/ 89 Jul/ 90 Jun/ 91 Mai /92 Abr /93Mar/94Fev/95
Jan/ 96
Dez /96
No/ 97 Out/98
Source: PME/IBGE Source: INPC/IBGE
Graph 3 – Inequality - Gini Index Graph 4 - GDP
Earnings) 0.55 0.56 0.57 0.58 0.59 0.60 0.61 0.62 0.63 0.64 Ju n/ 80 M ai/ 81 Ab r/8 2 M ar/ 83 Fe v/8 4 Ja n/ 85 De z/8 5 No v/8 6 Ou t/8 7 Se t/8 8 Ag o/ 89 Jul /9 0 Ju n/ 91 M ai/ 92 Ab r/9 3 M ar/ 94 Fe v/9 5 Ja n/ 96 De z/9 6 No v/9 7 Ou t/9 8 80.00 90.00 100.00 110.00 120.00 130.00 140.00 150.00 160.00 Ju n/ 80 M ai/ 81 Ab r/8 2 M ar/ 83 Fe v/8 4 Ja n/ 85 De z/8 5 No v/8 6 Ou t/8 7 Se t/8 8 Ag o/ 89 Jul /9 0 Ju n/ 91 M ai/ 92 Ab r/9 3 M ar/ 94 Fe v/9 5 Ja n/ 96 De z/9 6 No v/9 7 Ou t/9 8
Source: CPS/FGV based on PNAD-IBGE Source: Central Bank
. The vertical lines of Graphs 1 to 4 above divide the series into eight sub-periods that
will be analyzed in separate below:
The “voluntary adjustment” period (1981/1982) occurred right after the 1980
consumption boom, when the government tried, through a very tight monetary policy and a
rise of tariff and non-tariff barriers, to clear the trade balance and to reduce the rate of
inflation. The first objective was accomplished (thanks to a fall of imports), but this was not
of the increasing burden of the interest on the external debt, while the rate of inflation
remained roughly constant. In other words, the aggregate demand contraction affected
quantities more than on prices: for the first time in its statistically documented economic
history, Brazil recorded, in 1981, a negative growth rate of its GDP. The result of these
policies relation, in social terms, was the beginning of an increment in poverty and inequality
that would persist for the next three years.
The period of agreements with the IMF (1983/1984), during which the policy
described above were added significant cuts of public expenditures, a “regressive” wage
policy and a substantial devaluation of the domestic currency in real terms. This shift of
relative prices, the reduction of aggregate demand and the concomitant recovery of the world
economy allowed exports – especially those of manufactured goods – to grow significantly,
while the imports did not increase. The trade surplus became big enough to clear the current
account of the balance of payments, but the devaluation also implied a strong acceleration of
inflation, which reached 200% in annual terms. The output at first decreased, but from
mid-1984 it started to grow, thanks to the strength of manufactured exports. The rise of both
inflation and unemployment rates during this period produced an increase in poverty and
inequality of the income to new heights. The proportion of poor increased to 30%.
The first year of the “New Republic” (1985) represented an abandonment of the
agreements established with the IMF and the end of “orthodox” therapies to fight inflation.
The emphasis of the macroeconomic policy returned to growth issues and its anti- inflationary
component was bounded to an ephemeral attempt to delay public prices’ readjustments. The
rate of inflation continued on the same levels of the two previous years while the GDP growth
rate were similar to the average ones recorded during the 1970’s, without affecting the trade
surplus. The social indicators based on income begin to show a reversion in relation to the
peaks earlier reached.
The Cruzado Plan (1986), which can be seen as an attempt of combining the fight
against inflation with GDP growth and income redistribution. This “heterodox” experiment
was based on a monetary reform, the freezing of prices and of the nominal exchange rate and
on rather expansive fiscal and monetary policies. Its results were very good in the short-run:
the rate of inflation was drastically reduced and the GDP growth rate was preserved in very
generated a consumption bubble and rationing on the product and on the currency markets
that produced a progressive erosion of trade surpluses. After few months, the Brazilian
government had to give up the fixed exchange rate regime adopted, generating a chaotic
inflation “come back”2. During this period of economic expansion, inequality decreased, and
the consequence was that the proportion of poor reached the lower level of the whole series:
17%.
The agony of the New Republic (1987-1989), when the basic goal of the
policy-makers was to avoid hyperinflation at any cost. Two stabilization plans were implemented
during this period (the “Bresser” and the “Summer” plans), both also adopted heterodox
elements (such as temporary price- freeze) but were incapable to put an end to the fiscal
voracity of the “new regime”. The current account of the Balance of payments was rapidly
cleared (despite of the fact that the real exchange rate did not return to the levels recorded
before the Cruzado plan), while GDP growth diminished considerably. Given the increasing
public expenditures in a moment where the government’s credibility was particularly weak,
these plans were ineffective to contain the rate of inflation for more than a few months. This
process culminated in an inflationary explosion at the end of 1989/beginning of 19903. The
combination of a substantial increase in inequality with the maintenance of aggregate rates of
positive growth in the stability of the period caused a continuous, but until certain point,
moderate increase in the proportion of poor that reached 21% in the peak of the hyperinflation
in the 1989 presidential elections.
The Collor plan (1990/1992), attempted for the first time in Brazil to combine a
stabilization attempt with substantial structural reforms. While on the anti- inflationary front
the main measures were a new price- freeze, the confiscation of 80% of the private financial
wealth included in M4 and an attempt to end to any formal wage-policy for the formal
workers, the structural adjustment package was - in practice – restricted to a substantial trade
reform and to a shy attempt of privatization.4 This policy resulted in a recession deeper than
the one recorded the years before (thanks to what trade liberalization did not provoke a new
current account deficit), combined with an unexpected sharp reduction of income inequality.5
2 See Winograd (1991) for more details.
3 The monthly rate of inflation reached more than 80%.
4 The non-tariff barriers were abolished and “tarifficated”, while the average tariff was progressively reduced. The average import-tariff went from 51% in 1990 to 14% in 1993 .
Nevertheless, the poverty ratio almost doubled the level observed in 1986, reaching 32%. The
gradualism of the last year of Collor government (1992), consisting in the combination of
“de-confiscation” of private financial wealth with a very conservative aggregate demand
managing policy, the protraction of trade openness and external debt re- negotiation, whose
results were a progressive fall of the rate of inflation, the deepening of the recession and
significant short-run speculative capital inflows; The social indicators keep the same trend of
decreasing in inequality and increasing poverty.
The “bread and butter policy” (1992-1994) a pale attempt of the first Finance
Ministers of Itamar Franco’s government to recover GDP growth in an environment of not
only very high but also increasing rates of inflation; The poverty and inequality exploded
reaching the highest levels of the series since 1980.
The period of the Real Plan (1994-96), the most successful stabilization policy
implemented in Brazil since the mid-1960’s. Taking advantage on the previous structural
reforms (trade liberalization, renegotiations of the external debt and the launching of the
privatization program), the plan was divided in 4 steps: a) preparatory fiscal reordering; b)
adoption of a “super- indexator” (the Real Value Unity -- URV) in which all contracts should
be progressively converted; c) the implementation, in July 1994, of a new currency (the Real)
with a one to one parity towards the URV; and d) the deepening – through a large and
difficult political negotiation still in progress – of structural and institutional reforms, as
further privatization, the end of state- monopolies in some areas, the reform of the social
security system, etc., to recover sustainable growth. The first results of this strategy were an
acceleration of GDP growth, with strong increases in real wages (particularly of the lowest, in
the informal and non-tradable sectors) and a rapid deterioration of trade balance due to an
exponential increment of imports. Almost simultaneously, capital inflows were sharply
reduced by the tequila effect. The risk of a balance of payments collapse obliged the
government to adopt a tight monetary policy and to increase some tariffs to diminish the
rhythm of imports growth. As a consequence, GDP growth was significantly reduced in the
second half of 1995. The Mexican crisis was the first external shock that were to condition
the performance of the Brazilian economy in the near future.
The effects of the waves of external shocks that hit Brazil in the 1996-99 period such
triggered important changes in macroeconomic and social regimes such as: i) the adoption of
floating exchange rates; ii) the adoption of inflation targets; iii) the implementation of the law
of fiscal responsibility (Lei de Responsabilidade Fiscal (LRF)) affecting all government
levels and state enterprises alike; iv) more recently, the adoption of the Projeto Alvorada
which comprises a series of socia l programs combining compensatory and structural
components starting at the municipalities with lower levels of the Human Development
Index. The social effects of these police innovations seems quite important but cannot be
assessed at this point due to lack of data availability.
2.2. Overview of income distribution in the nineties
We shall work here with income distribution in a statistical sense, including changes in
inequality as well as growth in per capita family income. The analysis performed will be
desegregated in three groups: the upper ten percent of the population that has nearly half of
total income (47.3% to be precise); the lower half of the population that has slightly more
than ten percent of the national income (12.3%) and the remaining 40% of the population.
The latter can be perceived as a middle class - where population and income shares almost
coincides (40.4%), a kind of a middle income country, like Peru, between a rich Belgium and
a poor India6. Graph 5, below, shows the average family per capita income, of these three
segments of the Brazilian population.
This desegregated approach contrast with that based on the GDP, where the weight is
proportional to the income of earned by each individual –he is worth what he earns. This
aspect is basic in the Brazilian case, where high inequality makes average income an
untrustworthy indicator of social welfare.
We have divided the nineties analysis in three phases, of three years each: i) chronic
uncertainty (1990 – l993} ii) post-stabilization boom (1993 – 1996) iii) critical uncertainty
(1996 – 1999).
CPS/FGV based on micro-data from PNAD-IBGE CPS/FGV based on micro-data from PNAD-IBGE
Graph 5 Graph 6
Income level by income groups 1999 (Reais)
246.9 247.8
1,097.8
62.3 0
200 400 600 800 1000 1200
Total
50-India
40 Peru
10+ Belgium
Per Capita Annual growth rate by income groups
-2.0
7.4 9.3 7.0
0.8
-2.4 -3.3 -2.5
-4.4
-10.0 -5.0 0.0 5.0 10.0
50- 40 10+
i) – Chronic Uncertainty (1990 –1993)
There was a period before the “Real Plan”, that we call “The chronic uncertainty
phase” when the population was accustomed to cope with high instability, derived from high
and volatile inflation rates. Individuals and institutions developed a series of mechanisms to
protect against inflation which; the main side effect was to perpetuate inflation itself.
This phase encompasses two periods of the nineties, as seen in graph 7. The first from
1990 to 1992, in the Collor administration, when we observe an upside-down “Brazilian
economic miracle of the sixties”. Income fell sharply affecting mainly the richer class, 11.8%
against 4.4% per annum for the poorer class. Collor reduced inequality, by bringing the richer
class to a lower level of income.
The second period (1992/93) is marked by the rise of income in all income classes, but
also in this case more significantly amongst the richer class, 16.2% against 3% for the poorer
segment. – Thus generating a higher concentration of income.
ii) Post-stabilization boom (1993-1996)7
This phase can be called the “ Real plan honeymoon”. All segments of the population
gained income increases of 8% per annum. The chronic uncertainty was withdrawn from the
economy in a very fast manner, generating very important welfare gains and bringing a social
welfare euphoria that lasted up to the end of 1996. The synoptic chart shows the main effects
of the Real Plan on economic inequality, growth, and social welfare (or poverty).
The inequality reduction effect in the Real Plan was relatively mild. The stabilization
plan that preceded it and the Real Plan itself, were conceived to reduce inflation, maintaining,
more or less constant, the "status quo” of income distribution. It can be said that the Real Plan
main purpose was to fight inflation and it succeeded in this task. The gain in social welfare
6 The Belindia alphorism was introduced by Edmar Bacha in 1972.
7 See Neri e Considera (1996), Amadeo e Neri (1999) e Neri, Considera e Pinto (2000). Prepared by CPS/FGV based on micro-data from PNAD-IBGE Prepared by CPS/FGV based on micro-data from PNAD-IBGE
Graph 8 Graph 7
Per Capita Annual growth rate by income groups
-2.0 -4.4 -8.6 -11.8 -3.3 -4.4 16.2 4.6 3.0 -15.0 -10.0 -5.0 0.0 5.0 10.0 15.0 20.0
50- 40 10+
93/90 92/90 93/92
Per Capita Annual growth rate by income groups
4.7 7.4 9.3 7.0 4.5 3.1 0.8 -2.4 -2.5 -4.0 -2.0 0.0 2.0 4.0 6.0 8.0 10.0
50- 40 10+
induced by stabilization that was not a reduction in inequality, but as its name itself suggests
the increase in income stability.
With the Real Plan and the reduction of inflation, we observed a gain in social welfare,
associated with a smaller incidence of inflation tax, especially in the lower income groups.
Simulations of these effects show a rise of 10% in the income of those that do not have access
to sophisticated financial mechanisms and a 5% drop in poverty. This is a specific effect of
stabilization, but it only explains a small part of the social gains observed after the Real Plan
A second effect refers to the type of stabilization brought by the plan: the exchange rate was
pegged, the economy was opened to trade and a consumption boom took place. The measures
taken during the consumption boom were in a particular way, beneficia l to the non-tradable
goods sector, such as services, but adverse to the tradable- goods sector, such as
manufacturing. The services sector employs the largest portion of the working poor; therefore
there was a reduction effect on poverty. This explains why some regions, such as Rio de
Janeiro was benefited, whilst others suffered, such as São Paulo.
The third effect, the main connected to stabilization was the fall of uncertainty. In the
transition from chronic uncertainty to a stability period, there are direct social welfare gains
as a person can plan the future. Stabilization also increases the demand for credit (negative
savings) by the families that can behave less prudently as regards the future and feel freer to
increase consumption and to demand credit.
REAL PLAN SOCIAL IMPACTS DISTRIBUTIVE EFFECTS
GROWTH - EFFECTS
ILLUSORY EFFECT OF INEQUALITY
REDUCTION
GAIN OF SOCIAL WELFARE REDUCTION OF
UNCERTAINTY
INCREASE IN POLICIES POTENTIAL (i.e minimum wage) INCREASE OF THE
SUPPLY AND DEMAND CREDIT
REDUCTION OF PRECAUTIONARY
SAVINGS DROP IN THE
INFLATIONARY TAX
As a complement, banks and financial institutions tend to feel more secure in
monitoring potential borrowers. The reduction of uncertainty after the Real Plan lead – as
much for reasons of supply as of demand - to the flourishing of direct consumer credit.
The main gain of the Real Plan was to bring stabilization to the income of individuals.
We estimate this effect based on PME-IBGE data, that follow the same families over time and
we have concluded that the volatility of the monthly family income originated from labor, has
fallen 40% after stabilization was implemented8.
The effect of the reduction of volatility also causes an illusory effect of inequality
reduction. There was a perception that inequality dropped because the economy became more
stable, the inequality of monthly income – that is what is measured in Brazil – was inflated by
this fluctuation. If you have an economy where the income across individuals is the same, an
egalitarian economy by definition, but where income fluctuates in a non synchronized
manner, it wrongly appears that inequality is larger than it really is.
The reduction of these fluctuations causes a delusion in the redistribution effect of the
Real Plan. The inequality of monthly income falls three times more than the inequality of
income earned in the four consecutive month’s period and this difference corresponds
precisely to the effect of the fall of the temporal instability of income. In other words, it looks
like inequality tumbled but what really fell was income instability.
The distributive effects of the Real Plan were not large, but stability permitted the
possibility of implementing social policies in a largely better environment than before.
Firstly, because it spread the horizon of action for both government and private agents, that
includes enterprises and consumers. Stability and the end of the inflationary tax eased the
government and families to implement their budgets.
The Real Plan made feasible the implementation of social policies, but it can not be
perceived as a distributive policy itself. It is important here to distinguish “necessary” from
“sufficient” cond itions. The objective of the Real plan was not the redistribution of income,
but it ended causing an increase in potential to implement distributive policies. Therefore it is
senseless to discuss who is the author of the plan distributive benefits, as the y were still to
come.
The bulk (55.7%) of the reduction of poverty happened exactly in May 1995. The
observed reduction of 10.6% of poverty observed then seems related to the 43% in minimum
wage hike that occurred in the same month. The misconception seems to be the emphasis
given to the direct distributive effect of the Real Plan. The main gain is the improvement of
distributive policies as the May 95 minimum salary hikeexemplifies.
iii) Critical uncertainty (1996-1999)
During this phase, Brazil was exposed to external macroeconomic shocks. The nature of
the uncertainty perceived in this period is different from the day to day aspect felt during the
high inflation period. It is a phase of critical of uncertainty in the sense of acute crisis that was
still to come. Brazil started to live with the possibility of an economic decay such as those
observed in Asian and Russian economies, in September 1997 and October 1998,
respectively.
In aggregated terms there was the possibility of an economic shock of cons iderable
proportions. Individuals perceived the new danger of long periods of unemployment. We do
not speak of a succession of micro or macro economic shocks, as during the chronic inflation
period, but of the expectation on non-trivial shocks of an unexpected nature. The announced
crisis finally hit the Brazilian economy in January 1999.
The hinder result show that the poorer 50% had a slight absolute gain in income (0,8%
p.a.) in the 1996 to 1999 period, contrary to the wealthier segments (an income fall gain of
around 2.5% p.a.). In fact as graph 4 shows, the praised distributive aspect of the Real Plan
occurs not because of the boom that rose soon after the stabilization period (1993–99) but in
the period marked by external crisis (1996–99). This last phase will be studied in deeper
terms in the following sections.
3-Anatomy of the crisis (1996 – 1999) by city size
This section allows for a more detailed analysis of the labor market by six categories of
city sizes: rural area (up to 20.000 habitants; the urban area is divided into small urban area
(from 20.000 up to 50.000 habitants) middle sized urban area (from 50.000 up to 100.000
habitants) and large urban area (above 100.000 habitants up to metropolitan region) and the
metropolitan area sub-divided into core (the capital) and outer city areas (periphery). We
study here the evolution of measures of unemployment, informality, labor income, income
from all sources and poverty (Neri (2000a)).
3.1 – Unemployment:
The larger growth rates of unemployment in the 1996 - 1999 period are found in
larger urban (14.2% per annum). The rates of the unemployment found in these areas are also
higher (13.9%, 14.4% and 13.4%, respectively). These regions totaled 67.5% of the Brazilian
unemployed.
Table 1
3.2– Informality
The labor problem in Brazil is not restricted to the availability of work9 but should also
consider the quality of the work performed. We show as an alternative measure of the
precarious level of labor market, the estimated informality rate, summing the share of
self-employed workers, unregistered workers and non-paid workers.
The aggregated rate of growth of informality is much smaller, compared to the
unemployment rate (0.8% per annum against 12.5% per annum). However, similar to
unemployment, the deterioration is concentrated in cities bigger than 100.000 habitants. In the
rural and urban areas with less than 100.000, the informality is roughly stable. In 1999 these
regions contributed with 60.9% of total informality but only 32.4% of national
unemployment.
Table 2
UNEMPLOYMENT RATE
by city size (%)
Unemployment rate Annual rate of variation unemployment 99Contribution to
1996 1999
Total 6.9% 9.8% 12.5 100.0
Metropolitan Core 9.2% 13.9% 14.6 25.8
Metropolitan Suburbs 9.9% 14.4% 13.4 17.7
Urban Big 8.4% 12.4% 14.2 24.0
Urban Medium 7.3% 9.5% 9.3 14.9
Urban Small 6.0% 7.5% 7.9 10.8
Rural 2.2% 3.2% 13.2 6.8
Prepared by CPS/FGV based on micro-data from PNAD-IBGE
INFORMALITY by city size (%)
Informality rate Annual rate of variation Contribution to informality 99
1996 1999
Total 41.5 42.5 0.8 100.0
Metropolitan Core 32.5 35.4 3.0 14.0
Metropolitan Suburbs 35.0 36.2 1.1 9.3
Urban Big 36.4 37.5 1.0 15.7
Urban Medium 39.8 39.9 0.1 14.2
Urban Small 43.2 43.9 0.5 15.1
Rural 55.3 54.8 -0.3 31.6
Per Capita HouseHold from Income from all sources by city size (%)
P e r C a p i t a H o u s e h o l d A n n u a l r a t e o f v a r i a t i o n
Contribution to T o t a l I n c o m e 9 9
1996 1999
T o t a l 2 4 0 . 2 3 2 3 0 . 4 7 - 1 . 3 7 1 0 0 . 0 0 M e t r o p o l i t a n C o r e 4 1 4 . 9 6 3 7 6 . 4 6 - 3 . 1 9 2 8 . 8 4 M e t r o p o l i t a n S u b u r b s 2 4 5 . 9 0 2 2 2 . 9 4 - 3 . 2 2 1 1 . 8 7 U r b a n B i g 3 0 6 . 7 6 3 0 2 . 0 4 - 0 . 5 2 2 4 . 6 5 U r b a n M e d i u m 2 3 2 . 2 9 2 2 6 . 6 9 - 0 . 8 1 1 5 . 4 0 U r b a n S m a l l 1 5 1 . 1 1 1 5 4 . 4 8 0 . 7 4 1 0 . 1 5
R u r a l 9 7 . 6 8 1 0 2 . 3 0 1 . 5 5 9 . 0 8
P r e p a r e d b y C P S / F G V b a s e d o n m i c r o - d a t a f r o m P N A D - I B G E 3.3- Per capita family labor income
Per capita family labor income can be considered a synthetic measure of the labor
market behavior. Its aggregated variation rate is –2.79% per annum. We can synthesize the
regional dispersion of this evolution in three levels: i) Pronounced downfall: capital -4.66%
per annum and outer areas -4.41% per annum; ii) intermediary downfalls: middle sized urban
regions –2.29% per annum and small sized –2.37% per annum and; iii) stability: small sized
urban regions 0.01% per annum and rural regions 0.12% per annum.
Table 3
3.4- Per capita family income from all sources
The analysis based in total per capita income shows that alternative sources of income,
such as social security benefits, unemployment insurance, rents, interests, etc. show a better
performance in relation to the labor income rate shown in the several categories of city size.
The performance tends to drop in a monotonic manner as we go towards less densely
populated areas.
Table 4
3.5-Poverty
9 Captured by the measurement of involuntary unemployment in the above analysis.
PER CAPITA HOUSEHOLD INCOME FROM LABOR
Income from labor Annual rate of variation Total Income 99Contribution to
1996 1999
Total 195.80 179.87 -2.79 100.00
Metropolitan Core 328.89 284.99 -4.66 27.97
Metropolitan Suburbs 207.28 181.07 -4.41 12.35
Urban Big 252.28 235.35 -2.29 24.61
Urban Medium 191.44 178.15 -2.37 15.51
Urban Small 122.80 122.85 0.01 10.34
Rural 80.69 80.99 0.12 9.21
The analysis centered at the bottom end of the distribution of per capita income from all
sources through the proportion of the poor, shows a high dissimilarity of changes by size of
city. i) increase in cities of more than 100.000 population in particular in the metropolitan
core. ii) drop in all other cities, in particular in middle size cities
Table 5
3.6- Spatial correlation patterns
We make an analysis of the data of unemployment rates and per capita family income
for the Brazilian mesoregions for the period of 1998-99, taken as a whole. We opted to work
with PNAD´s data of two consecutive years, piled to to increase the sample density of our
estimates. This data were used as input to perform standard regression analysis10
Following, we performed similar regressions with the variation rates of these respective
statistics between the biannual periods of 1996-97 and 1998-99. In order to make the relation
between per capita family income from all sources and the other variables more explicit, we
turned out a series of simple regressions, following a logarithmic specification with a
constant.
i. The 1998-99 regression of unemployment rate against the per capita family income
shows a positive correlation pattern (elasticity equal to 0.75)
ii. The regression of the rate of variation of unemployment (in fact log of one plus the
variation rate) shows a positive relationship with the per capita family income for
196-97 (elasticity equal to .29)
10 The meso regions corresponds to the division established by IBGE
POVERTY by city size (%)
Poverty (P0) Annual rate of variation Contribution
1996 1999 to Poverty 99
Total 29.80 29.30 -0.57 100.00
Metropolitan Core 15.37 17.58 4.58 12.39
Metropolitan Suburbs 18.66 19.58 1.62 10.78
Urban Big 17.43 17.99 1.07 13.89
Urban Medium 25.55 22.94 -3.53 14.28
Urban Small 38.90 37.38 -1.32 18.43
Rural 56.64 54.54 -1.25 30.22
iii. The regression of the rate of variation of the family income derived from work against
initial level of income from all sources , shows a negative correlation (elasticity equal to
-1.18)11
iv. The regression of the rate of variation on family income from all sources against initial
level, shows a negative correlation (elasticity equal to –1.49)
Overall, the first regression does not allow us to reject the hypothesis that
unemployment is a “luxury bad”. Another thesis not refuted by the data is that the recent
crisis hit less harshly the poorer segment of the Brazilian population. This conclusion is
robust to alternative measures such as changes of unemployment, of the labor income and of
income from all sources.
Graph 9 Graph 10
Graph 11 Graph 12
11
Considering the possibility that the rates of variation showing negative values, we used the logarithmic of one plus the variation rate)
Per Capita Holsehold Income From All Sources Vs. Unemployment Rate
(Log)
Coefficient : 0.755 Statistic-t : 8.587
- 4 . 7 5 -4.5 - 4 . 2 5 - 4 - 3 . 7 5 -3.5 - 3 . 2 5 - 3 - 2 . 7 5 -2.5 - 2 . 2 5 - 2 - 1 . 7 5 4.5
5 5.5 6
Variation of Per Capita Household Income From Labor Vs. Per Capita Household Income From All Sources
(Log)
Coefficient : -1.185 Statistic-t : -3.316
4.2 4.4 4.6 4.8 5 5.2 5.4 5.6 5.8 6
Per Capita Holsehold Income From All Sources
Vs. Variation Per Capita Household Income All Sources
(Log)
Coefficient : -1.486 Statistic-t : -3.807
4.2 4.4 4.6 4.8 5 5.2 5.4 5.6 5.8 6 -.2
-.1 0 .1 .2
Unemployment Variation Vs. Per Capita Household Income From All Sources
(Log)
Coefficient : 0.295 Statistic-t : 2.563
4.2 4.4 4.6 4.8 5 5.2 5.4 5.6 5.8 6 -1.5
4- Collateral Effects of the crisis (1996 – 1999)
In section 7, we shall analyze the possible channels through which economic reforms
may affect different segments of the Brazilian population. As much as in section 5 an
analysis was made of the recent external crisis, from 1996 to 1999. We go on to analyze of a
few consequences of this crisis period.
4.1– Violence
There is a general perception that the recent economic crisis and consequently the
increase of unemployment, reflects in an increase of criminality, especially in urban and
metropolitan areas, where the problem of violence is greater. The rate per one hundred
thousand habitants of hospital internment as victims of aggression in Graph 13 shows a strong
increase of this rate in cities of all sizes, in particular in middle sized urban centers and
metropolitan core. The exceptions are the outer metropolitan areas (periphery).
This is due to the migration of infirm people to other cities, specially the capital that
has a considerable concentration of large hospitals. Thus, the measure of the phenomenon in
affected by this migration, which contributes for the increase of the statistics in the
metropolitan core.
Firstly, we can observe that rural and small size urban areas are less violent than the rest
of the country. According to this indicator, the capital is the most violent area. In this region
the rate of hospital internment for aggression, corresponds to 11 per 1.000 habitants in 1999
(graph 13), a considerable figure, considering that this is at least twice the rate observed for
any other of the remaining city sizes. The rural and middle size urban areas show a worrying
increase in violence figures, specially given land conflicts present in rural areas.
4.2- Elections:
The results of the municipal elections of 2000 are good thermometers of the population
reaction to the crisis in different cities. We have used the different stands of the parties in Prepared by CPS/FGV based on micro-data from PNAD-IBGE Prepared by CPS/FGV based on micro-data from PNAD-IBGE
Graph 13 Graph 14
Brazil : Moviment Hospitable Internation by agression by city size
0 2 4 6 8 10 12
Metropolitan Core Metropolitan
Surburbs
Urban Big Urban Medium Urban Small Rural
Incidence ( per 1000 hab.)
97 99
Brazil : Moviment Hospitable by agression by city size
0 1 2 3 4 5 6 7 8
Metropolitan Core Metropolitan Suburbs
Urban Big Urban Medium Urban Small Rural
Incidence ( per 1.000 hab)
congress, to divide the political parties into three broad groups: pro-government, opposition
and independent.
In Graph 15, showing the horizontal composition of votes for mayor and town
councilors in the first round of 2000 referendum, we have noted that 70.76% of the opposition
votes and 60.94% independent votes were counted in cities of over 100.000 population,
against 44.27% of the government base votes. This situation also covers the periphery,
considered the poorest and tending to vote for the opposition, as they are “opponents by
situation”.
The vertical analysis of voting by city size is more revealing of the bad pro-government
election performance in the metropolitan city cores. Whilst pro- government votes reaches
82% in the small urban and rural areas and follows a downturn path as we move towards
larger cities. reaching around 58% in outer and core areas of bigger cities. The relative
participation of the opposition takes an upturn path from 9.5% in small urban and rural areas,
to a level of 29.5% in the outer areas and in the core of metropolitan areas:
In sum, the democratic reaction of the population in the 2000 election is consistent with the
interpretation that the epicenter of the external crisis that preceded them occurred in the larger
urban areas.
5- Possible Causes of the crisis (1996 – 1999)
Now we show an impressionistic analysis of the measures of sensibility in relation to
the liberal reforms agenda, proposed by the government. We try to point out the main gainers
and losers of these reforms, by city size.
This type of data engenders retrospective interpretations of certain crisis. For instance,
as the comparison of percentage of public serva nts between 1996 and 1999, that allows us to
evaluate the effects of the administrative reform. Another possibility, that will not be
considered here, is a prospective analysis of the reforms yet to come. Such as the trade unions
Prepared by CPS/FGV based on micro-data from PNAD-IBGE Prepared by CPS/FGV based on micro-data from PNAD-IBGE
Graph 15 Graph 16
Brazil - Total of votes in the first round of 2000 elections by political position according to city size (horizontal
composition)
17.70%
11.47% 23.66%
29.04%
18.12% 19.34%
30.91%
16.01% 28.72%
17.51%
6.85% 6.86%
0 0.1 0.2 0.3 0.4
Metropolitan Core Metropolitan Urban Big Urban Medium Urban Small Rural
Government Oposition
Brazil - Total of votes in the first round of 2000 elections by political position according to city size (vertical composition)
57.02% 59.26% 60.30%
74.23%
81.47% 82.42%
32.11%
26.66% 23.60%
14.43%
9.93% 9.42%
0 0.2 0.4 0.6 0.8 1
Metropolitan CoreMetropolitan Urban Big Urban Medium Urban Small Rural
law changes, precluded in the labor law reforms yet to come. We must remind that Brazil is a
late comer in implementing structural reforms in the continent.
5.1- Administrative reform:
As graph 17 shows during the 1996-1999 period, there was a reduction in the
proportion of public servants among the occupied population in cities of all sizes, with the
exception of the periphery, that presented a stable 9.8% figure and rural areas that presented
sharp increment (from 4.4% in 1996 to 5.4% in 1999). The larger decreases of the public
servant sharks was felt in the metropolitan core (from 14.5% in 1996 to 12.8% in 1999) and
cities with a population over 100.000 (from 14.6 in 1996 to 13.5% in 1999).
These movements point to a larger uniformity in the percentage of public servants by
city size. Still, a prospective analysis of actions of the administrative reform show smaller
effects in rural areas and is in the periphery of metropolitan areas.
Next graphs present this statistic open in three government spheres: Federal, State and
Municipal. respectively. Graph 18 shows that the percentage of federal public servants falls in
all cities with a population above 50.000. The imposing of a linear “drying up” process of the
number of federal servants, would be stronger felt in the denser populated centers. This
statistics follow a downturn path as we go towards the smaller cities (the periphery being the
exception).
When we look at the State public servant panel, the format is quite similar to the federal
sphere. In the 1996-99 period the drop is generalized in cities of all sizes, more noticed in the
metropolitan cities (from 7.3% in 1996 to 6.2 in 1999) and smaller drops n the periphery and
rural areas, as observed in the federal sphere.
The pattern observed as regards municipal public servants differ considerably from the
pattern of the other two public pheres. We note increments or stability of these proportions in
all city sizes. In terms of levels, found in 1999 at follows the upwards path by city size, from Prepared by CPS/FGV based on micro-data from
PNAD-IBGE Prepared by CPS/FGV based on micro-data from PNAD-IBGE
Graph 17 Graph 18
0.0 5.0 10 . 0 15.0 20.0 25.0
Centro-Oeste Nordeste Norte Sudeste Sul
96 99 0.0 10.0 20.0 30.0 40.0 Salvado
r Fortaleza Belo Horizonte Belém Recife Curitiba Rio de Janeiro Porto Alegre São Paulo Distrito Federal
96 99
% Public servants
14.5 9.8 14.6 12.7 15.6 4.4 12.8 9.8
13.5 12.4 15.1
5.1 0 5 10 15 20 Metropolitan Core Metropolitan Surburbs
Urban Big Urban Medium Urban Small Rural
96 99 0.0 1.0 2.0 3.0 4.0 5.0
Centro-Oeste Nordeste Norte Sudeste
96 99 0.0 5.0 10.0 15.0 20.0 Salvado
r Fortaleza Belo Horizonte Belém Recife Curitiba
96 99
% Federal Public servants 4.5 2.1 3.2 2.1 1.0 0.4 3.9 1.7 2.6 1.6 1.1 1.0 0 1 2 3 4 5 Metropolitan Core Metropolitan Surburbs
Urban Big Urban Medium Urban Small Rural
2.7% of the employed in the metropolitan capitals to 8.9% in the urban areas from 20.000 and
50.000 population and dropping to 3% in rural areas.
5.2- Labor reform
Trade Unions
The Brazilian trade unions are not well organized as the monopoly of representation is
in the hands of the laborers and also because it is financed by a compulsory contribution taken
from labor income, there is no incentive to protect workers interests.
In the proposed labor reform the monopoly of representation is extinguished as well as the
obligatory contribution, allowing the constitution of trade unions to which the worker can
freely choose to join.
From the 96 to 99, it can be perceived a reduction in unionized active workers in the
metropolitan capitals (from 10.1% to 8.5%) and periphery (from 8.0% to 6.6%) Stability in
the large urban areas (8.5%), medium sized (6.3%) and small (5.1%). The opposite occurs in
the rural areas, a growth from 7.6% to 8.6%, that would be the biggest degree of unionizing
amongst the categories of size of cities observed. The process reflects a large degree of
formalization and mobilization in rural areas, within the less qualified laborers. (for example:
the landless rural movement (MST))
Domestic servants
Another part of the proposed labor reform and that is going ahead, concerns the
extension to domestic servants of the labor law rights. This change can cause two opposite
effects. On one side the dismissal of domestic servants, considering the additional labor costs
and on the other side an increase of the feeling of security and satisfaction, of those that keep
their jobs.
Prepared by CPS/FGV based on micro-data from PNAD -IBGE Prepared by CPS/FGV based on micro-data from PNAD-IBGE
Graph 19 Graph 20
0.0 2.0 4.0 6.0 8.0 10.0
Centro-Oeste Nordeste Norte Sudeste Sul
96 99 0.0 5.0 10.0 15.0 20.0 Salvado
r Fortaleza Belo Horizonte Belém Recife aCuritib Rio de Janeiro Porto Alegre São Paulo Distrito Federal
96 99
(%) State - Public servants
7.3 4.0 7.3 5.4 5.7 1.3 6.2 3.9 6.6 4.8 5.1 1.1 0 1 2 3 4 5 6 7 8 Metropolitan Core Metropolitan Surburbs
Urban Big Urban Medium Urban Small Rural 96 99 0.0 1.0 2.0 3.0 4.0 5.0 6.0 7.0
Centro-Oeste Nordeste Norte
96 99
(%) Municipal - Public se rvants
2.7 3.7 4.2 5.3 8.9 2.8 2.7 4.2 4.4 5.9 8.9 3.0 0 2 4 6 8 10 Metropolitan Core Metropolitan Surburbs
No significant changes were noted in the relative level of occupation of domestic
servants during his period, that keeps a steady level between 7.5% and 9.5% in cities of
different sizes and half this level in rural areas.
5.3– Trade Opening
The employment effect of the commercial opening of the Brazilian economy can be
seen, in a perfunctory way, by the impressive drop of participation of laborers in the so called
tradable sectors, in cities of several sizes. In order not to go into too much detail, we divided
this sector into two groups: industry and agriculture.
In the manufacturing sector, we observe a considerable drop in the periphery (from 21.4
in 1996 to 18.8% in 1999), in metropolitan core (from 13.6% in 1996 to 12.1% in 1999) and
cities with a population of over 100.000 (from 15.5% in 1996 to 14.6% in 1999). In
lesser-populated areas the changes are not impressive. The only area that shows a growth pattern is
the small urban area 13.6% to 14%).
In agriculture, we observed a symmetric movement in relation to that reported in the
industrial sector. Relative stability in the relative occupation in the densely populated areas,
where this activity is less relevant and sharp drops in the other areas: rural areas (from 16.7%
in 1996 to 15.8% in 1999), small cities (from 11.2% in 1996 to 10% in 1999) and middle
sized cities. (from 5.6% in 1996 to 5% in 1999) The ever- increasing mechanization of the Prepared by CPS/FGV based on micro-data from PNAD -IBGE Prepared by CPS/FGV based on micro-data from PNAD-IBGE
Graph 21 Graph 22
% of Domestics servants By city
size
7.8 9.1
8.5 8.8 8.1
3.9
8.4 9.3 8.4 9.1
7.6 4.0 0 2 4 6 8 10
Metropolitan CoreM e tropolitan Surburbs Urban Big Urban Medium Urban Small Rural
96 99 0.0 2.0 4.0 6.0 8.0 10.0 12.0 Centro-Oeste Nordest e Nort e Sudest e Sul 96 99 0.0 20.0
SalvadorFortaleza Belo
Horizonte
Belém Recife Curitiba Rio de
Janeiro
São Paulo
96 99
% of Unionized workers By city
size 10.1 8.6 6.4 4.9 7.6 8.5 6.6 8.5 6.3 5.1 8.6 8.0 0 2 4 6 8 10 12 Metropolitan Core Metropolit anSurburb s Urban Big Urban Medium Urban Small Rura l 96 99
Prepared by CPS/FGV based on micro-data from PNAD-IBGE Prepared by CPS/FGV based on micro-data from PNAD-IBGE
Graph 23 Graph 24
0.0 5.0 10.0 15.0 20.0
Centro-Oeste Nordeste Norte Sudeste Sul
96 99 0.0 5.0 10.0 15.0 20.0 25.0 Salvado
r Fortaleza Belo Horizonte Belém Recife aCuritib Rio de Janeiro Porto Alegre São Paulo Distrito Federal
96 99
% of Laborers in Manufacturing
13.6 21.4 15.5 15.6 13.6 7.8 12.1 18.8 14.6 15.5 7.9 14.0 0 5 10 15 20 25 Metropolitan Core Metropolitan Surburbs
Urban Big Urban Medium Urban Small Rural 96 99 0.0 0.5 1.0 1.5 2.0 2.5 3.0 Salvado
r Fortaleza Belo Horizonte Belém Recife Curitiba Rio de Janeiro
96 99
% of Laborers in Agriculture
0.2 0.7 1.1
5.6
11.2 16.7
0.1 0.6 1.0
5.0 10.0 15.8 0 5 10 15 20 Metropolitan Core Metropolitan Surburbs
fieldwork and consequential reduction in labor demand, is intensified by the commercial
opening of the nineties.
5.4– Social security
The income participation of social security benefits in the income from all sources,
swung in 1999, by city size, between 8.9% in rural areas to 10.9% in the metropolitan capital.
A strong variation growth can be observed during the 1996-99 period in the cities of all sizes
and in particular in the periphery (from 7.8% in 1996 to 9.0% in 1999), large urban centers
(from 8.7% in 1996 to 9.9% in 1999) and rural areas (from 8.2 in 1996 to 8.9 in 1999).
This generalized growth in the social security income participation was caused by the
policy of increasing the concession of pensions, independent of previous contribution, the
increase in average value of received benefits and also by the reduction of income from labor.
Anyway, it can be observed that whilst the labor market presents a grave deficiency in its
capacity of generating income, the opposite can be seen in public programs, in particular in
social security.
In this period we saw the advent of a policy that differentiates the adjustment of the
minimum salary for the retired and pensioned laborers by level of income, applied in 1999
and 2000. The impact of progressive readjustments of social security income, tends to favor
the less populated areas. The participation of the pensioner that receives exactly one
minimum salary grows in an upward path from 27.3% in metropolitan capital until it reaches
its peak of 87.6% in rural areas.
5.5 - Minimum wage reform:
The traditional effects of the minimum salary policy can be captured by the proportion
of active workers that earn exactly one minimum salary (Neri, Gonzaga and Camargo
Prepared by CPS/FGV based on micro-data from PNAD-IBGE
Prepared by CPS/FGV based on micro -data from PNAD-IBGE
Graph 25 Graph 26
% of Retired earning 1 minimum salary 21. 9 27. 8 34. 0 50. 3 64. 5 79. 4 27. 3 37. 6 39. 5 55. 9 76. 0 87. 6 0 20 40 60 80 10 0 Metropoli tanCor e Metropoli tanSurbur bs Urban Big Urban Medium Urban Small Rura l 96 99 0.0 2.0 4.0 6.0 8.0 10.0 12.0
Centro-Oeste Nordeste Norte Sudeste Sul
96 99
0.0 5.0 10.0 15.0
Salvador Fortaleza Belo Horizonte Belém Recife Curitiba
96 99
Participation(%) of social security benefits in all sources of
income by city size
10. 1
7.8 8.7
9.2 10.0
8.2 10.
9
9.0 9.9 10.0
10. 6 8.9 0 2 4 6 8 10 12 Metropolitan CoreMetropolitan Surburbs
Urban Big Urban Medium Urban Small Rural
(2001)). In general the readjustment of the minimum salary has a larger impact in the small
sized urban areas (8%) and middle size, in comparison to the other regions in particular in
both ends of the city size, 4.6% in the capitals and 4.7% in rural areas.
The next step is to add to the active worker that earns the minimum salary, those that
earn exact multiples of the minimum salary, that is, workers that earn a salary indexed to the
minimum salary. The impact index grow but does not change the quality of the profile of its
relative incidence larger impact in small and middle size cities.
It should be noted that the effectiveness of the minimum salary in the labor market,
specially the numeraire effect, allied to the policy of progressive readjustment of social
security benefits, coupled with the new law, as regards regional levels of minimum salary will
determine differentiated impacts, in relation to the patterns observed during the nineties.
6 -Unemployment crisis 6.1- Concepts
If we tried to synthesize the debate on the Brazilian contemporary social situation on a
day to day basis, using only one variable, this variable would no doubt be the unemployment
rate calculated for metropolitan areas. This section supports the use of alternative measures to
describe the performance of the labor market.
Firstly, we calculated the unemployment at a national level, processing the National
survey by household sampling (PNAD). It is shown a large geographic dispersion of the
recent changes in unemployment and other social indicators within the national boundaries.
Secondly, emphasis is given to social welfare measures based on per capita household income
derived from labor, that is the sum of labor income of all members of the household, divided
by the number of family members. We argue in favor of this last concept for it condenses a
series of operating factors on the labor of all members of the household, such as the level of
occupation and income gained by formal or informal workers.
Apart from the power of synthesis, this statistic can be calculated from the same
surveys used to reckon the monthly unemployment rate. Another advantage of this concept is
that it allows a more direct connection with elements of social welfare literature such as
poverty. The increase of the unemployment rate is the main problem perceived by the
population, as public opinion polls in the last few years’ show. 12
12
There are two traditional criterions for measuring unemployment in Brazil. On one
hand, we have the open unemployment survey, based on the Monthly Employment Survey
(PME) elaborated by IBGE for the six main metropolitan areas. On the other hand there is the
rate of unemployment rate, based on the Employment and Unoccupied Survey (PED) from
SEADE Foundation covering São Paulo City and aggregated counties (greater São Paulo).
The first survey shows unemployment as a measure of “slackness” in the labor market (excess
supply of labor).
An advantage of the PME concept is that it is compatible with international conventions
determined by OIT. The second statistic, adopted in PED, adds the discouraged
unemployment and the precariously employed to its concept of unemployment. Its advantage
is that the considered measure has a broader social dimension.
6.2-National Unemployment
Here we emphasize the data on unemployment at national level, originated from the
National Survey by Household Sampling (PNAD). We analyze the external crisis period,
between October 1996 and October 1999. The unemployment rate in the 15 to 65 years age
groups, increases from 6.9% to 9.8%. The additional 2.9% corresponds to an increase of
12.5% p.a., approx. 2.5 million individuals joined the 4.7 millions unemployed existing in
1996.
6.3-Unemployment in the Upper Class
Here we analyze the unemployment evolution in the higher purchasing power classes.
As the current family income is directly affected by unemployment, we used here a concept
of social class that is less dependent on current family income. The surveys, of consumers’
attitudes and behavior frequently implemented, include concepts of social classes based on
measures of access to consumer goods.
We use here, as an indicator of upper class the fact that the individual belongs to a
household that has access to the following goods, included in the PNAD questionnaire
refrigerator, television, freezer and washing machine. Approximately, 20.7 million people are
within our definition of upper class. First, it should be noted that this segment of the
population was 2.5% according to PNAD. That means that the international crisis phase was
not marked by the stagnation of demand for consumer goods, rather the opposite.13
6.4-Zoom in the metropolitan crisis
The basic source of information used in Brazil on social behavior, are the market
surveys on the labor market, which is circumscribed to the six main metropolitan regions,
such as the PME-IBGE. These regions represent around 30% of the population and are quite
different from the rest of the country, with 42.5% larger per capita incomes. Another
shortcoming of these surveys is they cover only income derived from labor, ignoring other
sources of income, such as rents, interests and dividends and monthly income derived from
public policies (social security benefits, unemployment insurance and other public transfers).
Despite these limitations, these surveys provide the guidelines to our social debate.
PNAD-IBGE allows us to amplify the focus of analysis of social indicators based on
income. Firstly because it covers practically all the country. Secondly, because it comprises
all sources of income of the several members of the household. The largest limitation is the
long lag found in its information diffusion process.
The last PNAD available implementation, October 1999, allowed us in July of 2000 to
capture the impact of the external economic shock waves on the welfare of the Brazilian
population, seen as a whole. Between 1996 and 1999, per capita household income14, deflated
by the INPC (Consumer price index) from IBGE, feel at a rate of 1.37% p.a..
The percentage of indigents fell 0.57% p.a., totaling 29.3% of the population, a total of
46 million poor or very poor people. It is a considerable figure, albeit it should be underlined,
poverty did not increase in the 1996-99 period, which is surprising considering how the
debate on the subject was lead.
The wideness of PNAD allows us to gradually restrain its scope to elements covered in
labor market surveys, monthly divulged. Firstly, reducing the indicators to the geographical
scope to cover only the metropolitan areas. Income has fallen 3.22% per annum and poverty
increased 1.85% per annum.
13
A alternative way of measuring the upper class should include the access to telephones, but the strong expansion of this service, after the privatization period, would deface the estimate. To a point, the opening process of the Brazilian economy causes a similar effect in the selected statistisc.
Table 6
Finally as we restrain the concept of income only to the labor in metropolitan areas,
poverty based only on labor in these six metropolitan areas has increased by 4.22% per
annum and income in this same universe fallen 4.6% per annum.
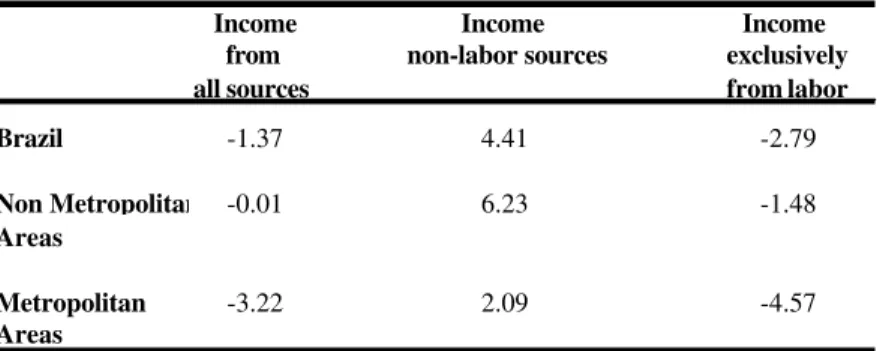
Table 7 confirms that the epicenter of the social crisis was concentrated on the labor
income earned in the metropolitan areas. The effects of the crisis were softened by the
increase in income, originated from alternative sources, in particular the non-metropolitan
areas.
In short, in the 1996-99 period when we used social indicators based on more agile surveys
on the labor market, as the PME-IBGE (PED-SEADE) we tend to over-estimate the
deterioration of the Brazilian conditions. The reason being that the wave of external crisis hit
in a stronger manner the metropolitan labor income (in particular, in Greater São Paulo) than
other sources of income in other geographical areas.
Table 7
Per capita (% p.a.) variation of income from 1996 to 1999
Income Income Income
from non-labor sources exclusively
all sources from labor
Brazil -1.37 4.41 -2.79
Non Metropolitan -0.01 6.23 -1.48
Areas
Metropolitan -3.22 2.09 -4.57
Areas
Prepared by CPS/FGV based on micro-data from PNAD-IBGE
Per capita average income POVERTY (PO*)
Rate variation Rate variation
1996-99 a.a. 1996-99 a.a.
Brazil Total
All sources 230.47 -1.37 29.3 -0.57
Labor 179.87 -2.79 41.01 1.31
Brazil Metropolitan
All sources 313.65 -3.22 17.65 1.85
Labor 242.55 -4.57 29.07 4.22
Prepared by CPS/FGV based on micro-data from PNAD-IBGE
* 76 Reais per person adjusted by differences in cost of living (see Ferreira et all/2000)
1999 Level Nivel 1999