BASIC RESEARCH
Lean diesel technology and human health: a case study
in six Brazilian metropolitan regions
Paulo Afonso de Andre´,I,IIIMariana Matera Veras,I,IIISimone Georges El Khouri Miraglia,II,IIIPaulo Hila´rio Nascimento SaldivaI,III
IFaculdade de Medicina da Universidade de Sa˜o Paulo, Departmento de Patologia, Laborato´rio de Poluic¸a˜o Atmosfe´rica Experimental(LIM05), Sa˜o Paulo/ SP, Brazil.IIUniversidade Federal de Sa˜o Paulo, Instituto de Cieˆncias Ambientais, Quı´micas e Farmaceˆuticas, Sa˜o Paulo/SP, Brazil.IIIInstituto Nacional de Ana´lise Integrada de Risco Ambiental – INAIRA, Sa˜o Paulo/SP, Brazil.
OBJECTIVE:Due to their toxicity, diesel emissions have been submitted to progressively more restrictive regulations in developed countries. However, in Brazil, the implementation of the Cleaner Diesel Technologies policy (Euro IV standards for vehicles produced in 2009 and low-sulfur diesel with 50 ppm of sulfur) was postponed until 2012 without a comprehensive analysis of the effect of this delay on public health parameters. We aimed to evaluate the impact of the delay in implementing the Cleaner Diesel Technologies policy on health indicators and monetary health costs in Brazil.
METHODS:The primary estimator of exposure to air pollution was the concentration of ambient fine particulate matter (particles with aerodynamic diameters,2.5mm, [PM2.5]). This parameter was measured daily in six Brazilian metropolitan areas during 2007-2008. We calculated 1) the projected reduction in the PM2.5 that would have been achieved if the Euro IV standards had been implemented in 2009 and 2) the expected reduction after implementation in 2012. The difference between these two time curves was transformed into health outcomes using previous dose-response curves. The economic valuation was performed based on the DALY (disability-adjusted life years) method.
RESULTS: The delay in implementing the Cleaner Diesel Technologies policy will result in an estimated excess of 13,984 deaths up to 2040. Health expenditures are projected to be increased by nearly US$ 11.5 billion for the same period.
CONCLUSIONS:The present results indicate that a significant health burden will occur because of the postponement in implementing the Cleaner Diesel Technologies policy. These results also reinforce the concept that health effects must be considered when revising fuel and emission policies.
KEYWORDS: Vehicular emission; Health costs; Environmental policies.
Andre PA, Veras MM, Miraglia SG, Saldiva PH. Lean diesel technology and human health: a case study in six Brazilian metropolitan regions. Clinics. 2012;67(6):639–645.
Received for publication onFebruary 7, 2012;First review completed onFebruary 22, 2012;Accepted for publication onFebruary 22, 2012 E-mail: pauloafonso@lim05.fm.usp.br
Tel.: 55 11 3061-7324
INTRODUCTION
Sanitation, immunization and antibiotics, and improved nutrition have increased life expectancy and dramatically changed the patterns of disease in many countries. Along with these benefits, however, development, including economic development, population growth, industrial development, urbanization, and increased use of motorized transportation, has been accompanied by global environ-mental deterioration, which poses a threat to current and
future human health, especially in developing and under-developed countries. Economic disadvantage (areas with low socioeconomic status) augments the deleterious effects of air pollution on human health, a situation designated as environmental inequity (1). Environmental quality has been considered to be dependent on regional characteristics, among which social and economic factors play a pivotal role (2,3). Environmental disparities may increase as the result of the expansion of the interest of the automotive industry, predominantly diesel engine manufacturers, in the growing markets in Latin America, Africa, and Asia, where environ-mental and health policies are not strongly consolidated (4). Due to their high toxicity, diesel emissions have been subjected to increasingly restrictive regulations over the last several decades at a cost of higher investments in fuel (low sulfur content) and engine technologies in developed countries (5). Sulfur is a naturally occurring component of crude oil and is found in both gasoline and diesel. When
Copyrightß2012CLINICS– This is an Open Access article distributed under
the terms of the Creative Commons Attribution Non-Commercial License (http:// creativecommons.org/licenses/by-nc/3.0/) which permits unrestricted non-commercial use, distribution, and reproduction in any medium, provided the original work is properly cited.
these fuels are burned, sulfur is emitted as sulfur dioxide (SO2) or sulfate particulate matter (6).
Since 1993, the European Union (EU) has established standards to regulate the quality of automotive fuels and vehicle emissions to combat the atmospheric pollution caused by emissions from motor vehicles. A series of directives resulted in the progressive introduction of increasingly stringent standards (EURO standards) that define the acceptable limits for exhaust emissions of vehicles sold in EU member states (7).
Unfortunately, the benefits of cleaner technologies are lagging in less developed regions. In the USA, trucks sold after 2007 emit 0.01 g/bhp-hr1PM, and in Germany, trucks can emit only 0.02 g/kWh2 (defined in the EURO V
standard). In contrast, in Brazil, India, and China, the allowed level of emissions is 0.1 g/kWh PM (EURO III standard) (8). These differences in emissions standards mean that heavy-duty diesel engines produced by the same manufacturer emit markedly different levels of pollutants depending on the regional market in which the engines are sold. Economic issues have been evoked to support the aforementioned ‘‘regulatory differences’’ in environmental emission standards. The trade-offs associated with these regulatory differences are relevant to the situation in Brazil because the implementation of a policy requiring cleaner diesel technologies (CDT; Euro IV standards for vehicles produced in 2009 and low sulphur diesel; diesel with 50 ppm of sulphur) was postponed until 2012 without a comprehensive analysis of the health consequences (9).
To evaluate the health impact of the decision to delay implementation of the CDT policy, we estimated the monetary health costs of the non-abatement of ambient PM2.5 emissions due to this postponement in Brazil.
MATERIALS AND METHODS
Air pollution analysis and emission source determination. We selected fine particles (particles with aerodynamic diameters less than 2.5mm – PM2.5) as the estimator of exposure to air pollution. Diesel emissions contribute significantly to ambient PM2.5 concentrations in urban areas, and this class of pollutant exhibits a robust association with adverse health effects, especially lung cancer and cardio-respiratory diseases (10,11).
During 2007-2008, we performed daily measurements of the ambient levels of PM2.5 in six Brazilian metropolitan regions: Curitiba, Sa˜o Paulo, Belo Horizonte, Rio de Janeiro, Recife, and Porto Alegre. These cities have a combined population of 46,811,100 inhabitants (25% of the Brazilian population) and generate 37.3% of the country’s Gross National Product (12,13).
The daily concentration of particulate matter (PM2.5) was obtained by a gravimetric method using a Harvard sampler with a PM2.5 impactor (Air Diagnostics and Engineering Inc., Harrison, ME, USA) at a flow rate of 10 L.min-1 using a polycarbonate membrane. Each membrane was weighed before and after sampling using an ultra-microbalance (Mettler Toledo UMX2, readability 1mg, Zurich, Switzerland) to determine the daily mass trapped by each membrane, allowing the calculation of the daily mean concentration of PM2.5 (13). The black carbon concentrations were measured using the reflectance method (14) using the same membranes,
and 1/3 of the membranes were submitted to X-ray fluores-cence spectrometry (15) and ion chromatography (16) analysis to determine the concentrations of the predominant chemical elements (Na, Al, Si, P, S, K, Ca, Ti, V, Fe, Ni, Cu, Zn, and Pb), nitrates and sulfates. The daily mean concentrations of PM2.5 were used to calculate the annual daily mean of PM2.5 as described by the WHO (30). All of the samplers were installed in central areas of the metropolitan regions at least 200 m from major traffic routes.
Sources and their relative contributions to the ambient PM2.5 concentrations were identified using receptor model-ing techniques based on the chemical characteristics of the particles collected at the receptor sites (in this case, the different metropolitan areas). In addition, PMF (positive matrix factorization), a factor analysis method, was applied to identify sources and determine the contribution of each identified source to the ambient concentration of PM 2.5 (17). The data used in this study were obtained from a recent research project conducted by our group (18).
Delay in the adoption of the CDT policy and estimate of the ambient PM2.5 concentrations. The non-abatement of ambient PM2.5 concentrations due to the delay in the adoption of more stringent emissions standards was estimated by considering the Total Emissions Inventory agreed upon by the Brazilian Ministry of Environment and truck manufacturers and oil companies operating in Brazil (19). The projected reduction in the PM2.5 concentration that would have been achieved if the CDT policy had been implemented and those expected considering the delay are presented in Figure 1 (20).
Estimation of the health consequences of the imple-mentation of the CDT policy. The differences between the emissions curves presented in Figure 1 are assumed to be proportional to the changes in the proportion of PM2.5 generated by diesel engines for each metropolitan area. The delay in the decline in the level of diesel-generated particles was computed until 2040 based on the present ambient concentrations of PM2.5 and the relative contribution of diesel to PM2.5 determined for each study site.
The impact on morbidity of the additional PM2.5 due to the delay in the implementation of the CDT policy was estimated in terms of hospitalizations due to respiratory and cardio-vascular events. The impact was determined separately for different age groups, employing coefficients from time series studies (Table 1), favoring studies that were conducted locally (21-26). Functions associating increases in air pollu-tion with adverse health effects may be derived based on short-term or long-term exposures. When there is no clear evidence of a chronic effect, the short-term dose response is preferable and more conservative. For PM2.5, long-term cohort studies have provided solid evidence of cumulative effects. Therefore, we used the annual mean PM2.5 concen-tration, as recommended by the WHO (30). For mortality studies, we decided to consider the coefficients that associate chronic exposure to PM2.5 with all causes of mortality in adults to avoid possible bias in establishing the cause of death based on death certificates (WHO).
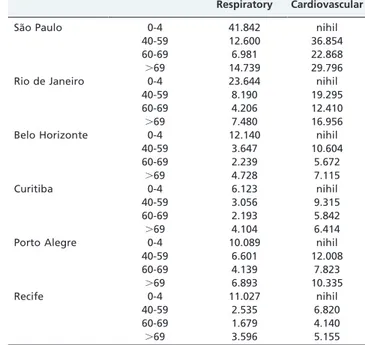
Respiratory and cardiovascular hospital admissions. The numbers of respiratory and cardiovascular hospital ad-missions in the public health system for each metropolitan area for 2007 were obtained from the Brazilian Health Ministry Database (27) and are presented in Table 2.
Hospital admissions in the private health system are not routinely registered in Brazil. We estimated the number of
1grams/brake horsepower/hour
hospital admissions in the private system by extrapolation based on the health insurance coverage rate (28) of the private system for each metropolitan area (as presented in Table 6- Supplemental Data). The number of hospital admissions in the private health system was computed based on the relationship described in the following equation (1):
NPS~NPublic
1 1{CR{1
ð1Þ
Where:
NPS is the number of hospital admissions in the private
system,
Npublicis the number of hospital admissions in the public
system, and
CR is the proportion of the population with access to private health insurance.
After determining the baseline number of hospital admissions for the relevant health outcomes and the age groups of interest and after establishing the coefficients that relate changes in the PM2.5 concentration to hospital admissions, the projected morbidity effects of the delay in implementing the CDT policy were computed using the
following equation (2):
Hadm DConcyear
~½exp b DConcyear
{1
Totadmð2Þ
Where:
Figure 1 - Graphic representation of the estimated PM2.5 emissions for the six Brazilian metropolitan areas (in tons per year) considering the implementation of or the delay in the adoption of the EURO IV standards for diesel emissions.
Table 1 -The age groups considered in this study and the corresponding risk coefficients relating PM2.5
concentrations to a given health effect.
Age group (years)
Respiratory (increase permg/m3)
Cardiovascular (increase permg/m3)
0 to 4 0.0047 (21,23)
40 to 59 0.0024 (26) 0.0016 (26)
60 to 69 0.0044 (22) 0.0024 (22,24)
over 69 0.0063 (25) 0.0027 (24)
Table 2 -Total number of hospital admissions (2007) to the public health system attributable to respiratory and cardiovascular diseases according to age and
metropolitan area.
Metropolitan area Age group (years) Number of Hospital Admissions
Respiratory Cardiovascular
Sa˜o Paulo 0-4 41.842 nihil
40-59 12.600 36.854
60-69 6.981 22.868
.69 14.739 29.796
Rio de Janeiro 0-4 23.644 nihil
40-59 8.190 19.295
60-69 4.206 12.410
.69 7.480 16.956
Belo Horizonte 0-4 12.140 nihil
40-59 3.647 10.604
60-69 2.239 5.672
.69 4.728 7.115
Curitiba 0-4 6.123 nihil
40-59 3.056 9.315
60-69 2.193 5.842
.69 4.104 6.414
Porto Alegre 0-4 10.089 nihil
40-59 6.601 12.008
60-69 4.139 7.823
.69 6.893 10.335
Recife 0-4 11.027 nihil
40-59 2.535 6.820
60-69 1.679 4.140
Hadm (DConcyear) = hospital admissions due to the delay
in reducing the ambient concentration of PM2.5 in a given year;
b= coefficient relating PM2.5 to hospital admissions (Table 1);
DConcyear= difference between the predicted
concentra-tion of PM2.5 that would have been achieved if the CDT policy had been implemented and the estimated concentra-tion of PM2.5 given the delay; and
Totadm = total hospital admissions for a given year. Equation (2) was used to estimate the effects of the additional PM2.5 on the different health outcomes listed in Table 2. The value of Hadm (D Concyear) was integrated
over 40 years, as shown in Figure 1.
Mortality
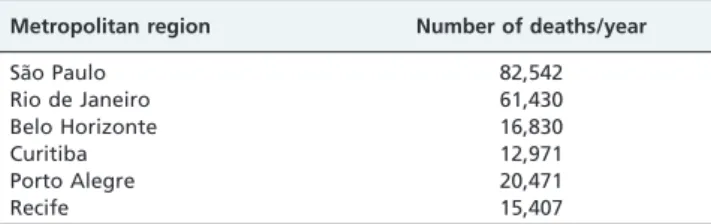
The effects of the delay in implementing the CDT policy were also expressed in terms of mortality. Data on mortality due to natural causes in individuals over 40 years of age were obtained from DATASUS (29). The most recent data available were for 2007 and are presented in Table 3. The additional mortality burden due to the delay in implement-ing the CDT policy was estimated as suggested by the WHO (30) using the following equation:
½M(DConcyear)~ DConcyear
0:006 TotalM ð3Þ
Where:
M (DConcyear) = number of deaths in a given year due to
the delay in reducing the concentration of PM2.5;
DConcyear= difference between the predicted
concentra-tion of PM2.5 that would have been achieved if the CDT policy had been implemented and the estimated concentra-tion of PM2.5 given the delay;
0.006 = relative risk of adult mortality for each 1.0mg/m3 of PM2.5; and
TotalM = the baseline mortality counts for each metropo-litan area, as presented in Table 3.
Economic valuation of the health effects expected to occur as a consequence of the delay in the implementation of the CDT policy. Morbidity costs were estimated in terms of the direct costs of hospital admissions due to respiratory and cardiovascular diseases in both the public and private health systems and in terms of indirect costs (productivity loss). The mean cost of hospital admissions for respiratory and cardiovascular diseases for each age group was obtained from DATASUS (31). The cost of hospital admissions in the private health system was not available and was estimated to be three times higher than the public cost based on data from the Hospital das Clı´nicas of the Faculdade de Medicina da Universidade de Sa˜o Paulo. The cost associated with lost
productivity considers the number of days of absence due to hospitalization (data were obtained from DATASUS (31)) and the mean gross income for each age group (data obtained from the IBGE (the Brazilian Statistical and Geographic Agency), which was responsible for the public economic census conducted in 2000 (32)).
The economic valuation of mortality was performed based on the disability-adjusted life years (DALY) method (33), which combines an ambient factor, in this case the PM2.5 concentration, with a health indicator (mortality) to estimate the number of years of life lost through premature mortality relative to Brazilian life expectancy. The number of (DALY) (33) was calculated using an equation that estimates years of life lost (YLL), the DALY component that refers to time lost due to premature mortality. The YLL was estimated based on the age at death and the life expectancy in southeastern Brazilian. We assumed an equal proportion of male and female deaths. The values of the other parameters (the discount rate and the age-weighted modulation factor) were adopted as recommended by Murray and Lopez (33). The total years of life lost were converted into monetary values as described previously (34), and the values for the years of life lost (YLL) were provided by ExternE (35). The life expectancy values were obtained from the IBGE (the Brazilian Statistical and Geographic Agency) (12) for each metropolitan region.
RESULTS
Source. Our approach indicated that diesel sources contributed approximately 40% of the total mass of PM2.5, considering both primary and secondary aerosol formation. This estimate was consistent with that of the Sa˜o Paulo State Sanitation Agency (CETESB) and previous studies focused on the city of Sa˜o Paulo (37-38).
Hospital Admissions and Mortality
Table 4 presents the estimated excess hospital admissions due to respiratory and cardiovascular diseases in the public and private health systems and the estimated excess mortality for the six metropolitan areas for the years 2009 to 2040 resulting from the delay in the implementation of the CDT policy.
Health and mortality costs
Table 5 presents the costs associated with the excess hospital admissions due to respiratory and cardiovascular diseases attributable to PM2.5.
Mortality costs due to respiratory and cardiovascular diseases attributable to PM2.5 were estimated based on the total years of life lost (YLLs). For the period 2009-2040, the non-abatement of PM2.5 accounted for 162,878 YLLs, which represents a total cost of US$ 11.4 billion.
DISCUSSION
Our results indicate that considerable health and eco-nomic burdens resulted from the delay in implementing the CDT policy. Air pollution in urban areas has negative health effects, including difficulty breathing, wheezing, coughing, eye irritation, aggravation of pre-existing respiratory and cardiac diseases, and even premature death. Effects on pregnancy and fetal development have also been reported (39). Increases in hospital admissions and medication use in
Table 3 -Total number of deaths per year (2007) in the six studied Brazilian metropolitan regions.
Metropolitan region Number of deaths/year
Sa˜o Paulo 82,542
Rio de Janeiro 61,430
Belo Horizonte 16,830
Curitiba 12,971
Porto Alegre 20,471
areas with moderate or high levels of air pollution are commonly reported in different parts of the world (40).
The use of motorized transportation in Brazil increases every year. According to DENATRAN (National Traffic Department), the Brazilian fleet has doubled in the last ten years; there are currently almost 65,000,000 registered vehicles in Brazil, including cars, trucks, buses and motorcycles (41). The states of Sa˜o Paulo, Minas Gerais, and Parana´ have the largest fleets, with nearly 20, 7, and 5 million cars, respectively.
Although this growth in motorized transportation is a result of and an indicator of the growing economy and a higher standard of living, it is accompanied by environ-mental and social challenges, including air pollution and traffic congestion, which pose threats to the health and well-being of the residents.
It is clear that this growth in motorization will increase economic and health costs. To address these problems, different countries have conducted economic valuations of public health endpoints to substantiate environmental and health politics (42). The translation of the social and health benefits of cleaner fuel and vehicle regulations into monetary amounts is necessary to direct the decision-making process regarding actions that have the potential to affect air quality in urban areas (43).
Unfortunately, in Brazil, the decision to postpone the adoption of the CDT policy was not based on any cost-benefit analysis. The displacement of the curve for the reductions in diesel emissions (Figure 1) agreed upon by industries and the Brazilian authorities was considered not to be significant. However, the more detailed analysis of the health consequences of this delay performed in our study indicated that because of the large number of exposed people, the delay in implementing the CDT policy will be responsible for a considerable number of hospitalizations and a presumable excess of approximately 14,000 premature deaths. Most likely, the authorities that approved the postponed implementation of the CDT policy would have made a different decision if the health consequences had been fully considered in the decision-making process.
Because cost-benefit analyses may be highly influenced by regional characteristics, in the present investigation, we collected primary data to minimize uncertainties in the estimates. For example, the concentration response curves for morbidity preferentially used data from local studies. Costs were obtained directly from the Health System databank. A comprehensive sampling and chemical analysis of the particle composition and source apportionment techniques were applied to determine the contribution of the present diesel technology to ambient particle levels in the areas of study.
Vehicles, fuels, air pollution, and health should be treated and analyzed as a system. Changes in fuel composition can immediately impact air pollution and consequently influ-ence air pollution control (44-45). There are many examples of how cleaner diesel fuel contributes to reductions in air pollution. In Hong Kong, a one-weekend intervention study that required all power plants and road vehicles to use fuel oil with a low sulfur content led to an immediate decrease in the level of ambient sulfur dioxide (SO2) and provided
direct evidence that this type of change has immediate and long-term health benefits, thus reducing mortality rates (46). Donald McCubbin and Mark Delucchi evaluated the health costs of a kilogram of various air pollutants, including CO, NOx (Nitric oxides), PM2.5, SOx (sulfur oxides), and VOCs (volatile organic compounds). They estimated health costs based on such factors as hospitalization, chronic illness, asthma attacks, and lost work days for US urban areas. These researchers found that the ranges in health costs per kilogram were from US$0.01 to US$0.10 for CO, US$1.59 to US$23.34 for NOx, US$14.81 to US$225.36 for PM2.5, US$9.62 to US$90.94 for SOx, and US$ 0.13 to US$ 1.45 for VOCs (47).
In the Indian context, the health cost of urban air pollution was estimated to be US$ 1.4 billion (48).
Our results are consistent with the results of previous studies and indicated that the sulfur content of diesel represents a considerable source of ambient fine particles and that considerable health benefits would result from implementing the CDT policy. Indeed, a previous study performed in Sa˜o Paulo indicated that the use of improved
Table 5 -Total costs in US$ of the hospital admissions (PHS and PrHS) due to respiratory and cardiovascular diseases attributable to PM2.5 between 2009-2040 in the six metropolitan areas.
Total costs in US$ of hospital admissions (PHS and PrHS) due to respiratory and cardiovascular diseases attributable to PM2.5 for the period 2009-2040
Belo Horizonte Curitiba Porto Alegre Recife Rio de Janeiro Sa˜o Paulo
PHS 1,400,466 1,188,968 1,845,497 606,468 2,825,747 9,322,799
PrHS 2,931,933 1,861,553 1,946,366 622,914 5,723,134 28,418,886
Total 4,332,399 3,050,521 3,791,863 1,229,382 8,548,881 37,741,685
Table 4 -Total Number of Hospital Admissions (HA) due to Respiratory and Cardiovascular diseases in the Public (PHS) and Private Health Systems (PrHS) and Total Number of Deaths in the six Brazilian Metropolitan Areas between 2009 and 2040 attributable to PM2.5.
Total Number of Hospital Admissions (HA) in the Public (PHS) and Private Health Systems (PrSH) and the Total Number of Deaths for the period 2009-2040
Belo Horizonte Curitiba Porto Alegre Recife Rio de Janeiro Sa˜o Paulo Total
Total number of HA-PHS 1,596 1,244 2,000 843 3,487 9,379 18,549
Total number of HA-PrHS 1,113 649 703 288 2,354 9,530 14,638
diesel technology exhibited the best cost-benefit ratio among all other policies considered to reduce the health effects of air pollution (49). Interestingly, although this report was fully available when the decision to delay the implementa-tion of the CDT policy was made, the relevant authorities did not consider the recommendations presented in that report. This failure to consider published data-based recommendations indicates that the health consequences of industrial and fuel policies are not usually considered in situations in which economic pressures are high.
In conclusion, our results indicate that it is necessary to increase the level of awareness about the health conse-quences of policies that regulate transportation and fuel technology and that human health must play a role in the environmental agenda in urban areas.
ACKNOWLEDGMENTS
This work was supported by CNPq (Conselho Nacional de Ciencia e Tecnologia). We thank the following researchers and institutions for monitoring the PM2.5 concentration and for the sampling infrastructure: Prof Dr Elisabeth Neves from the Department of Anatomy, Center for Biological Sciences (UFPE, Federal University of Pernambuco); Prof Dr Walter Zin from the Respiratory Physiology Laboratory, Carlos Chagas Filho Institute of Biophysics (UFRJ, Federal University of Rio de Janeiro); Prof Dr Geraldo Brasileiro Filho from the Pathology Department, School of Medicine (UFMG, Federal University of Minas Gerais); Prof Dr Orliney Maciel Guimara˜es from the Chemistry Institute (UFPR, Federal University of Parana´); and Prof Dr Cla´udia Ramos Rhoden from the Department of Physiological Sciences (UFCSPA, Porto Alegre Federal Foundation for Medical Sciences).
AUTHOR CONTRIBUTIONS
Andre´ PA designed the research plan, supervised and participated in the field experiments and the acquisition of the air monitoring data, and participated in the data analysis and the writing of the paper. Miraglia SG designed the research plan and participated in the data analysis and the estimation of the monetary health costs. Veras MM designed the research plan and participated in the data analysis and the writing of the paper. Saldiva PH coordinated the study, designed the research plan, and participated in the writing of the paper. All authors have read and approved the final version of the manuscript.
REFERENCES
1. Brulle RJ, Pellow DN. Environmental justice: human health and environmental inequalities. Annu Rev Public Health. 2006;27:103-24, http://dx.doi.org/10.1146/annurev.publhealth.27.021405.102124. 2. Jerrett M. Global geographies of injustice in traffic-related air pollution
exposure. Epidemiology. 2009;20(2):231-3, http://dx.doi.org/10.1097/ EDE.0b013e31819776a1.
3. Havard S, Deguen S, Zmirou-Navier D, Schillinger C, Bard D. Traffic-related air pollution and socioeconomic status: a spatial autocorrelation study to assess environmental equity on a small-area scale. Epidemiology. 2009;20(2):223-30, http://dx.doi.org/10.1097/ EDE.0b013e31819464e1.
4. Lee JK, Lim GC. Environmental Policies in Developing-Countries - a Case of International Movements of Polluting Industries. J Dev Econ. 1983;13(1-2):159-73, http://dx.doi.org/10.1016/0304-3878(83)90057-3. 5. Stupfel M. Recent advances in investigations of toxicity of automotive
exhaust. Environ Health Perspect. 1976;17:253-85, http://dx.doi.org/ 10.1289/ehp.7617253.
6. Colvile RN, Hutchinson EJ, Mindell JS, Warren RF. The transport sector as a source of air pollution. Atmos Environ. 2001;35(9):1537-65, http:// dx.doi.org/10.1016/S1352-2310(00)00551-3.
7. European Economic Community. Council Directive 70/220/EEC. 1970. On the approximation of the laws of the Member States relating to measures to be taken against air pollution by gases from positive-ignition engines of motor vehicles. Available from http://eur-lex.europa.eu/ LexUriServ/LexUriServ.do?uri=CELEX:31970L0220:en:NOT
8. Emission Standards – Summary of worldwide diesel emission Standards. Available from: http://www.dieselnet.com/standards/
9. Ministe´rio do Meio Ambiente. Conselho Nacional de Meio Ambiente. Resoluc¸a˜o 315/2002. Nova etapa do Programa de Controle de Emisso˜es Veiculares – PROCONVE. Available from: http://www.ibama.gov.br/ proconve/ArquivosUpload/6resolucao_315-02_-_novas_etapas.pdf 10. Hart JE, Garshick E, Dockery DW, Smith TJ, Ryan L, Laden F. Long-term
ambient multipollutant exposures and mortality. Am J Respir Crit Care Med. 2011;183(1):73-8, http://dx.doi.org/10.1164/rccm.200912-1903OC. 11. Olmo NR, Saldiva PH, Braga AL, Lin CA, Santos Ude P, Pereira LA. A
review of low-level air pollution and adverse effects on human health: implications for epidemiological studies and public policy. Clinics. 2011;66(4):681-90, http://dx.doi.org/10.1590/S1807-59322011000400025. 12. IBGE, Instituto Brasileiro de geografia e Estatı´stica. Available from:
http://www.ibge.gov.br/home/mapa_site/mapa_site.php#populacao 13. Miranda RM, Andrade MF, Fornaro A, Astolfo R, Andre´ PA, Saldiva P.
Urban air pollution: a representative survey of PM2.5 mass concentra-tions in six Brazilian cities. Air Quality, Atmosphere and Health. 2011. 14. Mniszek W, Jacek Wypych J, Zielonka U. Determination of elemental
carbon emission. Environ Monitor Assess. 1990;29:41-52, http:// dx.doi.org/10.1007/BF00546777.
15. Schauer JJ, Lough GC, Shafer MM, Christensen WF, Arndt MF, DeMinter JY, et al. Characterization of metals emitted from motor vehicles. 2006; Report from the Health Effects Instituten n˚133. Available from: http:// pubs.healtheffects.org/getfile.php?u=251
16. Brown RJ, Edwards PR. Measurement of anions in ambient particulate matter by ion chromatography: a novel sample preparation technique and development of a generic uncertainty budget. Talanta. 2009;80(2):1020-4, http://dx.doi.org/10.1016/j.talanta.2009.07.042. 17. EPA Positive Matrix Factorization (PMF) 3.0 Model, 2010. Available from
http://www.epa.gov/heasd/products/pmf/pmf.html
18. Andrade MF, Miranda RM, Fornaro A, Kerr A, Oyama B, Andre´ PA, et al. Vehicle emissions and PM2.5 mass concentrations in six Brazilian cities. Air Quality, Atmosphere and Health. 2011.
19. Ministe´rio do Meio Ambiente, 2011; 1˚Inventa´rio Nacional de Emisso˜es Atmosfe´ricas por Veı´culos Automotores Rodovia´rios. Available from: http://www.antt.gov.br/inventario/documentos/inventarionacional20 110209.pdf
20. IEMA - Instituto de Energia e Meio Ambiente. Inventa´rio Nacional de Emisso˜es Atmosfe´ricas por Veı´culos Automotores Rodovia´rios Available from: http://www.energiaeambiente.org.br/biblioteca/biblioteca.aspx 21. Braga AL, Saldiva PH, Pereira LA, Menezes JJ, Conceic¸a˜o GM, Lin CA, et al.
Health effects of air pollution exposure on children and adolescents in Sa˜o Paulo, Brazil. Pediatr Pulmonol. 2001;31(2):106-13, http://dx.doi.org/ 10.1002/1099-0496(200102)31:2,106::AID-PPUL1017.3.0.CO;2-M. 22. Martins LC, Pereira LA, Lin CA, Santos UP, Prioli G, Luiz Odo C, et al.
The effects of air pollution on cardiovascular diseases: lag structures. Rev Saude Publica. 2006;40(4):677-83, http://dx.doi.org/10.1590/S0034-89102006000500018.
23. Gouveia N, de Freitas CU, Martins LC, Marcilio IO. Respiratory and cardiovascular hospitalizations associated with air pollution in the city of Sa˜o Paulo, Brazil. Cad Saude Publica. 2006;22(12):2669-77.
24. Ulirsch GV, Ball LM, Kaye W, Shy CM, Lee CV, Crawford-Brown D, et al. Effect of particulate matter air pollution on hospital admissions and medical visits for lung and heart disease in two southeast Idaho cities. J Expo Sci Environ Epidemiol. 2007;17(5):478-87, http://dx.doi.org/ 10.1038/sj.jes.7500542.
25. Cancado JE, Saldiva PH, Pereira LA, Lara LB, Artaxo P, Martinelli LA, et al. The impact of sugar cane-burning emissions on the respiratory system of children and the elderly. Environ Health Perspect. 2006;114(5):725-9, http://dx.doi.org/10.1289/ehp.8485
26. Anderson HR, Atkinson RW, Bremner AS, Marston L. Particulate air pollution and hospital admissions for cardiorespiratory diseases: are the elderly at greater risk? Eur Respir J. 2003;Suppl.40:39s-46s, http:// dx.doi.org/10.1183/09031936.03.00402203.
27. DATASUS (Departamento de Informa´tica do SUS). Indicadores de Assisteˆncia a` sau´de, 2009. Available from: http://www2.datasus. gov.br/DATASUS/index.php?area=0202
Table 6 -Percentage of the population with private health insurance coverage.
Metropolitan area
Percentage of the population with private health insurance coverage
Sa˜o Paulo 50.4
Rio de Janeiro 40.3
Belo Horizonte 41.1
Curitiba 34.3
Porto Alegre 26.0
28. ANS (Ageˆncia nacional de Sau´de Suplementar). Taxa de Cobertura dos Planos de Sau´de 2011. Available from: http://www.ans.gov.br/anstabnet/ anstabnet/deftohtm.exe?anstabnet/dados /TABNET_TX.DEF
29. DATASUS (Departamento de Informa´tica do SUS). Informac¸o˜es de Sau´de, 2009. Available from: http://www2.datasus.gov.br/DATASUS/ index.php?area=0205
30. WHO (World Health Organization). Environmental Burden of Diseases Series N˚5: Outdoor Air Pollution. Available from: http://www.who. int/quantifying_ehimpacts/publications/ebd5.pdf
31. DATASUS (Departamento de Informa´tica do SUS). Internac¸o˜es Hospitalares do SUS, 2009. Available from: http://tabnet.datasus.gov. br/cgi/deftohtm.exe?sih/cnv/sxsp.def
32. IBGE (Instituto Brasileiro de Geografia e Estatı´stica). Censo 2000 http:// www.ibge.gov.br/home/estatistica/populacao/default_censo_2000.shtm 33. Murray CJ, Lopez AD. Regional patterns of disability-free life expectancy
and disability-adjusted life expectancy: Global Burden of Disease Study. Lancet. 1997;349(9062):1347-52, http://dx.doi.org/10.1016/S0140-6736(96)07494-6.
34. Murray CJ, Lopez AD. On the comparable quantification of health risks: lessons from the Global Burden of Disease Study. Epidemiology. 1999;10(5):594-605, http://dx.doi.org/10.1097/00001648-199909000-00029. 35. Miraglia SG, Saldiva PH, Bo¨hm GM. An evaluation of air pollution
health impacts and costs in Sa˜o Paulo, Brazil. Environ Manage. 2005;35(5):667-76, http://dx.doi.org/10.1007/s00267-004-0042-9. 36. ExternE. External costs of Energy. Available from: http://www.externe.
info/
37. CETESB (Companhia Ambiental do estado de Sa˜o Paulo). Material Particulado Inala´vel Fino (MP2,5) e Grosso (MP2,5 – 10) na atmosfera da Regia˜o Metropolitana de Sa˜o Paulo (2000 – 2006). 2006. Available from: http://www.cetesb.sp.gov.br/ar/qualidade-do-ar/31-publicacoes-e-relatorios.
38. Castanho Ada, Artaxo P. Wintertime and summertime Sao Paulo aerosol source apportionment study. Atmos Environ. 2001;35(29):4889–902, http://dx.doi.org/10.1016/S1352-2310(01)00357-0.
39. Veras MM, Caldini EG, Dolhnikoff M, Saldiva PH. Air pollution and effects on reproductive-system functions globally with particular emphasis on the Brazilian population. J Toxicol Environ Health B Crit Rev. 2010;13(1):1-15.
40. Schwela D. Air pollution and health in urban areas. Rev Environ Health. 2000;15:13-42, http://dx.doi.org/10.1515/REVEH.2000.15.1-2.13. 41. DENATRAN. Departamento Nacional de Traˆnsito. Anua´rio da Frota de
Veı´culos. Available at: http://www.denatran.gov.br/frota.htm 42. El-Fadel M, Massoud M. Particulate matter in urban areas: health-based
economic assessment. Sci Tot Environ. 2000;257(2-3):133-46, http:// dx.doi.org/10.1016/S0048-9697(00)00503-9.
43. Pearce D. Economic Valuation and Health Damage from Air Pollution in the Developing World. Energy Policy. 1996;24(7):627-30, http:// dx.doi.org/10.1016/0301-4215(96)00051-1.
44. Chang HJ, Cho GL, Kim YD. The economic impact of strengthening fuel quality regulation–reducing sulfur content in diesel fuel. Energ Policy. 2006;34(16):2572–85, http://dx.doi.org/10.1016/j.enpol.2004.08.017. 45. US EPA, United State Environmental protection Agency. Fuel Sulfur
Effects on Exhaust Emissions. 1999. Available from: http://www.epa. gov/oms/models/mobile6/m6ful001.pdf.
46. Hedley AJ, Wong CM, Thach TQ, Ma S, Lam TH, Anderson HR. Cardiorespiratory and all-cause mortality after restrictions on sulphur content of fuel in Hong Kong: an intervention study. Lancet. 2002; 360(9346):1646-1652.
47. McCubbin D, Delucchi M. The Health Costs of Motor-Vehicle-Related Air Pollution. J Transp Econom Pol. 1999;33(3):253-86.
48. Brandon CHommann K. 1995. ‘‘The Cost of Inaction: Valuing the Economy-wide Cost of Environmental Degradation in India,’’ Presented at the Modelling Global Sustainability conference at the United Nations University, Tokyo, Japan.