UNIVERSIDADE FEDERAL DO RIO GRANDE DO NORTE CENTRODEBIOCIÊNCIAS
PROGRAMA DE PÓS-GRADUAÇÃO EM ECOLOGIA
ANGÉLICA NAGATA DE SOUSA BORGES
‘MODELO DE AVALIAÇÃO DE RISCO
’:
SÃO O CRESCIMENTO E A ESTEQUIOMETRIA DOS GIRINOS AFETADOS PELO EFEITO INTERATIVO ENTRE A PRESENÇA DO PREDADOR E A DENSIDADE DE COESPECÍFICOS?ANGÉLICA NAGATA DE SOUSA BORGES
‘Modelo de avaliação de risco’: São o crescimento e a estequiometria dos girinos afetados pelo efeito interativo entre a presença do predador e da densidade de
coespecíficos?
Dissertação apresentada ao Programa de Pós-Graduação em Ecologia da Universidade Federal do Rio Grande do Norte – UFRN – como requisito para obtenção do título de Mestre em Ecologia
Área de concentração: Ecologia de Ecossistemas
Orientador (a): Prof. Drª. Luciana Silva Carneiro
Autorizo a reprodução e divulgação total ou parcial deste trabalho, por qualquer meio convencional ou eletrônico, para fins de estudo e pesquisa, desde que citada à fonte.
UFRN / Biblioteca Central Zila Mamede Catalogação da Publicação na Fonte
Borges, Angélica Nagata de Sousa.
“Modelo de avaliação de risco”: são o crescimento e a estequiometria dos girinos afetados pelo efeito interativo entre a presença do predador e da densidade de coespecíficos? / Angélica Nagata de Sousa Borges. – Natal, RN, 2013.
36 f. : il.
Orientadora: Profª. Dra. Luciana Silva Carneiro.
Dissertação (Mestrado) – Universidade Federal do Rio Grande do Norte. Centro de Biociências. Programa de Pós-Graduação em Ecologia.
1. Risco de predação (Ecologia) - Dissertação. 2. Ecologia do estresse - Dissertação. 3. Efeitos não letais - Dissertação. 4. Estequiometria ecológica - Dissertação. I. Carneiro, Luciana Silva. II. Universidade Federal do Rio Grande do Norte. IV. Título.
Nome: BORGES, Angélica Nagata de Sousa.
Título: ‘Modelo de avaliação de risco’: São o crescimento e a estequiometria dos girinos afetados pelo efeito interativo entre a presença do predador e da densidade de coespecíficos?
Dissertação apresentada ao Programa de Pós-Graduação em Ecologia da
Universidade Federal do Rio Grande do Norte como requisito para obtenção do título de Mestre em Ecologia
Aprovado (a) em 16 de julho de 2013
Banca Examinadora:
___________________________________________________________ Profª. Drª. Luciana Silva Carneiro (Orientadora)
Departamento de Botânica, Ecologia e Zoologia/UFRN
___________________________________________________________ Prof. Dr. José Luiz de Attayde
Departamento de Botânica, Ecologia e Zoologia/UFRN
___________________________________________________________ Dr. Rafael Dettogni Guariento
AGRADECIMENTOS
É com muita alegria que expresso aqui a minha gratidão a todos que participaram e contribuíram para a realização dessa pesquisa.
Primeiramente gostaria de agradecer à professora Drª Luciana Silva Carneiro, pela orientação e paciência. Muito obrigada!
Gostaria de agradecer ainda:
Ao professor Dr. Adriano Caliman, pela participação ativa em todas as etapas desta pesquisa, desde a elaboração do experimento até todas as sugestões de análises e revisão do texto;
Ao Dr. Rafael Guariento, pela participação na elaboração do experimento e por todas as suas correções;
À professora Drª Miriam Plaza Pinto, pelas valiosas sugestões e comentários; Ao professor Dr. José Luiz de Attayde, que desde já agradeço pela avaliação desse trabalho e todas as correções;
A todo pessoal da Escola Agrícola de Jundiaí (EAJ- UFRN), que cedeu o espaço e os mesocosmos para a realização do experimento;
Ao professor Dr. Alex Poeta Casali da Universidade Federal da Paraíba (UFPB), por gentilmente ceder os girinos utilizados no experimento;
A todos do Laboratório de Limnologia da Universidade Federal do Rio Grande do Norte (UFRN), pela disponibilidade sempre que precisei preparar as amostras ou tentei realizar as análises com o equipamento de vocês!
Ao Laboratório de Limnologia da Universidade Federal do Rio de Janeiro (UFRJ) por permitir a realização das análises de nutrientes em suas dependências;
A todos do Laboratório de Ecologia Aquática (LEA) pela colaboração;
À Júnia Kizzy, minha companheira de todas as horas com quem sempre pude contar. MUITO OBRIGADA! Você não tem noção da importância da sua amizade pra mim!
Ao Jaqueiuto Silva, por toda ajuda na eletrizante captura das baratas d’água. Além de todas as dicas sobre os girinos. Você foi demais!
À Camila Cabral, por todo apoio, desabafar com você permitiu que a minha saúde mental permanecesse intacta (ou quase) durante essa empreitada;
Ao Guilherme Mazzochini, pela ajuda nas análises estatísticas;
A todos os professores do Programa de Pós-Graduação em Ecologia (PPGEco) que contribuíram enormemente para minha formação;
Aos amigos da PPGEco;
À Universidade Federal do Rio Grande do Norte por toda estrutura;
Ao Conselho Nacional de Desenvolvimento Científico e Tecnológico (CNPQ) pela concessão da bolsa de mestrado e todo auxílio financeiro necessário para realização desta pesquisa;
Por fim, meu agradecimento especial à minha família (Mamãe, papai, irmãos e sobrinha), por todo amor e incentivo – AMO VOCÊS! – e ao Rafael, meu amado namorido, que além de todo amor e confiança, foi decisivo em todas as questões práticas desta pesquisa.
RESUMO
BORGES, A. N. S. ‘Modelo de avaliação de risco’: São o crescimento e a estequiometria dos girinos afetados pelo efeito interativo entre a presença do predador e da densidade de coespecíficos? 2013. 36f. Dissertação (Mestrado) - Pós-Graduação em Ecologia, Universidade Federal do Rio Grande do Norte, Natal, 2013.
Muitos organismos alteram o seu fenótipo para reduzir o risco de predação. No entanto, tais modificações estão associadas a trade-offs, que podem ter efeitos negativos sobre o
crescimento e a reprodução destes organismos. Compreender como as presas avaliam o risco de predação é fundamental para avaliar o valor adaptativo das mudanças fenotípicas induzidas pelo predador e suas consequências ecológicas. Neste estudo nós realizamos um experimento em mesocosmo para testar: i) se o crescimento e a estequiometria dos girinos da espécie Lithobates catesbeianus é alterado em resposta a
presença de baratas d’água predadoras (Belostoma spp.); ii) se estas respostas dependem
da densidade de girinos no ambiente. Aqui nós mostramos que os girinos não têm o seu crescimento nem a sua estequiometria afetada pela presença do predador, esteja os girinos em baixas ou em altas densidades. Nossos resultados indicam que os girinos expostos ao risco de predação regularam sua fisiologia a fim de preservar a homeostase estequiométrica do seu corpo e excretas. Além disso, aponta a necessidade de experimentos que elucidem em que condições o crescimento e a estequiometria de girinos são modificados em resposta ao risco de predação.
ABSTRACT
BORGES, A. N. S. ‘Modelo de avaliação de risco’: São o crescimento e a estequiometria dos girinos afetados pelo efeito interativo entre a presença do predador e da densidade de coespecíficos? 2013. 36f. Dissertação (Mestrado) - Pós-Graduação em Ecologia, Universidade Federal do Rio Grande do Norte, Natal, 2013.
Many prey organisms change their phenotype to reduce the predation risk. However, such changes are associated with trade-offs, and can have negative effects on prey growth or reproduction. Understand how preys assess the predation risk is essential to evaluate the adaptive value of predator-induced phenotypic and its ecological consequences. In this study, we performed a mesocosm experiment to test: i) if growth and stoichiometry of Lithobates catesbeianus tadpoles is altered in response to giant
water bug presence (Belostoma spp.); ii) if these responses depend on tadpoles’ density
in environment. Here, we show that tadpoles’ growth and stoichiometry are not changed by predator presence, neither in low nor in high densities. Our results suggest that tadpoles exposed to predation risk regulate their physiology to preserve the elemental stoichiometric homeostase of their body and excretion. Further, point out to need for future studies that elucidate under what conditions growth and stoichiometry are changed in response to predation risk.
SUMMARY
1. INTRODUCTION ... 11
2. METHODS ... 14
2.1. EXPERIMENTAL DESIGN ... 14
2.2. CONTROL OF EXPERIMENTAL ABIOTIC CONDITIONS ... 17
2.3. QUANTIFICATION OF EXCRETION AND BODY NUTRIENT STOICHIOMETRY ... 17
2.4. STATISTICAL ANALYSIS ... 18
3. RESULTS ... 19
4. DISCUSSION ... 24
REFERENCES ... 28
APPENDIX A... 33
11 1. INTRODUCTION
Many prey organisms modify their phenotype to increase their chances of survival in predation risk situations (Lima 1998; Lima & Dill 1990). This includes changes in behavior (McIntyre, Baldwin, & Flecker 2004; Peacor 2006; Peacor & Werner 2000; Richardson 2001), morphology (Gómez & Kehr 2011; Kehr & Gómez 2009; McIntyre et al. 2004; Relyea 2001a), physiology (Archard et al. 2012; Barry & Syal 2012; Hawlena & Schmitz 2010a; McPeek, Grace, & Richardson 2001) and development (Skelly & Werner 1990; Steiner 2007b; Vonesh & Warkentin 2006). However, such modifications can negatively affect other prey fitness components, such as growth and reproduction, as a result of trade-off between reduce predation risk and obtain food from environment (Relyea 2002b; Werner & Anholt 1993). Thus, it is essential that prey be able to assess predation risk accurately to dose their phenotypic response (Peacor 2003; Van Buskirk & Arioli 2002).
Recognize the predator presence in the environment is the first step to a prey organism assess and react to predation risk (Hettyey et al. 2012). There are numerous sensory pathways by which a prey can detect predator presence, such as vision, hearing and chemical cues (Hettyey et al. 2012; Saidapur et al. 2009). The predator presence detection may be either via direct contact or indirect recognition of cues released during predator successful or unsuccessful attack on other prey individuals (Peacor 2003). There are evidences that many species use this latter mechanism to assess, in part or in a whole, the intensity of predation risk (Dicke & Grostal 2001; Peacor 2003)
12
The level of chemical cues in the environment is proportional to prey density, once the number of prey injured or killed by predator increases with prey availability (Holling 1959; Van Buskirk et al. 2011). Therefore, a prey organism also must be able to distinguish differences in conspecific density to assess and react accurately to predation risk (Peacor 2003). Peacor (2003)proposed the ‘risk assessment’ model in which argues that real predation risk in the environment is the ratio of intensity of risk cue to conspecific density. This predation risk assessment estimated through conspecific density prevents that prey overestimate the predation risk at high prey density or underestimate it at low prey density (Peacor 2003), leading prey to invest in properly predator defense (Van Buskirk et al. 2011). The investment in maladaptive anti-predator defenses has consequences to individual mortality, whether due to costs in fitness or inefficiency in avoiding predator (Van Buskirk et al. 2011; Werner & Peacor 2003)
The main prediction of Peacor’s model is that variations in the ratio of risk cue-
to- prey density induce phenotypic defenses in prey organisms, regardless of whether
13
The responses to predation risk have effects that might cascade down on food webs, affecting ecosystem properties and functions such as productivity, nutrient cycling, food chain length, trophic biomass, and species diversity (Dickman et al. 2008; Hawlena & Schmitz 2010a; Schmitz 2008b). Risk assessment’ model can have direct and indirect implications for nutrient cycling as organisms at predation risk can alter their resource use and nutrients excretion and consequently their nutritional budget (Hawlena & Schmitz 2010a; b). The nutrient demand of an organism is affected by intensity of its physiological processes, which in turn depends on its level of stress (Hawlena & Schmitz 2010b; Steiner & Van Buskirk 2009). At a specific level of predation risk, the increase in prey metabolism is the physiological trait more evident. In the short term (i. e. minutes or hours), such metabolic increase ensures that prey can be energetically able to avoid or fight its predator (Hawlena & Schmitz 2010b; Steiner & Van Buskirk 2009). On the other hand, if such metabolic increase is maintained for the long term (i. e. days or weeks), the prey is forced to relocate energy from growth or storage to meet the metabolism energy demand. This mechanism may inhibit prey biomass production, nitrogen excretion and, in extreme cases, promote breakdown of body protein into glucose (i. e. gluconeogenesis) (Hawlena & Schmitz 2010a; b). In addition, foraging behavior adjustments of the prey related to resource choice can prevent deleterious effects of the increase in energy demand induced by the predator (Hawlena & Schmitz 2010a; b). Therefore, alterations in prey nutrient excretion in response to predation risk can affect the fast nutrient cycling, while alterations in prey resource choice affect the slow nutrient cycling (Vanni 2002).
14
& Schmitz 2010a; Hawlena et al. 2012; Schmitz 2008a). The authors showed that
Melanoplus femurrubrum grasshoppers facing spider predation risk has a greater
demand for carbon (C) than control grasshoppers, which leads to changes in grasshoppers diet (Hawlena & Schmitz 2010a). The authors also showed that such grasshoppers’ diet shift affects the nutrients that enter the detrital pool, which in turn affects the litter decomposition (Hawlena et al. 2012). However, there are still too few studies that investigate the prey stoichiometric response to predation risk and its ecological consequences. In addition, the existing surveys are restricted to terrestrial (Hawlena & Schmitz 2010a; Hawlena et al. 2012) and to pelagic model systems.
In this study we asked if prey at constant predation risk modifies its growth and stoichiometry in response to differences in conspecific densities. Our hypotheses were that predation risk: i) will negatively affect prey growth (biomass), and this effect will be greater at low (vs. high) prey density; ii) will negatively affect prey body nitrogen (N) and phosphorous (P) content, and this effect will be greater at low (vs. high) prey density; iii) will positively affect prey excretion N and P content, and this effect will be greater at low (vs. high) prey density; iv) via alterations in prey excretion, will indirectly cascade to positively affect the periphyton nutrient (N: P) stoichiometry. 2. METHODS
2.1.EXPERIMENTAL DESIGN
We exposed small bullfrog tadpoles (Lithobates catesbeianus Shaw, 1802) to
chemical cues – predation risk – from the giant water bugs Belostoma spp. to test our
hypotheses. Relyea (2001b) reported water bug’s ability to capture, handle and consume
Lithobates catesbeianus tadpolesthat co-occur in natural ponds in Michigan, USA. This
predator- prey pair was chosen as our study system because amphibian larvae exhibit a great variety of plastic phenotypic responses to predators and both species are quite amenable to experimental manipulation (Relyea 2001a). Experimental tadpoles (individual length ~ 2, 5 cm) came from a frog farm located in Pium, Rio Grande do Norte state (RN), while giant water bugs (individual length ~ 3 cm) were collected in temporary pools in Santa Maria – RN.
15
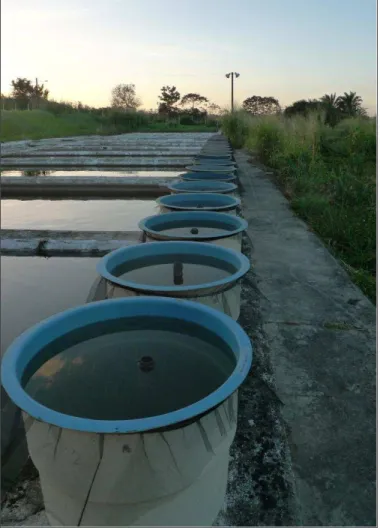
truncated cone shaped (0, 74-m diameter at base; 0, 98-m diameter of the aperture; 0, 53-m height). Tanks were filled with water from Jundiai Reservoir one month before adding tadpoles and applying treatments. Mean total nitrogen and phosphorus of the Jundiai Reservoir during experimental period were 82.77 µM and 6.98 µM, respectively. All mesocosms were covered with mosquito nets to minimize allochthonous input and to prevent oviposition and immigration by aquatic insects, predators and competitors (Fig. 1).
Fig. 1. Experimental tanks field setup.
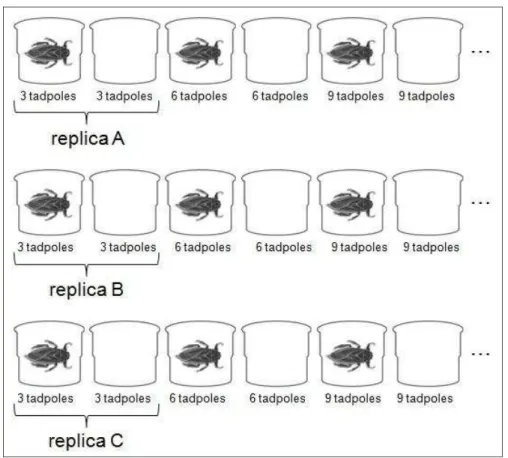
The experiment consisted of a 2 x 3 full factorial design with two levels of predation risk (risk / no risk) and three levels of prey conspecific densities, 12, 24 and
16
Fig. 2. Experimental design
The feeding of tadpoles was based on industrial fish food to ensure a constant
per capita food level. Daily, we added industrial fish food (10% of tadpole mass) to all
mesocosms, according to Van Buskirk et al.(Van Buskirk et al. 2011). The periphyton that grew up at the walls of the mesocosms also was food source available for the tadpoles. Tadpole’s mortality was inspected and registered. However, dead tadpoles were not replaced to ensure that the time of exposure to risk cues was the same between tadpoles.
17
mesocosms. We inspected the mesocosms daily and replaced any dead water bug, so water bug density was constant throughout the experiment (Fig. 3).
Fig. 3. Illustration of plastic floating cages used in the present experiment to avoid predation of tadpoles by water bugs.
At the end of the experiment, we conducted excretion experiments with the tadpoles (see below) and afterwards tadpoles were frozen to posterior body nutrient (N and P) analysis. Periphyton sample were collected by scrapping three random areas of the mesocosms wall with a plastic card (i.e. stratified by depth). The scraped periphyton were then rinsed into vials and filled up to 50 milliliters slurry with mineral water. Samples were kept under frozen storage until the nutrient analysis.
2.2.CONTROL OF EXPERIMENTAL ABIOTIC CONDITIONS
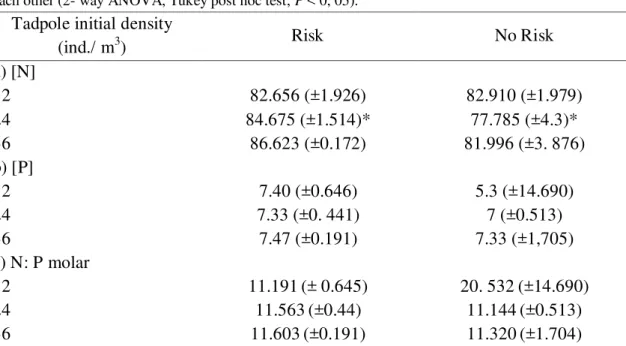
Water samples were taken from all experimental tanks to quantify initial nutrient concentrations at the beginning of experiment. Nitrogen (N) and phosphorous (P) concentrations in water column were analyzed using the salicylate hypochlorite method (Golterman, Clymo, & Ohnstad 1978) and ammonium-molybdate method (Strickland & Parsons 1972), respectively. We used a two- way ANOVA with the Tukey as a post hoc test (P < 0, 05) to compare N, P concentrations and N: P ratio in water column among
treatments.
2.3.QUANTIFICATION OF EXCRETION AND BODY NUTRIENT STOICHIOMETRY
We used methods described in Schaus et al. (1997) to quantify tadpole’s
18
nutrient concentrations prior to tadpole addition. Tadpoles were incubated for 85 – 95 minutes (Whiles et al. 2009). At the end of incubations, animals were removed and kept refrigerated for a couple of hours. Excretion and initial samples were filtered through Whatman GF/C filters to remove faeces and other particles, stored in acid-washed vials and frozen until nutrient analysis. Filtrate samples were analyzed for ammonia (NH3)
and orthophosphate (PO4-3) using the salicylate hypochlorite method (Golterman et al.
1978) and ammonium-molybdate method (Strickland & Parsons 1972), respectively. Mass-specific nutrient excretion rates, rex, were calculated as:
Where [N final] is nutrient, NH3 orPO4-3, final concentration, [N initial] is nutrient, NH3 or
PO4-3, initial concentration, V is container volume in liters, T is incubation time in hours
and B is tadpoles total dry biomass in grams.
To quantify tadpoles body nutrient stoichiometry, tadpoles were dried at 60ºC for a minimum 48 hours, weighed (to the nearest 0.01g), grounded to a fine powder with a mortar and pestle. Powder samples were digested with hydrochloric acid (HCl) and potassium persulphate (K2S2O8) to convert particulate N and P to nitrate (NO3-) and
PO4-3, respectively (Golterman et al. 1978). NO3- was measured by the salicylate
hypochlorite method (Golterman et al. 1978), whereas PO4-3 was measured by the
ammonium-molybdate method (Strickland & Parsons 1972). N and P tissue content were determined based on dry weight of samples used in analysis and was expressed in N or P (µg) per total dry weight (mg) to tissue. We used the same analysis to assess N and P content in periphyton biomass. Periphyton N and P content was expressed in N or P (µg) per 50 milliliters aliquot to periphyton.
2.4.STATISTICAL ANALYSIS
We used an analysis of covariance (ANCOVA) to evaluate the individual and interactive effects of predation risk (fixed factor) and tadpole density (covariate) on:
‐ Tadpoles’ mortality; ‐ Tadpoles’ growth;
19
‐ Tadpoles’ excretion rate and stoichiometry – NH3, PO4-3 and NH3: PO4-3
ratio;
‐ Periphyton stoichiometry – N: P ratio.
According to our objectives, a significant interaction term between predation risk and tadpole density confirm that density of preys mediate the effects of predation risk on tadpole phenotype. Tadpole mortality unbalanced our experimental design and therefore we use ANCOVA instead of 2-way ANOVA to analyze our data.
We tested the assumptions of normality and homocedasticity of the ANCOVA to all dependent variables using Shapiro-Wilk test and Bartllet test (p > 0, 05),
respectively. Tadpoles’ growth, NH3 and PO4-3excretion rate, and NH3: PO4-3 excretion
ratio data not satisfied these assumptions and were square root transformed. Body nutrient stoichiometry values of replica A and B of the treatment risk with 12 ind/m3are
missing because biological material was not enough to nutrient analysis.
ANCOVAs were performed in the R statistical programming environment version 2·3·1 (R Development Core Team 2006). We used the “lm” (linear model) function to carry out the ANCOVA in R. Raw data and R scripts see appendix A. All graphics were performed using GraphPad Prism version 5.01 for Windows (GraphPad Software, San Diego California USA).
3. RESULTS
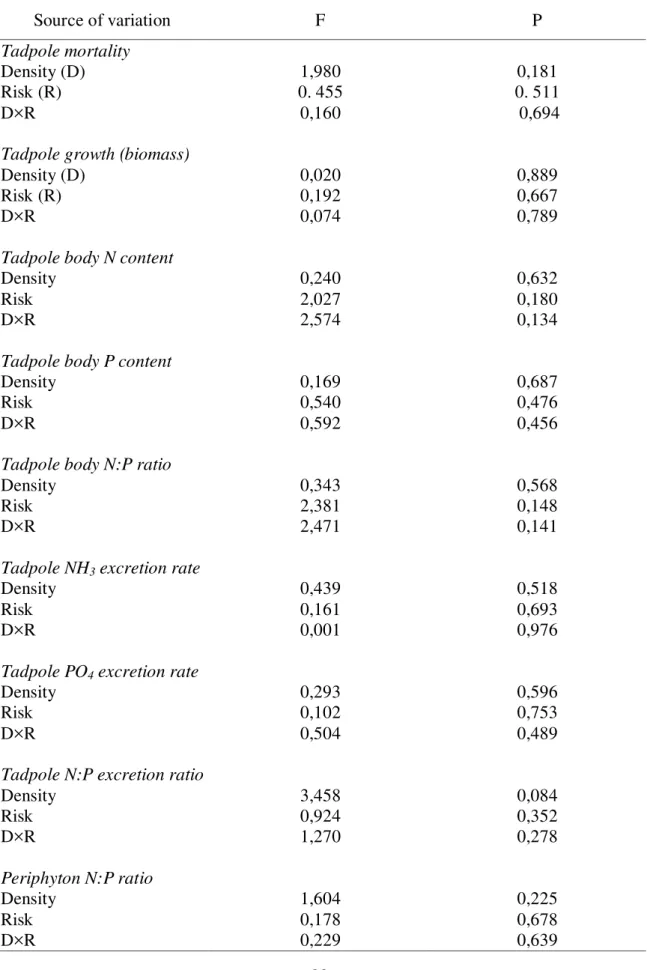
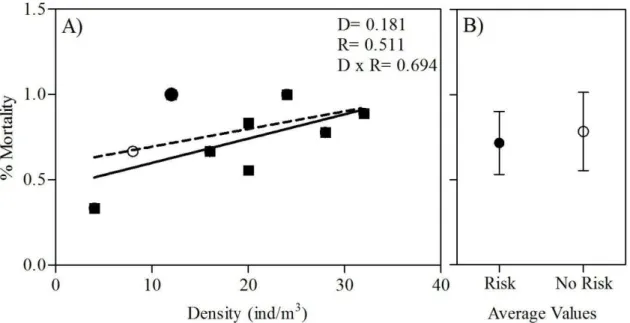
Neither mortality, growth, body and excretion nutrient contents and ratios of tadpoles, nor periphyton stoichiometry were significantly affected by predation risk and conspecific density and by their interactions (Table 1; Fig. 4-8). Conspecific density had
20
Table 1: Summary of the analyses of covariance (ANCOVA) testing the individual and interactive effects of predation risk (categorical factor), density (covariate) and their interaction on tadpole mortality, biomass, body and excretion N and P content and ratios, and periphyton N: P ratio.
Source of variation F P
Tadpole mortality
Density (D) 1,980 0,181
Risk (R) 0. 455 0. 511
D×R 0,160 0,694
Tadpole growth (biomass)
Density (D) 0,020 0,889
Risk (R) 0,192 0,667
D×R 0,074 0,789
Tadpole body N content
Density 0,240 0,632
Risk 2,027 0,180
D×R 2,574 0,134
Tadpole body P content
Density 0,169 0,687
Risk 0,540 0,476
D×R 0,592 0,456
Tadpole body N:P ratio
Density 0,343 0,568
Risk 2,381 0,148
D×R 2,471 0,141
Tadpole NH3 excretion rate
Density 0,439 0,518
Risk 0,161 0,693
D×R 0,001 0,976
Tadpole PO4 excretion rate
Density 0,293 0,596
Risk 0,102 0,753
D×R 0,504 0,489
Tadpole N:P excretion ratio
Density 3,458 0,084
Risk 0,924 0,352
D×R 1,270 0,278
Periphyton N:P ratio
Density 1,604 0,225
Risk 0,178 0,678
21
Fig. 4. Tadpoles relative mortality regressed against tadpoles’ density in the presence and absence of risk predation cues (A). Solid and dashed trendlines depict the linear regressions for risk and no risk treatment, respectively. P- values were obtained from raw data. P- values from ANCOVA are given for
the main effect of density (D), risk (R), and density x risk interaction (D x R). Panel (B) shows predation risk main effect (mean ±SD).
Fig. 5. Tadpoles biomass regressed against conspecific density in the presence - filled symbols - and
absence - open symbols – of risk predation cues (A). Different symbols denote initial densities in each
treatment. Diamonds = 12 ind./m3; Circles = 24 ind./m3; Square = 36 ind./m3. Solid and dashed trendlines
depict the linear regressions for risk and no risk treatment, respectively. P- values were obtained from
transformed data. P- values from ANCOVA are given for the main effect of density (D), risk (R), and
22
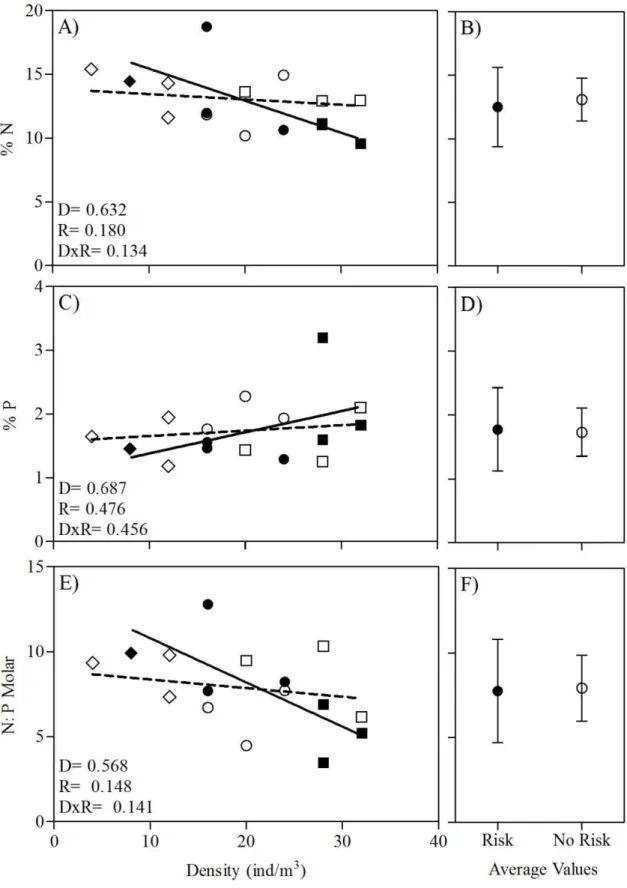
Fig. 6. Body nutrient stoichiometry regressed against conspecific density in the presence and absence of risk predation cues. (A) Body N content, (C) body P content and (E) body N: P. Solid and dashed trendlines depict the linear regressions for risk and no risk treatment, respectively. P- values were
obtained from raw data. P- values from ANCOVA are given for the main effect of density (D), risk (R),
23
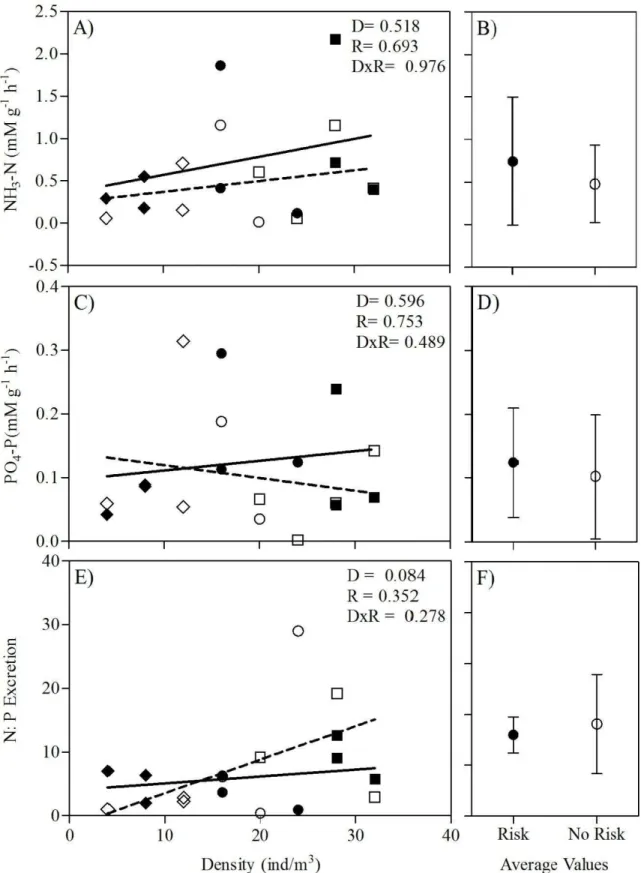
Fig. 7. Excretion nutrient stoichiometry regressed against conspecific density in the presence and absence of risk predation cues. (A) Mass- specific NH3 excretion rate, (C) mass- specific PO4-3 excretion rate and (E) N: P excretion ratio. Solid and dashed trendlines depict the linear regressions for risk and no risk treatment, respectively. P- valueswereobtained from transformed data. P- values from ANCOVA are
24
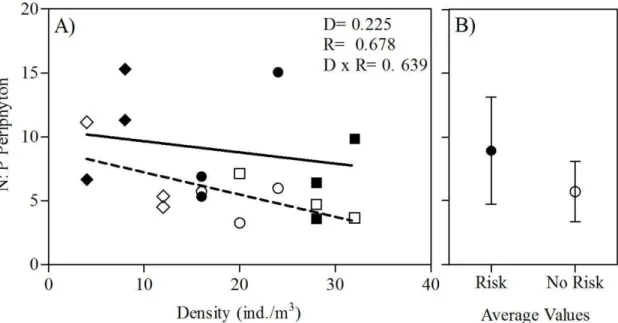
Fig. 8. Periphyton N: P ratio regressed against tadpoles density in the presence and absence of risk predation cues (A). Solid and dashed trendlines depict the linear regressions for risk and no risk treatment, respectively. P- valueswereobtained from raw data. P- values from ANCOVA are given for
the main effect of density (D), risk (R), and density x risk interaction (D x R). Panel (B) shows predation risk main effect (mean ±SD).
4. DISCUSSION
We found no interactive or individual effects of predation risk and conspecific density on tadpole growth, body and excretion nutrient content and stoichiometry. These
results show that giant water bug presence did not induce changes in Lithobates catesbeianus tadpoles’ traits neither in low nor in high tadpoles densities, contradicting
our first, second and third hypotheses. Further, no changes in tadpole nutrient excretion in response to predation risk invalidate our forth hypothesis that predation risk, via alterations in prey excretion, would indirectly cascade to positively affect the periphyton stoichiometry.
The results of this study do not allow us to evaluate the prediction of ‘risk assessment’ model. We cannot say for certain that tadpoles perceived the giant water bug presence because we did not observed significant differences between risk and no risk treatments. Some confusion arises because there are evidences that L. catesbeianus
25
changes observed, and yet they do not change their growth and stoichiometry, our results can be related to elemental homeostatic regulation of vertebrate organisms. On the other hand, if tadpoles do not perceived the predator presence there are no reason to growth and stoichiometric changes.
Vertebrates have their elemental composition affected mainly by differential phosphorous allocation to bony structures during ontogeny (Elser 2006; Elser et al. 1996; Frost & Elser 2008; Hendrixson, Sterner, & Kay 2007; Vanni et al. 2002). Tadpoles at predation risk are able to accelerate their growth to decrease their stay in a risky environment (Skelly & Werner 1990). In our experiment we observed no significant differences in tadpole’s growth and nutrient content between risk and no risk
treatment, which suggest that L. catesbeianus tadpoles did not accelerate their growth as
an anti-predator strategy. Further, tadpoles’ stoichiometric body analyses were restricted to nitrogen and phosphorous content and ratio due to shortage of biological material. Thus, was not possible assess whether the risk cue from giant water bug induced changes in carbon content as a result of energy limitation expected from predation risk/foraging trade-off (Elser et al. 1996; Rinke, Hülsmann, & Mooij 2008; Steiner 2007a). Therefore, there is the possibility that prey changes its body C content, and consequently C: N and C: P ratio.
However, it is important to highlight that tadpoles can react to the presence of predator in many ways, such as changes in their behavior, morphology or development (Werner & Anholt 1993). Several studies have reported giant water bug - induced defenses in tadpoles. For example, McIntryre, Baldwin & Flecker (2004) reported that
Rana palmipes tadpoles became less active, developed deeper tail fin and muscle, and
displayed darker pigmentation in the presence of Belostoma water bug. Yet, Kehr &
Gómez (2009) observed that Rhinella schneideri tadpoles developed longer tail length
and shorter guts when exposed to caged Belostoma elegans predator. Among
anti-predator strategies, behavioral changes are the most documented in anuran species. Guariento (2012) reported that L. catesbeianus tadpoles displayed
26
assessment’ model. ‘Risk assessment’ model also was previously supported by Van Buskirk et al. (2011) and McCoy (2007). Van Buskirk et al. (2011) showed that Rana temporaria tadpoles behaviorally respond to per capita predation risk imposed by Aeshna cyanea dragonfly larvae. McCoy (2007), in turn, showed that Hyla chrysoscelis
tadpoles display morphological changes in response to per capita predation risk
imposed by Lethocerus americanus giant water bug.
The spatial distribution of tadpoles in mesocosms observed by Guariento (2012) may have favored to the absence of growth and nutrient stoichiometry responses of L. catesbeianus tadpoles to predation risk. Fraker & Luttbeg (2012) suggest that prey
can manage its fear and predation risk by adjusting its space use. We limited the predator space use, and consequently, the risk cue by caging giant water bugs in plastic floating cages. Thus, it is possible that habitats shifts have been an effective tadpole’ defense mechanism against giant water bugs.
The fact that tadpoles can display behavioral responses to predation risk (Guariento 2012) but did not alter their growth or stoichiometry also can be related to fitness costs associated with these defenses. Previous studies states that costs to induce and to reverse behavioral defenses, as reducing activity or increasing refuge use, are low, which ensures a rapid response to threat (Relyea 2003b; Wcislo 1989). In contrast, physiological adjustments to risk, as altering nutrient body budgets, are more costly (Hawlena & Schmitz 2010b). Thus, low cost defenses should be adopted at first in attempt to mitigate the risk of predation, reducing the need to engage in costly physiological strategies/changes. This hypothesis is supported by the results found in tadpoles’ mortality analysis. Tadpole mortality was not affected by predation risk and prey density and by their interaction, suggesting that anti-predator defenses adopted by L. catesbeianus tadpoles were effective to avoid mortality.
On the other side, ‘risk assessment’ model assumes that prey investment in anti-predator defenses depends on both level of risk cue and prey density (Peacor 2003). Van Buskirk et al. (2011) showed that prey anti-predator responses to differences in the level of risk cue are more evident than to differences in prey density. This suggests that the level of risk cue play a most important role in predation risk assessment. No individual effect of predation risk on tadpole growth and stoichiometry indicates that
27
Previous studies showed that prey respond differently to different predator species (Bernard 2006; Relyea 2001a; b), and adjust their response to number of both predator and injured preys (Van Buskirk & Arioli 2002).There are evidences that anti-predator response of tadpoles to giant water bugs is weaker than anti-predator response of tadpoles to other predators (Gómez & Kehr 2011; Jara & Perotti 2009; Relyea 2001a; b, 2003a), but the reason for this differential prey response is not clear (Hettyey et al. 2011; Relyea 2001b).
Additionally, it is possible that the tadpoles have acclimated to predation risk (Barry & Syal 2012; Steiner & Van Buskirk 2009). Steiner & Van Buskirk (2009) suggest that the tadpoles acclimation to predation risk after long exposure to risk cues is a way to minimize deleterious effects of predator - induced defenses on prey fitness. They found that Rana temporaria tadpoles increase their metabolism at short-term
exposure to risk (i.e., hours). However, such change is not maintained at long-term (i.e., days, weeks). Our experiment lasted 19 days in order to simulate chronic risk of predation, in which changes in prey nutritional budget are expected (Hawlena & Schmitz 2010b). This experimental time is similar to the time used in other experiments that investigate tadpole physiological responses to long-term exposure to risk (Barry & Syal 2012; Steiner 2007a; Steiner & Van Buskirk 2009).
28 REFERENCES
Archard, G.A., Earley, R.L., Hanninen, A.F. & Braithwaite, V.A. (2012) Correlated behaviour and stress physiology in fish exposed to different levels of predation pressure. Functional Ecology, 26, 637–645.
Barry, M.J. & Syal, S. (2012) Metabolic responses of tadpoles to chemical predation cues. Hydrobiologia, 700, 267–276.
Bernard, M.F. (2006) Survival trade-offs between two predator-induced. Reports.
Ecology, 87, 340–346.
Brönmark, C. & Hansson, L. (2000) Chemical communication in aquatic systems: an introduction. Oikos, 88, 103–109.
Buskirk, J. Van & Arioli, M. (2002) Dosage response of an induced defense: How sensitive are tadpoles to predation risk? Ecology, 83, 1580–1585.
Buskirk, J. Van, Ferrari, M., Kueng, D., Näpflin, K. & Ritter, N. (2011) Prey risk assessment depends on conspecific density. Oikos, 120, 1235–1239.
Dicke, M. & Grostal, P. (2001) Chemical detection of natural enemies by arthropods: an ecological perspective. Annual Review of Ecology and Systematics, 32, 1–23.
Dickman, E.M., Newell, J.M., González, M.J. & Vanni, M.J. (2008) Light, nutrients, and food-chain length constrain planktonic energy transfer efficiency across multiple trophic levels. Proceedings of the National Academy of Sciences of the United States of America, 105, 18408–12.
Elser, J. (2006) Biological stoichiometry: a chemical bridge between ecosystem ecology and evolutionary biology. The American naturalist, 168 Suppl, S25–35.
Elser, J.J., Dobberfuhl, D.R., MacKay, N.A. & Schampel, J.H. (1996) Organism size, life history, and N: P stoichiometry. BioScience, 46, 674 – 684.
Ferland-Raymond, B., March, R.E., Metcalfe, C.D. & Murray, D.L. (2010) Prey detection of aquatic predators: Assessing the identity of chemical cues eliciting prey behavioral plasticity. Biochemical Systematics and Ecology, 38, 169–177.
Fraker, M.E., Fang, H., Cuddapah, V., McCollum, S.A., Relyea, R.A., Hempel, J. & Denver, R.J. (2009) Characterization of an alarm pheromone secreted by amphibian tadpoles that induces behavioral inhibition and suppression of the neuroendocrine stress axis. Hormones and behavior, 55, 520–529.
Fraker, M.E. & Luttbeg, B. (2012) Predator–prey space use and the spatial distribution of predation events. Behaviour, 149, 555–574.
Frost, P.C. & Elser, J.J. (2008) Biological Stoichiometry. Encyclopedia of Life Sciences,
29
Golterman, H.L., Clymo, R.S. & Ohnstad, M.A.M. (1978) Methods for Physical and Chemical Analysis of Fresh Waters. Oxford: Blackwell Scientific Publisher.
Gómez, V.I. & Kehr, A.I. (2011) Morphological and Developmental Responses of Anuran Larvae (Physalaemus albonotatus) to Chemical Cues from the Predator Moenkhausia dichoroura (Characiformes: Characidae) and Belostoma elongatum
(Hemiptera: Belostomatidae). Zoological Studies, 50, 203–210.
Guariento, R.D. (2012) Consequências Ecológicas do trade-off entre forrageamento e risco : De indivíduos a ecossistemas. Tese de Doutorado- Programa de Pós-Graduaçao em Ecologia, Universidade Federal do Rio de Janeiro (UFRJ), 185p.
Hawlena, D. & Schmitz, O.J. (2010a) Herbivore physiological response to predation risk and implications for ecosystem nutrient dynamics. Proceedings of the National Academy of Sciences of the United States of America, 107, 15503–7.
Hawlena, D. & Schmitz, O.J. (2010b) Physiological stress as a fundamental mechanism linking predation to ecosystem functioning. The American naturalist, 176, 537–56.
Hawlena, D., Strickland, M.S., Bradford, M. a & Schmitz, O.J. (2012) Fear of predation slows plant-litter decomposition. Science (New York, N.Y.), 336, 1434–8.
Hendrixson, H.A., Sterner, R.W. & Kay, A.D. (2007) Elemental stoichiometry of freshwater fishes in relation to phylogeny, allometry and ecology. Journal of Fish Biology, 70, 121–140.
Hettyey, A., Rölli, F., Thürlimann, N., Zürcher, A.-C. & Buskirk, J. Van. (2012) Visual cues contribute to predator detection in anuran larvae. Biological Journal of the Linnean Society, 106, 820–827.
Hettyey, A., Vincze, K., Zsarnóczai, S., Hoi, H. & Laurila, A. (2011) Costs and benefits of defences induced by predators differing in dangerousness. Journal of evolutionary biology, 24, 1007–19.
Holling, C. (1959) Some characteristics of simple types of predation and parasitism. The Canadian Entomologist, XCI, 385–398.
Jara, F.G. & Perotti, M.G. (2009) Toad tadpole responses to predator risk : Ontogenetic change between constitutive and inducible defenses. Journal of herpetology, 43,
82–88.
Kats, L. & Dill, L. (1998) The scent of death: chemosensory assessment of predation risk by prey animals. Ecoscience, 361–394.
Kehr, A. & Gómez, V. (2009) Intestinal, body and tail plasticity in Rhinella schneideri
30
Leroux, S. J., Hawlena, D. & Schmitz, O.J. (2012) Predation risk, stoichiometric plasticity and ecosystem elemental cycling. Proceedings. Biological sciences / The Royal Society, 279, 4183–91.
Lima, S. L. (1998) Stress and decision making under the risk of predation: recent developments from behavioral, reproductive, and ecological perspectives.
Advances in the Study of Behavior, 27, 215–290.
Lima, S.L. & Dill, L.M. (1990) Behavioral decisions made under the risk of predation: a review and prospectus. Canadian Journal of Zoology, 68, 619–640.
McCoy, M.W. (2007) Conspecific density determines the magnitude and character of predator-induced phenotype. Oecologia, 153, 871–8.
McCoy, M.W., Touchon, J.C., Landberg, T., Warkentin, K.M. & Vonesh, J.R. (2012) Prey responses to predator chemical cues: disentangling the importance of the number and biomass of prey consumed. PloS one, 7, e47495.
McIntyre, P.B., Baldwin, S. & Flecker, A.S. (2004) Effects of behavioral and morphological plasticity on risk of predation in a Neotropical tadpole. Oecologia, 141, 130–8.
McPeek, M., Grace, M. & Richardson, J. (2001) Physiological and behavioral responses to predators shape the growth/predation risk trade-off in damselflies. Ecology, 82,
1535–1545.
Peacor, S. D. (2006) Behavioural response of bullfrog tadpoles to chemical cues of predation risk are affected by cue age and water source. Hydrobiologia, 573, 39–
44.
Peacor, S. D. (2003) Phenotypic modifications to conspecific density arising from predation risk assessment. Oikos, 100, 409–415.
Peacor, S. & Werner, E. (2000) Predator effects on an assemblage of consumers through induced changes in consumer foraging behavior. Ecology, 81, 1998–2010.
Pulliam, H.R. (1973) On the advantages of flocking. Journal of theoretical biology, 38,
419–22.
R Development Core Team (2006) R: A Language and Environment for Statistical Computing. R Foundation for Statistical Computing, Vienna, Austria.
Relyea, R. (2001a) Morphological and behavioral plasticity of larval anurans in response to different predators. Ecology, 82, 523–540.
31
Relyea, R. (2002a) Competitor-induced plasticity in tadpoles: consequences, cues, and connections to predator-induced plasticity. Ecological Monographs, 72, 523–540.
Relyea, R. (2002b) Costs of phenotypic plasticity. The American naturalist, 159, 272–
82.
Relyea, R. (2003a) How prey respond to combined predators: a review and an empirical test. Ecology, 84, 1827–1839.
Relyea, R. (2003b) Predators come and predators go: the reversibility of predator-induced traits. Ecology, 84, 1840–1848.
Richardson, J.M.L. (2001) A comparative study of activity levels in larval anurans and response to the presence of different predators. Behavioral Ecology, 12, 51–58.
Rinke, K., Hülsmann, S. & Mooij, W.M. (2008) Energetic costs, underlying resource allocation patterns, and adaptive value of predator-induced life-history shifts.
Oikos, 117, 273–285.
Roberts, G. (1996) Why individual vigilance declines as group size increases. Animal Behaviour, 51, 1077–1086.
Saidapur, S.K., Veeranagoudar, D.K., Hiragond, N.C. & Shanbhag, B. a. (2009) Mechanism of predator–prey detection and behavioral responses in some anuran tadpoles. Chemoecology, 19, 21–28.
Schaus, M.H., Vanni, M.J., Wissing, T.E., Bremign, M.T., Garvey, J.A. & Stein, R.A. (1997) Nitrogen and phosphorus excretion by detritivorous gizzard shad in a reservoir ecosystem. Limnology and Oceanography, 42, 1386–1397.
Schmitz, O.J. (2008a) Effects of predator hunting mode on grassland ecosystem function. Science (New York, N.Y.), 319, 952–4.
Schmitz, O.J. (2008b) Herbivory from individuals to ecosystems. Annual Review of Ecology, Evolution, and Systematics, 39, 133–152.
Schoeppner, N.M. & Relyea, R. a. (2005) Damage, digestion, and defence: the roles of alarm cues and kairomones for inducing prey defences. Ecology letters, 8, 505–12.
Schoeppner, N. & Relyea, R. (2009) When should prey respond to consumed heterospecifics? Testing hypotheses of perceived risk. Copeia, 2009, 190–194.
Skelly, D. & Werner, E. (1990) Behavioral and life-historical responses of larval american toads to an odonate predator. Ecology, 71, 2313–2322.
32
Steiner, U.K. (2007b) Linking antipredator behaviour, ingestion, gut evacuation and costs of predator-induced responses in tadpoles. Animal Behaviour, 74, 1473–
1479.
Steiner, U.K. & Buskirk, J. Van. (2009) Predator-induced changes in metabolism cannot explain the growth/predation risk tradeoff. PloS one, 4, e6160.
Sterner, R.W. & Elser, J.J. (2002) Ecological Stoichiometry: The Biology of Elements from Molecules to the Biosphere. Princeton University Press.
Strickland, J.D.. & Parsons, T.R. (1972) A practical handbook of seawater analysis.
Vanni, M.J. (2002) Nutrient cycling by animals in freshwater ecosystems. Annual Review of Ecology and Systematics, 33, 341–370.
Vanni, M.J., Flecker, A.S., Hood, J.M. & Headworth, J.L. (2002) Stoichiometry of nutrient recycling by vertebrates in a tropical stream: linking species identity and ecosystem processes. Ecology Letters, 5, 285–293.
Vonesh, J.R. & Warkentin, K.M. (2006) Opposite shifts in size at metamorphosis in response to larval and metamorph predators. Reports. Ecology, 87, 556–562.
Wcislo, W. (1989) Behavioral environments and evolutionary change. Annual Review of Ecology and Systematics, 20, 137–169.
Werner, E. & Anholt, B. (1993) Ecological consequences of the trade-off between growth and mortality rates mediated by foraging activity. American Naturalist, 142, 242–272.
Werner, E. & Peacor, S. (2003) A review of trait-mediated indirect interactions in ecological communities. Ecology, 84, 1083–1100.
33 APPENDIX A
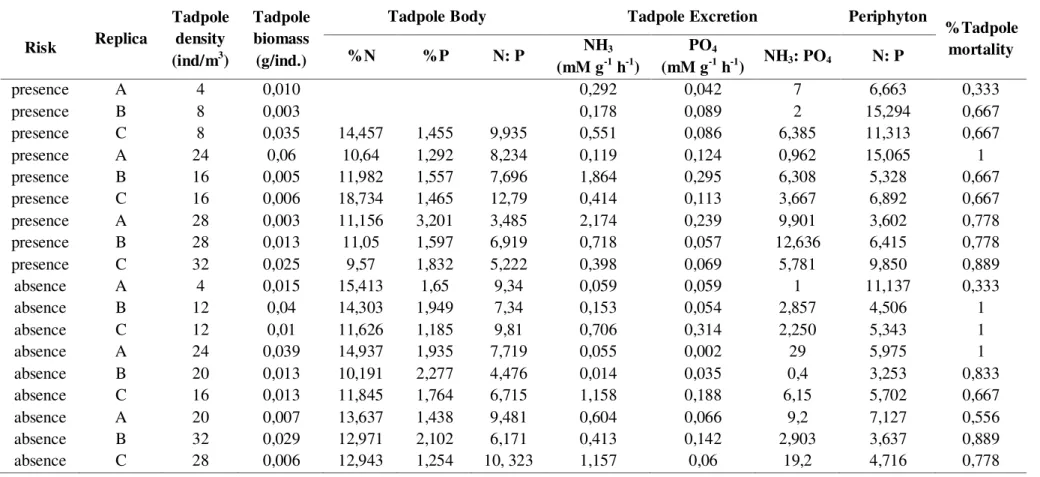
Table 2. Experiment raw data. The header was changed to perform ANCOVA in R.
Risk Replica
Tadpole density (ind/m3)
Tadpole biomass (g/ind.)
Tadpole Body Tadpole Excretion Periphyton
%Tadpole mortality
%N %P N: P NH3
(mM g-1 h-1)
PO4
(mM g-1 h-1) NH3: PO4 N: P
presence A 4 0,010 0,292 0,042 7 6,663 0,333
presence B 8 0,003 0,178 0,089 2 15,294 0,667
presence C 8 0,035 14,457 1,455 9,935 0,551 0,086 6,385 11,313 0,667
presence A 24 0,06 10,64 1,292 8,234 0,119 0,124 0,962 15,065 1
presence B 16 0,005 11,982 1,557 7,696 1,864 0,295 6,308 5,328 0,667
presence C 16 0,006 18,734 1,465 12,79 0,414 0,113 3,667 6,892 0,667
presence A 28 0,003 11,156 3,201 3,485 2,174 0,239 9,901 3,602 0,778
presence B 28 0,013 11,05 1,597 6,919 0,718 0,057 12,636 6,415 0,778
presence C 32 0,025 9,57 1,832 5,222 0,398 0,069 5,781 9,850 0,889
absence A 4 0,015 15,413 1,65 9,34 0,059 0,059 1 11,137 0,333
absence B 12 0,04 14,303 1,949 7,34 0,153 0,054 2,857 4,506 1
absence C 12 0,01 11,626 1,185 9,81 0,706 0,314 2,250 5,343 1
absence A 24 0,039 14,937 1,935 7,719 0,055 0,002 29 5,975 1
absence B 20 0,013 10,191 2,277 4,476 0,014 0,035 0,4 3,253 0,833
absence C 16 0,013 11,845 1,764 6,715 1,158 0,188 6,15 5,702 0,667
absence A 20 0,007 13,637 1,438 9,481 0,604 0,066 9,2 7,127 0,556
absence B 32 0,029 12,971 2,102 6,171 0,413 0,142 2,903 3,637 0,889
34 Scripts to carry out the ANCOVA in R:
1) Tadpoles’ mortality:
Data<-read.table("Exp.txt",h=T)
attach(Data)
Mortality<-lm(mort~risk*dens)
shapiro.test(residuals(Mortality))
bartlett.test(mort~Risco*dens)
drop1(Mortality,~.,test="F")
2) Tadpoles’ Growth:
biomass_ind_sqrt<-sqrt(biomass_ind)
BioInd<-lm(biomass_ind_sqrt~risk*dens)
plot(BioInd)
shapiro.test(residuals(BioInd))
bartlett.test(biomass_ind_sqrt~risk*dens)
drop1(BioInd,~.,test="F")
3) Tadpoles’ body stoichiometry: a) N content
Nitrogen<-lm(N~risk*dens)
plot(Nitrogenio)
shapiro.test(residuals(Nitrogen))
bartlett.test(N~risk*dens)
drop1(Nitrogen,~.,test="F")
b) P content
Phosphorous<-lm(P~risk*dens)
plot(Phosphorous)
shapiro.test(residuals(Phosphorous))
bartlett.test(P~risk*dens)
drop1(Phosphorous,~.,test="F")
c) N: P ratio
RatioNP<-lm(NP~risk*dens)
shapiro.test(residuals(RatioNP))
35 drop1(RatioNP,~.,test="F")
4) Tadpoles’ excretion stoichiometry: a) NH3
N_exc_sqrt<-sqrt(N_exc)
NH3_2<-lm(N_exc_sqrt~risk*dens)
shapiro.test(residuals(NH3_2)
bartlett.test(N_exc_sqrt~risk*dens)
drop1(NH3_2,~.,test="F")
b) PO4
P_exc_sqrt<-sqrt(P_exc)
PO4_1<-lm(P_exc_sqrt~risk*dens)
shapiro.test(residuals(PO4_1
bartlett.test(P_exc_sqrt~risk*dens)
drop1(PO4_1,~.,test="F")
c) NH3: PO4
NP_exc_sqrt<-sqrt(NP_exc)
NPratio_1<-lm(NP_exc_sqrt~risk*dens)
shapiro.test(residuals(NPratio_1))
bartlett.test(NP_exc_sqrt~ risk*dens)
drop1(NPratio_1,~.,test="F")
5) Periphyton stoichiometry:
Periphyton<-lm(NP_per~risk*dens)
shapiro.test(residuals(Periphyton))
bartlett.test(NP_per~risk*dens)
plot(Periphyton)
36 APPENDIX B
Table 3. Comparison of the N, P concentrations and N: P ratio (mean ± SD) in water column among treatments at the beginning of experiment. (*) denote treatments that are significantly different among each other (2- way ANOVA, Tukey post hoc test; P < 0, 05).
Tadpole initial density
(ind./ m3) Risk No Risk
a) [N]
12 82.656 (±1.926) 82.910 (±1.979)
24 84.675 (±1.514)* 77.785 (±4.3)*
36 86.623 (±0.172) 81.996 (±3. 876)
b) [P]
12 7.40 (±0.646) 5.3 (±14.690)
24 7.33 (±0. 441) 7 (±0.513)
36 7.47 (±0.191) 7.33 (±1,705)
c) N: P molar
12 11.191(± 0.645) 20. 532(±14.690)
24 11.563(±0.44) 11.144(±0.513)
