Inflammatory Bowel Disease by Gene Expression
Profiling
Trinidad Montero-Mele´ndez1, Xavier Llor2, Esther Garcı´a-Planella3, Mauro Perretti1, Antonio Sua´rez4*
1The William Harvey Research Institute, Barts and The London School of Medicine, Queen Mary University of London, London, United Kingdom,2Digestive Diseases and Nutrition Section, Department of Medicine and Cancer Center, University of Illinois at Chicago, Chicago, United States of America,3Hospital Santa Creu i Sant Pau, Universitat Auto´noma de Barcelona, Barcelona, Spain,4Centro de Investigacio´n Biome´dica, Universidad de Granada, Armilla, Spain
Abstract
Background:Improvement of patient quality of life is the ultimate goal of biomedical research, particularly when dealing with complex, chronic and debilitating conditions such as inflammatory bowel disease (IBD). This is largely dependent on receiving an accurate and rapid diagnose, an effective treatment and in the prediction and prevention of side effects and complications. The low sensitivity and specificity of current markers burden their general use in the clinical practice. New biomarkers with accurate predictive ability are needed to achieve a personalized approach that take the inter-individual differences into consideration.
Methods:We performed a high throughput approach using microarray gene expression profiling of colon pinch biopsies from IBD patients to identify predictive transcriptional signatures associated with intestinal inflammation, differential diagnosis (Crohn’s disease or ulcerative colitis), response to glucocorticoids (resistance and dependence) or prognosis (need for surgery). Class prediction was performed with self-validating Prophet software package.
Results:Transcriptional profiling divided patients in two subgroups that associated with degree of inflammation. Class predictors were identified with predictive accuracy ranging from 67 to 100%. The expression accuracy was confirmed by real time-PCR quantification. Functional analysis of the predictor genes showed that they play a role in immune responses to bacteria (PTN, OLFM4 and LILRA2), autophagy and endocytocis processes (ATG16L1, DNAJC6, VPS26B, RABGEF1, ITSN1 and TMEM127) and glucocorticoid receptor degradation (STS and MMD2).
Conclusions:We conclude that using analytical algorithms for class prediction discovery can be useful to uncover gene expression profiles and identify classifier genes with potential stratification utility of IBD patients, a major step towards personalized therapy.
Citation:Montero-Mele´ndez T, Llor X, Garcı´a-Planella E, Perretti M, Sua´rez A (2013) Identification of Novel Predictor Classifiers for Inflammatory Bowel Disease by Gene Expression Profiling. PLoS ONE 8(10): e76235. doi:10.1371/journal.pone.0076235
Editor:Raffaele A. Calogero, University of Torino, Italy
ReceivedJune 10, 2013;AcceptedAugust 26, 2013;PublishedOctober 14, 2013
Copyright:ß2013 Montero-Mele´ndez et al. This is an open-access article distributed under the terms of the Creative Commons Attribution License, which permits unrestricted use, distribution, and reproduction in any medium, provided the original author and source are credited.
Funding:This study was funded by Fundacio´ la Marato´ de TV3 (031531) and Spanish Health Ministry – Carlos III Institute (PI61550). The funders had no role in study design, data collection and analysis, decision to publish, or preparation of the manuscript.
Competing Interests:The authors have declared that no competing interests exist. * E-mail: asuarez@ugr.es
Introduction
Crohn’s disease (CD) and ulcerative colitis (UC), the two main clinical forms of IBD, are chronic relapsing inflammatory disorders of the gastrointestinal tract resulting from an inappro-priate and continuous inflammatory response to commensal microbes in genetically susceptible hosts, although the exact etiology remains unknown [1]. CD and UC are distinct but heterogeneous entities, frequently showing overlapping symp-toms/features with systemic and extra-intestinal complications that render the diagnosis difficult and inaccurate. Furthermore, the degree of heterogeneity within both forms of IBD is also high, and patients with the same diagnosis, i.e. CD or UC, may have markedly different outcomes. Most importantly, the response to therapy cannot be predicted at diagnosis and therapeutic approaches are individualized according to the symptomatic
As a consequence of the heterogeneity of IBD patients, a comprehensive evidence-based search of novel biomarkers for an appropriate patient stratification that account for the inter-individual differences in severity, drug efficacy, side effects or prognosis would help guide clinicians in the management of patients with IBD and represent a major step towards personalized medicine. Although immunological markers like anti-Saccharomyces cerevisiae antibodies or genetic variants of NOD2 are statistically associated with prognosis of surgical intervention in IBD [5], these markers often lack sensitivity or are not frequent enough to be clinically useful. The search of new biomarkers of IBD course can benefit from molecular approaches like gene expression profiling [6], which has successfully been used and translated into clinical practice. Van de Vijver et al discovered a 70-genes prognosis classifier of the clinical outcome of breast cancer patients [7]. In ovarian cancer, Bonome et al defined a predictor gene set of survival [8]. With the same strategy, Mckinney et al identified a gene expression signature with prognosis predictor value for antineutrophil cytoplasmic antibodies-associated vasculitis [9].
These studies reflect the intense effort on the development of new tools and algorithms that go far beyond the classical selection of a number of up- or down- regulated genes to reliably translate mathematical and statistical analyses into biological meaning. Accordingly, we tested a novel analytical approach [10] to study the gene expression signature of intestinal tissues from IBD patients aiming at identifying new candidate prognostic genes associated to clinically relevant parameters. We hypothesized that correlation with clinical prognostic parameters may group samples with similar gene expression profiles and help identify potential biomarkers useful for IBD stratification with higher reliability.
Methods
Ethics statement
Individuals were recruited either at Hospital Santa Creu i Sant Pau (Barcelona, Spain) or at the University of Illinois Hospital (Chicago, IL) after a written informed consent was obtained. The Institutional Review Board of the University of Illinois at Chicago and the Comite´ E´ tico de Investigacio´n Clı´nica del Hospital Santa Creu i Sant Pau approved the protocols.
Patients
For this study we enrolled 15 patients with an established diagnosis of ulcerative colitis, 13 patients with Crohn’s disease and 7 healthy individuals with a normal colon referred for colorectal cancer screening. Disease activity was assessed based on parameters such as: abdominal pain, bowel consistency and frequency, blood in stool, nausea/vomiting, constitutional symptoms, extracolonic manifestations, presence of abdominal mass, blood inflammatory markers, and colonic biopsy results. Other data collected includes: age at diagnosis, disease extension, disease-related surgery, tobacco consumption, co-morbidities, medications, and need of or response to immunomodulators (Azathiopurine or 6-Mercaptopurine), In-fliximab, and glucocorticoids. A summary of these data is shown in Table S1. Patients were classified as glucocorticoid-dependent when they responded to glucocorticoids but experienced loss of clinical response when glucocorticoids were tapered to less than 30 mg/day or less, or relapse within the first 3 months after glucocorticoids are stopped. Patients were classified as glucocorticoid-resistant when there was a lack of meaningful clinical response to glucocorticoids up to doses of prednisone 1 mg/kg/day (or equivalent) within 30 days for oral therapy or 7 days for IV therapy. Patients were purposefully selected for this study to represent different clinical phenotypes.
Isolation of RNA and microarray hybridization
Four endoscopic pinch biopsies of macroscopically un-inflamed mucosa were taken from ascending colon. One biopsy was fixed in 4% buffered formaldehyde. Total RNA was extracted from three pooled biopsies using the RNeasy Micro kit (Qiagen, Crawley, UK). All sample labeling, hybridization, staining and scanning procedures were carried out using Affymetrix standard protocols and equipment (Affymetrix, Santa Clara, CA). Briefly, double-stranded cDNA was synthesized from 2mg of total RNA using the One-Cycle cDNA Synthesis kit. In vitro transcription was performed using the IVT Labelling kit and the cRNA obtained was checked for quality and purified with the GeneChip Sample Cleanup Module. 15mg of cRNA were fragmented and hybridized on Human Genome U133 plus 2.0 arrays for 16 hours at 45uC. Arrays were then washed and stained with streptavidin-phycoer-ythrin and images scanned and analyzed with Affymetrix GeneChip Command Console (AGCC 1.1). Spike controls (BioB, BioC, BioD and Cre) were used as quality controls. Following MIAME recommendations, microarray data were deposited in
Gene Expression Omnibus database (accession number
GSE36807) where protocols, normalization methods and original raw data are publicly available.
Data normalization, filtering and clustering
Bioconductor software version 2.15 was used for data normal-ization (affyPLM package, RMA method) and quality controls (% present genes, average background, scale factor GAPDH 3’/5’ ratio and spike-in controls; simpleAffy package). Data analysis and filtering were made with Spotfire DecisionSite v9.0. Normalized intensity values were used to obtain the fold change values, calculating the log2 of the ratio [average of the cases replicates/
average of the control replicates]. Genes with a fold change.1 or ,21 and p,0.05 (t-test) were considered differentially expressed. Hierarchical clustering (Unweighted Pair Group Method with Arithmetic Mean and Euclidean distance similarity measure) and principal component analysis were also performed with Spotfire DecisionSite v9.0.
Functional analysis and predictor discovery
Quantitative real time-PCR validation
cDNA was synthesized using 1mmg of total RNA with the SuperScript III Reverse Transcriptase (Invitrogen, Paisley, UK). Real time-PCR was performed with 200 ng of cDNA per well and Power SYBR Green PCR Master Mix (Applied Biosystems, Warrington, UK), using the ABI Prism 7900HT Sequence Detection System. The full list of Quantitect primers (QIAGEN, Crawley, UK) used is reported in Table S2. Dissociation step was included to confirm the absence of un-specific products. Data (n = 3) is reported asDCt using GAPDH as endogenous control.
Statistical analysis
Microarray data was analyzed using t-test. Clinical data was analyzed by Fisher’s exact test or Chi-square test for trend when appropriate. Real time-PCR was analyzed by Pearson correlation and linear regression tests. Predictors were analyzed by two-way ANOVA. In all cases p,0.05 was considered statistically significant.
Results
Microarray data analysis groups high and low inflammation subclasses of CD and UC patients
An unsupervised hierarchical clustering using all genes represented in the chip was run in order to cluster the 35 subjects on the basis of their similarity and assess the degree of heterogeneity among samples. Although healthy samples seem to cluster together, the variation in gene expression patters in CD and UC was more complex, underlining the high degree of heterogeneity within IBD samples (Figure 1A). It is usually presumed that relatively few genes may distinguish between classes, and hence the differences between groups can be masked when using a whole genome clustering approach, as the vast majority of them would remain unchanged. Therefore, in order to study the heterogeneity within CD and UC patients, we performed a hierarchical clustering using the differentially expressed genes between CD and UC compared to healthy controls (261 and 1255 probes respectively). Surprisingly, in both cases samples were stratified in two distinct patient subgroups (Figure 1B) that were defined CD1 and UC1 as ‘‘Low Inflammation’’ subtypes and CD2 and UC2 as ‘‘High Inflam-mation’’ subtypes on the basis of the following findings. Functional annotation of the genes reveals up-regulation on metabolism or transport genes in the subgroups so-called CD1 and UC1, while up-regulation of predominantly inflammatory genes in the groups designated as CD2 and UC2. Principal component analysis (Figure 1C) also discriminated between the subgroups identified, and the association of these subgroups with clinical features further relates CD2 and UC2 with higher degree of disease activity (Figure 1D). Detailed clinical data is reported in Table S1. The number of differentially expressed genes between groups (Figure 1E) suggests an association between ‘‘more disease’’ profile with CD2 and UC2 as the number of altered genes for CD1 and UC1 respect to healthy controls was 347 and 287 probes respectively, but 1,324 for CD2 and 2,590 for UC2. The low number of differentially expressed genes between CD and UC (389) and between CD2 and UC2 (only 79) was truly striking, emphasizing the close pathogenic nature of CD and UC. The top 10 up- and down-regulated genes between CD1vs. CD2 and UC1vs. UC2 are reported in Table S3.
Class-predictor analysis identifies sets of genes that discriminate between high and low inflammation subgroups of CD and UC
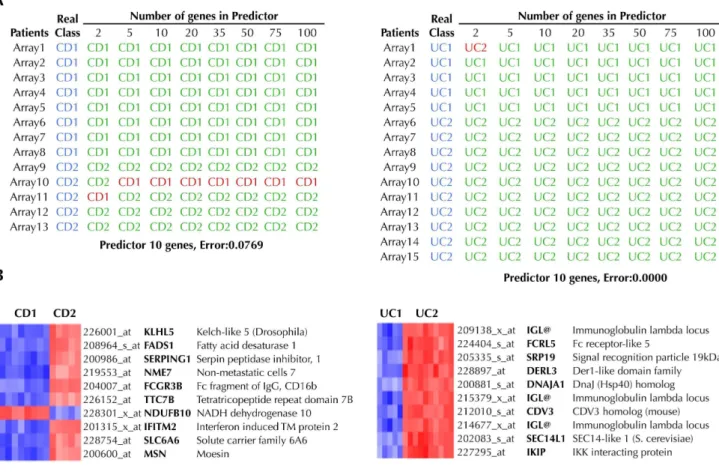
In order to discover new biomarkers related to the degree of intestinal inflammation we used the software package Prophet to identify the subset of genes that best discriminated CD1 from CD2 and UC1 from UC2, i.e. a predictor classifier of high and low inflammation activity. We searched for the smallest list of genes to accurately classify patients into their respective subgroups. Figure 2A shows the results from the cross-validation analysis. In the case of CD, there was a set of 5 genes that predicted if a sample belonged to group CD1 or CD2 with 92% accuracy. Interestingly, most of the predictors for UC had an accuracy of 100%. The expression of the genes included in the selected predictors (Figure 2B), was investigated in the public microarray repository GEO database. As shown in Table S4 the gene expression changes follow the same trend reported in other microarray experiments. Using this approach, previous reports confirmed the utility of class-predictor identification by running more microarray analysis in new patients [7]. However, the translation of these findings into clinical practice would require a more accessible technique than microarray profiling, such as quantitative real time-PCR. There-fore, a total of 42 genes (Table S2) were selected to analyze the general agreement between our microarray and PCR data. The correlation between both techniques was found to be optimal (Figure 3) with a correlation of 84% and 91% for CD and UC respectively. Then, to validate our predictors by using PCR data instead of microarray data, we performed the predictor analysis using Prophet and available primers (see Table S2). The results showed exactly the same degree of predictor accuracy (CD1vs. CD2, 92.3%; UC1vs.UC2, 100%) as obtained with microarray data. These data suggest that real time-PCR analyses performed on microarray-based predictors can replicate the results with similar accuracy and hence can be a simple, economical and reliable approach for the analysis of class predictors.
Identification of new predictor genes associated with clinical parameters and IBD phenotypes
Once our approach had been validated, we focused on identifying new biomarkers related to relevant clinical parameters of IBD. Patients were classified according to glucocorticoid (GC) sensitivity, GC-dependency, IBD phenotype, if they had suffered IBD-related intestinal surgery or if they show high or low inflammation phenotype according to their gene expression profile. The statistical association among these subgroups of patients is shown in Figure S1. No significant association was observed among the different groups except for GC-sensitivity that was significantly associated with need of surgery and degree of inflammation. This result is not surprising because GC-resistance is usually associated with worse outcome and increased risk for surgery. Figure 4 summarizes the best sets of genes (i.e. sets with the fewest number of genes and the lowest prediction error) found to correctly classify patients according to GC-sensitivity (Figure 4A, 35 genes, 82% accuracy), GC-dependence (Figure 4B, 10 genes, 82% accuracy) and need of intestinal surgeries (Figure 4C, 10 genes, 79% accuracy). Two-way ANOVA with Bonferroni multiple testing correction was performed to assess if the difference in gene expression between the groups was significant. All genes showed apvalue lower than 0.01.
controls), CDvs.H, UCvs.H, CDvs.UC, CD1vs.UC1 and CD2 vs. UC2. Figure 5 summarizes the best sets of genes found to correctly classify patients between these groups. The predictor classifiers of IBD forms vs. healthy samples showed the highest accuracy (.90%) but it dropped to 79% (CDvs.UC), 85% (CD1 vs.UC1) and 68% (CD2vs.UC2). This result underlines the high similarity of both conditions at the gene expression level. The best predictor of CDvs. UC consisted of 5 genes with a prediction error of 21% (Figure 5D). A set of 10 genes was found to be the best predictor between the ‘‘High Inflammation’’ subgroups (CD2 and UC2) although the prediction error increased to 33% (Figure 5F). The lowest prediction error (15%) was obtained with ‘‘Low Inflammation’’ samples, i.e. CD1 vs. UC1 (Figure 5E). Interest-ingly, more than one probe for the same gene was identified in several predictor sets, a fact that may increase the significance of that particular gene as a potential biomarker. This was the case for the genes that encode for pleiotrophin (PTN), copine VIII (CPNE8), NAD(P)H dehydrogenase quinone 2 (NQO2) and
EFR3 homolog A (EFR3A). OLFM4 and PTN were up-regulated in the predictor set that discriminated healthy controls from UC and CD patients (Figure 5A-C) (Figure 5D-F), suggesting a common biological role for OLFM4 and PTN in both forms of IBD. NQO2 and CPNE8 were identified as classifiers that discriminate CDvs. UC and CD1 vs. UC1 (Figure 5D and E), suggesting a potential utility as biomarkers for IBD diagnosis.
Discussion
The ability to predict an individual’s clinical course is probably one of the major causes for concern for IBD patients, as it implies the appropriate choice of therapeutic tools. The response to therapy cannot be predicted at diagnosis and therapeutic approaches are individualized according to the symptomatic response and tolerance to medical intervention. Although existing serologic and fecal biomarkers can help diagnose and guide therapeutic choices [5] sensitivity, specificity and overall usefulness Figure 1. Discovery of Crohn’s disease (CD) and ulcerative colitis (UC) inflammatory subtypes by gene expression profiling.(A) Unsupervised hierarchical clustering of UC (blue), CD (red) and healthy controls (green) cases using the 54,675 probes contained in the chip. Up-regulated genes are shown in red and down-Up-regulated genes in green. (B) Supervised hierarchical clustering of CD cases or UC cases using differentially expressed genes between CD and healthy (261 probes) and UC and healthy (1255 probes) respectively. This process defined two subgroups for both CD and UC cases. Functional analyses were performed using PANTHER Classification System. Examples of genes of each category are shown. (C) Clustering of samples using principal component analysis: CD1 (pink), CD2 (red), UC1 (light blue), UC2 (dark blue), healthy controls (green). (D) Association between clinical characteristics and CD and UC subtypes. Data represents the proportion of patients of each disease subtype included in different clinical variables, *p,0.05, Fisher exact test, CD1vs.CD2 or UC1vs.UC2. Complete clinical data is provided in Table S1. (E)
Figure 2. Identification of predictive classifiers of ‘‘High’’ and ‘‘Low’’ inflammation subtypes of Crohn’s disease (CD) and ulcerative colitis (UC).(A) A class predictor was built for both CD and UC using the tool Prophet and the 54,675 probes contained in the chip, using the leave-one-out cross-validation strategy. For each predictor, patients that were correctly classified are shown green, while those patients that the predictor failed to classify correctly are shown in red. (B) Based on the accuracy of each classifier, a 10-gene predictor was selected in both cases, which were able to accurately classify 92% of CD patients and 100% of UC patients. Up-regulated genes are shown in red and down-regulated in blue. doi:10.1371/journal.pone.0076235.g002
Figure 3. Confirmation of the predictive classifiers of ‘‘High’’ and ‘‘low’’ inflammation subtypes of Crohn’s disease (CD) and ulcerative colitis (UC) by quantitative real time-PCR.A total of 43 genes (including the predictors) were selected for real time-PCR validation of the microarray data in CD (A) and UC (B). Scatter plots show the correlation between microarray (fluorescence intensity, FI) and PCR (DCt value respect to the endogenous GAPDH, DCt) data, validating microarray results. The tables show the predictions obtained with the selected set of genes obtained from the microarray analysis using the PCR data. For each predictor, patients that were correctly classified are shown in green while those patients where the predictors failed to classify are shown in red. The classification accuracy obtained with PCR data was the same as the one obtained with the microarray data.
are not well established and their application in patient stratification is still debated. From the genetic perspective, a number of genetic markers have been associated with several clinical features, but to date, only the thiopurine S-methyltrans-ferase genotyping test to assess toxicity of thiopurine has been translated into IBD clinical practice [12].
Whereas gene expression profiling has been successfully used to predict metastasis and response to chemotherapy in oncology, they have generally not detected signatures with equivalent prognostic value in IBD and low, if any, inter-translational coincidence between their transcriptional signatures can be found. Heteroge-neous results may be due to confounding factors such as disease heterogeneity, racial lineage, variability in sample location, extraction procedure, cellular composition and differences in microarray platform and normalization algorithm. Despite these difficulties, efforts to reduce sample variability and the application of new tools and algorithms, that go far beyond the classical selection of a number of up- or down-regulated genes, to provide a small set of classifier genes may reliably translate mathematical and statistical analyses into clinical practice [13]. Indeed, Leeet al recently identified a classifier set of genes that predict prognosis in IBD patients [14]. CD and UC patients were stratified into two
subgroups on the basis of CD8+T cell gene expression profiling which correlated with the course of the disease.
Using the same strategy of class prediction, we set out to explore whether whole-gene expression profiling may provide clinically relevant biomarkers for IBD. This hypothesis aims at the selection of the smallest set of genes that accurately classified IBD subgroups using new in silico analyses. As in Lee et al [14], a hierarchical clustering of our IBD patients identified 2 distinct populations within CD and UC patients on the basis of their gene expression profile, which correlated with the degree of inflammation according to our functional analysis, clinical data and differentially expressed genes associated to each subgroup. It is interesting that our data confirm the existence of this gene expression signature associated with a more aggressive disease behavior. Our strategy was validated with the identification of the smallest set of genes that best discriminated between high (CD2, UC2) or low (CD1, UC1) inflammation phenotypes. A predictor set of 5 genes was identified that classified CD patients into high or low inflammation phenotypes with 92% of samples correctly classified. The positive and negative predictive values were 100 and 88% respectively; sensitivity was 80% and specificity 100%. In the case of UC, a 10-gene set was also identified as predictive for UC patients, with Figure 4. Systematic search for new predictors associated with clinical variables.Predictors were built using the tool Prophet and the 54,675 probes contained in the microarray, using the leave-one-out cross-validation strategy, to identify classifiers genes for glucocorticoid sensitivity (A), glucocorticoid dependency (B) or need for surgery (C). Data are represented as box and whiskers plots, where the error bars designate the smallest and largest observations and dots designate the outliers. Data was analyzed by two-way ANOVA followed by Bonferroni post test,pvalues
100% sensitivity and specificity. Notably, none of these genes was found among the top up- or down-regulated genes with fold change (.1 or ,21) and p-value (,0.05). This observation indicates that the classical approach of selecting a list of differentially expressed genes for classification studies in IBD may not be appropriate and possibly explain the lack of success in defining and validating biomarkers. We also observed that, rather than a big difference (i.e. in fold change), the consistency among samples may be a more relevant parameter to identify a good biomarker, as most of the predictors discovered in this work showed apvalue,0.001 despite a modest fold change. Equally important for a good biomarker is that it can be easily measured. We quantified the expression of 42 selected genes (including those in the predictor sets) in the 35 subjects included in this study (i.e. more than 1,400 measurements). The correlation between real time-PCR and microarray data was highly concordant (84% and 92% for CD and UC, respectively). This observation validated the accuracy of the gene expression data in our experimental procedure.
The high/low inflammation predictors can be informative and provide clues to IBD pathogenesis. Our aim, however, was to identify clinically relevant predictor genes to classify patients according to GC-sensitivity, GC-dependence, need for surgery and diagnosis. We successfully identified gene panels that discriminate between these conditions. In view of the potential heterogeneity and complexity of the mechanisms contributing to GC response and its potential impact on the natural history of IBD, it is noteworthy that pathway analysis identified autophagy and endocytosis processes in the 35 genes set of GC-sensitivity predictor (sensitivity and specificity of 33% and 95% respectively). ATG16L1 along with other 5 genes are involved in endocytosis
processes (DNAJC6, VPS26B, RABGEF1, ITSN1 and
TMEM127). ATG16L1, a reported susceptibility gene for IBD, controls autophagy, a crucial process in the resistance against infection and removal of intracellular microbes. Interestingly, Bonapace et al found that activation of autophagy was able to resensitize GC-resistant leukemia cells [15]. Accordingly, ATG16L1 was down-regulated in GC-resistant patients, which might lead us to speculate that induction of autophagy might help to overcome GC-resistance in IBD patients, as it happens in leukemia. Other genes encoding for steroid sulfatase (STS) and MDM2 oncogene E3 ubiquitin protein ligase, both involved in the proteosomal degradation of the GC receptor [16], may also play a role in the mechanisms leading to GC-resistance. CD36 and LILRA2 (leukocyte immunoglobulin-like receptor, subfamily A with TM domain, member 2) were included in the predictor set for need of surgery (sensitivity and specificity of 50% and 85% respectively). Deficiency of CD36 scavenger receptor, mainly expressed in macrophages, has been associated with a more aggressive colitis in mice [17]. LILRA2 up-regulation is also worth mentioning as this protein induces cytokine production by monocytes while reducing their phagocytic ability [18] and correlates with disease severity in rheumatoid arthritis [19]. The best predictor from our study was able to distinguish IBD from healthy subjects with 97% accuracy with only 5 probes (sensitivity and specificity of 100% and 86% respectively), 2 of them
representing the gene PTN (pleiotrophin) which has already been described to be down-regulated in CD patients [20]. Pleiotrophin controls several processes such as angiogenesis or cell proliferation but it also exerts strong antibacterial activity [21], suggesting another innate immune mechanism deregulated in IBD. The same accounts for the glycoprotein olfactomedin 4 (OLFM4), up-regulated in both forms of IBD according to our data, that is secreted into mucus [22] and acts by inhibiting immune responses againstHelicobacter pylori, hence contributing to the persistence of infection by a mechanism involving NOD1 and NOD2 [23].
Another ramification of our study was to identify predictor sets that would discriminate between CD and UC. The accuracy dropped when we built predictor sets to discriminate between CD and UC. While this result may appear unsatisfactory, the predictive capacity of our predictor sets (Figure 5 D-E-F, from 68% to 84%) is at the level of those proposed by Hakonarsonet al to predict GC response in asthma patients [24]. Indeed, prognosis in patients with CD and UC was proposed on the basis of predictor signatures with 59% (CD) and 77% (UC) sensitivities [14]. The fact that the comparison of low inflammation groups CD1vs. UC1 yielded better predictors than high inflammation groups CD2vs. UC2 suggests that the inflammatory process at active stages is a natural confounding factor that limits the ability of the predictor set. In this case, gene expression analysis of predictor genes in patients in remission may therefore be preferential for a better diagnosis of IBD.
In summary, we show here that gene expression profiling can be successfully used to stratify patients and identify transcriptional signatures associated with clinical parameters. We identified several predictor gene panels that contained genes involved in immune mechanisms (PTN, OLFM4, LILRA2, CD36), autoph-agy or GC response (STS, MDM2). This represents, to our knowledge, the first biomarker discovery based on specifically designed analytical algorithms with potential value to predict GC response and need of surgery as well as with diagnostic value for IBD patients. This could therefore enable patients to be classified and receive personalized therapy according to the expression level of predictor genes. Our study is the first stone in the validation of the potential use of our class predictors in larger cohorts of IBD patients.
Supporting Information
Figure S1 Association between the different patient subgroups used for the predictor analyses. Data were analyzed by Fisher’s exact test andpvalues lower that 0.05 were considered significant.
(TIFF)
Table S1 Association between clinical parameters and inflam-matory profile.
(DOC)
Table S2 Top 10 up-regulated and down-regulated genes between ulcerative colitis subtypes (UC1 vs. UC2) and Crohn’s disease subtypes (CD1vs.CD2).
(DOC)
Figure 5. Systematic search for new predictors associated with IBD.Predictors were built using the tool Prophet and the 54,675 probes contained in the chip, using the leave-one-out cross-validation strategy, to identify classifiers genes for inflammatory bowel disease, IBD (A), Crohn’s disease, CD (B), ulcerative colitis, UC (C), CDvs.UC (D), low inflammation subtypes of CD and UC (E), and high inflammation subtypes of CDvs.UC (F).
Data are represented as box and whiskers plots, where the error bars designate the smallest and largest observations and dots designate the outliers. Data was analyzed by two-way ANOVA followed by Bonferroni post test,pvalues higher than 0.05 were considered not significant (ns), *p,0.01, **p,0.001.
Table S3 Genes validated by real time-PCR and primers used. (DOC)
Table S4 Gene expression changes identified in GEO Profiles database.
(DOCX)
Acknowledgments
We thank Progenika Biopharma S.A. for performing the microarray analyses.
Author Contributions
Conceived and designed the experiments: AS XL MP TM. Performed the experiments: TM EG. Analyzed the data: TM AS XL. Contributed reagents/materials/analysis tools: AS XL MP. Wrote the paper: TM AS XL MP.
References
1. Maloy KJ, Powrie F (2011) Intestinal homeostasis and its breakdown in inflammatory bowel disease. Nature 474: 2982306.
2. Beaugerie L, Sokol H (2012) Clinical, serological and genetic predictors of inflammatory bowel disease course. World J Gastroenterol 18: 380623813. 3. Lichtenstein GR, Hanauer SB, Sandborn WJ (2009) Practice Parameters
Committee of American College of Gastroenterology. Management of Crohn’s disease in adults. Am J Gastroenterol 104: 4652483.
4. D’Haens G, Baert F, van Assche G, Caenepeel P, Vergauwe P, et al. (2008) Early combined immunosuppression or conventional management in patients with newly diagnosed Crohn’s disease: an open randomised trial. Lancet 371: 6602667.
5. Lewis JD (2011) The utility of biomarkers in the diagnosis and therapy of inflammatory bowel disease. Gastroenterology 140: 181721826.
6. Van Limbergen J, Philpott D, Griffiths AM (2011) Genetic profiling in inflammatory bowel disease: from association to bedside. Gastroenterology 141: 156621571.
7. van de Vijver MJ, He YD, van’t Veer LJ, Dai H, Hart AA, et al. (2002) A gene-expression signature as a predictor of survival in breast cancer. N Engl J Med 347: 199922009.
8. Bonome T, Levine DA, Shih J, Randonovich M, Pise-Masison CA, et al. (2008) A gene signature predicting for survival in suboptimally debulked patients with ovarian cancer. Cancer Res 68: 547825486.
9. McKinney EF, Lyons PA, Carr EJ, Hollis JL, Jayne DR, et al. (2010) A CD8+T cell transcription signature predicts prognosis in autoimmune disease. Nat Med 16: 5862591.
10. Medina I, Montaner D, Tarraga J, Dopazo J (2007) Prophet, a web-based tool for class prediction using microarray data. Bioinformatics 23: 3902391. 11. Thomas PD, Kejariwal A, Campbell MJ, Mi H, Diemer K, et al. (2003)
PANTHER: a browsable database of gene products organized by biological function, using curated protein family and subfamily classification. Nucleic Acids ReS 31: 3342341.
12. Ford LT, Berg JD (2010) Thiopurine S-methyltransferase (TPMT) assessment prior to starting thiopurine drug treatment; a pharmacogenomic test whose time has come. J Clin Pathol 63: 2882295.
13. Simon R, Radmacher MD, Dobbin K, McShane LM (2003) Pitfalls in the use of DNA microarray data for diagnostic and prognostic classification. J Natl Cancer Inst 95: 14218.
14. Lee JC, Lyons PA, McKinney EF, Sowerby JM, Carr EJ, et al. (2011) Gene expression profiling of CD8+T cells predicts prognosis in patients with Crohn disease and ulcerative colitis. J Clin Invest 121: 417024179.
15. Bonapace L, Bornhauser BC, Schmitz M, Cario G, Ziegler U, et al. (2010) Induction of autophagy-dependent necroptosis is required for childhood acute lymphoblastic leukemia cells to overcome glucocorticoid resistance. J Clin Invest 120: 131021323.
16. Sengupta S, Wasylyk B (2001) Ligand-dependent interaction of the glucocor-ticoid receptor with p53 enhances their degradation by Hdm2. Genes Dev 15: 236722380.
17. Oz HS, Zhong J, de Villiers WJ (2009) Pattern recognition scavenger receptors, SR-A and CD36, have an additive role in the development of colitis in mice. Dig Dis Sci 54: 256122567.
18. Lu HK, Mitchell A, Endoh Y, Hampartzoumian T, Huynh O, et al. (2012) LILRA2 Selectively Modulates LPS-Mediated Cytokine Production and Inhibits Phagocytosis by Monocytes PLoS One 7: e33478.
19. Tedla N, An H, Borges L, Vollmer-Conna U, Bryant K, Geczy C, et al. (2011) Expression of activating and inhibitory leukocyte immunoglobulin-like receptors in rheumatoid synovium: correlations to disease activity. Tissue Antigens 77: 3052316.
20. Srivastava MD, Kulaylat MN (2004) Gene expression profiles of late colonic Crohn’s disease. J Med 35: 2332255.
21. Svensson SL, Pasupuleti M, Walse B, Malmsten M, Mo¨rgelin M, et al. (2010) Midkine and pleiotrophin have bactericidal properties: preserved antibacterial activity in a family of heparin-binding growth factors during evolution. J Biol Chem 285: 16105216115.
22. Gersemann M, Becker S, Nuding S, Antoni L, Ott G, et al. (2012) Olfactomedin-4 is a glycoprotein secreted into mucus in active IBD. J Crohns Colitis 6: 4252434.
23. Liu W, Yan M, Liu Y, Wang R, Li C, et al. (2010) Olfactomedin 4 down-regulates innate immunity against Helicobacter pylori infection. Proc Natl Acad Sci USA 107: 11056211061.