Identifies Molecular Signatures of Melanoma Progression
Byungwoo Ryu*, Dave S. Kim, Amena M. DeLuca, Rhoda M. Alani*
The Sidney Kimmel Comprehensive Cancer Center at Johns Hopkins, Department of Oncology, Johns Hopkins University School of Medicine, Baltimore, Maryland, United States of America
Background. Gene expression profiling has revolutionized our ability to molecularly classify primary human tumors and significantly enhanced the development of novel tumor markers and therapies; however, progress in the diagnosis and treatment of melanoma over the past 3 decades has been limited, and there is currently no approved therapy that significantly extends lifespan in patients with advanced disease. Profiling studies of melanoma to date have been inconsistent due to the heterogeneous nature of this malignancy and the limited availability of informative tissue specimens from early stages of disease.Methodology/Principle Findings.In order to gain an improved understanding of the molecular basis of melanoma progression, we have compared gene expression profiles from a series of melanoma cell lines representing discrete stages of malignant progression that recapitulate critical characteristics of the primary lesions from which they were derived. Here we describe the unsupervised hierarchical clustering of profiling data from melanoma cell lines and melanocytes. This clustering identifies two distinctive molecular subclasses of melanoma segregating aggressive metastatic tumor cell lines from less-aggressive primary tumor cell lines. Further analysis of expression signatures associated with melanoma progression using functional annotations categorized these transcripts into three classes of genes: 1) Upregulation of activators of cell cycle progression, DNA replication and repair (CDCA2, NCAPH, NCAPG, NCAPG2, PBK, NUSAP1, BIRC5, ESCO2, HELLS, MELK, GINS1,
GINS4, RAD54L, TYMS, andDHFR), 2) Loss of genes associated with cellular adhesion and melanocyte differentiation (CDH3,
CDH1, c-KIT, PAX3, CITED1/MSG-1, TYR, MELANA, MC1R,andOCA2), 3) Upregulation of genes associated with resistance to
apoptosis (BIRC5/survivin). While these broad classes of transcripts have previously been implicated in the progression of melanoma and other malignancies, the specific genes identified within each class of transcripts are novel. In addition, the transcription factor NF-KB was specifically identified as being a potential ‘‘master regulator’’ of melanoma invasion since NF-KB binding sites were identified as consistent consensus sequences within promoters of progression-associated genes. Conclusions/Significance. We conclude that tumor cell lines are a valuable resource for the early identification of gene signatures associated with malignant progression in tumors with significant heterogeneity like melanoma. We further conclude that the development of novel data reduction algorithms for analysis of microarray studies is critical to allow for optimized mining of important, clinically-relevant datasets. It is expected that subsequent validation studies in primary human tissues using such an approach will lead to more rapid translation of such studies to the identification of novel tumor biomarkers and therapeutic targets.
Citation: Ryu B, Kim DS, DeLuca AM, Alani RM (2007) Comprehensive Expression Profiling of Tumor Cell Lines Identifies Molecular Signatures of Melanoma Progression. PLoS ONE 2(7): e594. doi:10.1371/journal.pone.0000594
INTRODUCTION
The incidence of melanoma is increasing at one of the highest rates for any form of cancer in the United States [1]. At present, there are no systemic agents available that significantly extend the lifespan of patients with advanced disease, and the key to improved survival in all affected individuals remains early diagnosis and treatment. While early stage disease may result in occasional deaths, there are no available tests to predict which early stage tumors have a high likelihood of progression and therefore a worse prognosis. Thus, an urgent need exists for the identification of molecular signatures of melanoma progression which can be used to develop accurate prognostic markers and effective targeted therapies. High-throughput gene expression profiling technologies offer an opportunity to uncover critical molecular events in the development and progression of human melanoma and can be used to design improved prognostic testing and effective treatment strategies. Previous transcriptome analyses in other malignancies have provided valuable information for the assessment of patient group classifications such as subgroups of patients that are likely to respond to a particular therapy [2]. Expression profiling of metastatic melanomas was able to identify previously unrecognized subtypes of disease and predict pheno-typic characteristics which may be of importance to melanoma
progression [3]. Further studies using serial analysis of gene expression (SAGE) and cDNA arrays have yielded the identifica-tion of addiidentifica-tional novel molecules and pathways which may be involved in melanoma development[4–7]. Such studies have been limited in utility due to the lack of concordance from one study to the next suggesting tumor heterogeneity [8]. In addition, the
Academic Editor:Joseph Najbauer, City of Hope Medical Center, United States of America
ReceivedMarch 26, 2007;AcceptedJune 6, 2007;PublishedJuly 4, 2007
Copyright:ß2007 Ryu et al. This is an open-access article distributed under the terms of the Creative Commons Attribution License, which permits unrestricted use, distribution, and reproduction in any medium, provided the original author and source are credited.
Funding:National Institutes of Health Grants CA107017 (RA) and CA113779 (BR), American Skin Association (R.A., A.D.), Flight Attendant Medical Research Institute (R.A.), The Murren Family Foundation (R.A.), and The Henry and Elaine Kaufman Foundation (R.A.).
Competing Interests:The authors have declared that no competing interests exist.
limited availability of primary tissue from early stages of disease has hindered the ability to identify serial molecular events that lead to melanoma onset. This shortcoming of tissue availability has largely restricted gene expression profiling studies in melanoma to the use of small numbers of established tumor cell lines and cases of metastatic disease.
Previous studies of primary human melanomas have identified gene signatures associated with tumor progression [9–11]. These signatures included upregulation of cell cycle regulatory proteins, mitotic checkpoint genes, genes involved in DNA replication and repair, and cellular stress response genes in addition to loss of genes promoting apoptosis; however, few of the genes identified in these studies were concordant suggesting limitations due to tumor variability. Since better knowledge of gene expression signatures associated with melanoma progression may identify improved screening tools and therapeutic strategies, we used high density cDNA microarrays for gene expression profiling of genetically well-defined melanoma cell lines isolated from distinctive stages of tumor progression. Novel data reduction algorithms were used to identify gene signatures associated with tumor invasion and metastasis. Here we report unique sets of gene expression signatures that are associated with melanoma progression. Many of these pathways have previously been implicated in melanoma progression; however, the specific signature genes identified are novel. These particular pro-gression-associated genes may reflect the underlying molecular mechanisms of the various phases in the known tumor pro-gression pathways of melanoma. As such, the pathways and molecules identified in this study have the potential to be utilized as therapeutic targets for melanoma as well as novel molecular markers for melanoma progression. Moreover, these studies support the use of renewable sources of tumor cells, such as informative tumor cell lines, for the early identification of genes associated with malignant progression which can be subsequently validated using more precious primary tissue specimens.
RESULTS
In order to define gene expression patterns during the course of melanoma development and progression, we evaluated a series of primary and metastatic melanoma cells derived from lesions of discrete phases of melanoma progression as well as pools of primary human melanocytes. Tumor cell lines derived from three radial growth phase (RGP) melanomas (WM35, SBC12, and WM1552C), four vertical growth phase (VGP) melanomas (WM902B, WM278, WM983A, and WM793), and three metastatic melanomas (WM852, WM983B, 1205Lu) were evalu-ated. These cell lines possess a notable ability to recapitulate the clinical stages of disease from which they were derived [12,13] and have been characterized with respect to tumorigenicity and metastasis [14–17]; cellular growth characteristics including life span, growth factor dependency, anchorage-independent growth [12]; and pigmentation and morphology [18]. In addition, cytogenetic analyses in these cell lines including non-random abnormalities such as deletions, translocations, and amplifications have been well-documented and suggest high relevance to the primary tumor of origin (reviewed in [12]).
Global gene expression patterns were obtained using Affymetrix gene chips and comparison of gene expression profiles was performed using hierarchical clustering analysis. This clustering analysis identified two distinct groups of melanoma cell lines based on the similarity of their expression patterns, separating radial growth phase (RGP) and metastatic melanomas (MM) (Figure 1); however, vertical growth phase (VGP) melanomas failed to form a distinctive cluster (Figure 1A). The first group, which we
characterized as ‘‘less-aggressive’’ primary melanomas (designated as Group1), included all three RGP melanomas (WM35, Sbcl2, and WM1552C) and two VGP melanomas (WM902B and WM278). The second group, which we characterized as ‘‘more-aggressive’’ melanomas (designated as Group2), included all three metastatic melanomas (WM853, WM983B, and 1205Lu) and two VGP melanomas (WM983B and WM793). Additional cluster analyses with different linkage matrices produced similar results (data not shown). Of note, only 2 of the 10 cell lines (Sbcl2 and WM853) were found to be wildtype for BRAF kinase and this genotype failed to demonstrate a notable cluster in our hierarchical analyses.
In order to identify a cohort of genes differentially expressed between our defined groups of melanomas, the gene expression array dataset was subjected to the microarray data analysis program Significance Analysis of Microarray (SAM) [19]. This analysis resulted in 142 differentially expressed probesets with a 3.5 % false discovery rate (Figure 1B and C). In total, 89 probe sets representing 65 well-defined genes were found to be upregulated in more-aggressive (group 2) versus less-aggressive (group 1) melanomas and 53 probe sets representing 37 well-defined genes were found to be downregulated (Table S1). When more stringent criteria were applied (well-characterized genes which are differ-entially expressed greater than 4-fold) to this signature, we identified 21 upregulated and 5 downregulated genes in the more-aggressive melanoma cells (Figure 1C). Of note, the set of genes highly expressed in more-aggressive melanomas includes many novel genes with reported functional roles in cell cycle regulation and proliferation such as ZWINT, CDCA2, NCAPH, NCAPG, NCAPG2, PBK, NUSAP1, BIRC5, ESCO2, HELLS, MELK, and CDKN2C [20–31] as well as genes that are involved DNA replication and repair processes includingGINS1, GINS4, RAD54L, TYMS, andDHFR [32–34] (Table 1). Differential expression of these genes was validated by quantitative real-time RT-PCR (Figure 1D).
differenti-ation and includes:CDH3, CDH1, c-KIT, PAX3, CITED1/MSG-1, TYR, MELANA, MC1R,andOCA2[35–42] (Table 2). While such a loss of cellular adhesion by E-cadherin and P-cadherin has been extensively documented in melanoma (reviewed in [43]), and the loss of differentiation-associated genes is not wholly surprising, this signature does notably identify specific defects in the intrinsic melanocyte development program that may contribute to melanoma development. In addition, genes with tumor suppressor and metastasis suppressor functions (DPP4, SYK) are included in this melanoma signature [44,45]. Significant down-regulation of these genes in the aggressive metastatic melanoma cells was validated using semi-quantitative duplex RT-PCR (Figure 2D). Furthermore, this differentially expressed ‘‘melanoma signature’’ contains many genes whose functional roles in melanoma
progression have not been well characterized and may provide novel insights into the early development of melanoma from primary melanocytes.
A current melanoma progression model suggests the sequential evolution of primaryin situtumors and minimally invasive tumors which are termed ‘‘radial growth phase’’, followed by a subsequent conversion to a more aggressive ‘‘vertical growth phase’’, in which tumor cells are programmed to cross the epidermal basement membrane and invade vertically into the dermis. It has been postulated that the VGP is the critical stage in which a tumor gains metastatic capacity. We therefore compared the gene expression profiles of RGP and VGP melanomas using a uniquely designed data reduction algorithm in order to identify genes that are likely to be relevant to this critical invasive phenotype (Figure 3A). Our Figure 1. Evaluation of gene expression profiles from melanoma cells lines of varying stages of progression identifies a signature for aggressive melanomas.A) Unsupervised hierarchical clustering of melanoma cells indicates the existence of two distinct groups of melanoma cells based on global gene expression patterns (Group 1: RGP2, RGP3, RGP1, VGP1, and VGP2; Group 2: VGP3, MM2, MM1, VGP4, and MM3). B) SAM plot sheet illustrating a signature for differentially expressed genes in aggressive melanomas. Gene expression profiles from the two groups of melanomas were compared (Group1 vs. Group 2) and a differentially expressed gene signature was identified by SAM. Red and green dots represent gene probesets upregulated and downregulated respectively in Group 2. C) The melanoma gene signature was visualized using Java TreeView. Genes over four-fold differentially expressed are indicated on the right side of the image. D) Validation of select differentially expressed genes by real-time RT-PCR. Three genes upregulated in aggressive melanomas (Group 2) were selected for analysis and their differential expression was verified. 3.0mg of total RNA
was subjected to cDNA synthesis reaction as described in the materials and methods. 1.0ml of the final cDNA samples (100ml) were used for
real-time Q-PCR reaction. For the measurement of gene transcript level, standard curves were generated for each gene using known amount of PCR amplified product from the corresponding genes. Error bars are SD of three independent experiments.
melanoma invasion-specific signature is notably characterized by the inclusion of several genes involved in chemotaxis and the inflammatory response (CXCL1, CXCL2, IL8, and IL6), cell adhesion (HNT, ITGA4, ITGB8, CSPG2, ZP4,and FLRT3), and extracellular matrix organization (MMP1, COL4A1, COL4A2,and
COL5A2) (Table 3). These genes and their relative expression profiles are depicted in Figure 3B. These cellular processes have previously been implicated in tumor progression for a wide variety of malignancies including melanoma and are felt to be essential components of tumor invasion and metastasis. In addition, many of these invasion-specific signature genes are also upregulated in metastatic melanomas (Figure 3B). The differential expressions were validated on the selected genes using semi-quantitative duplex-PCR analysis (Figure 3C).
Since the melanoma invasion-specific signature was associated with common functions of matrix invasion/inflammation/cell migration we sought to determine whether a common upstream regulatory pathway might link these signature genes. The eight most highly up-regulated genes from our melanoma invasion-specific signature were selected for further evaluation and gene promoter sequences were analyzed to identify transcription factor binding ciselements. This promoter analysis yielded a profile of transcription factors with common sequence elements in the
signature genes. The most ubiquitousciselements among the gene promoters evaluated were E12, E47, GCN4, GR, HES-1, IL-6, MEF-2, NF-KB, N-Oct-3, PU.1, RAR-alpha1, SRF, and the basal gene transcriptional complex components of TFIID, TBP, and TBF1. We notably identified the NF-KB binding sequence in 7 out of 8 of the most upregulated invasion-specific signature genes (Figure 3D). We were particularly interested in the NF-KB pathway as a mediator of melanoma invasion since our most highly upregulated invasion-specific genes,CXCL-1andIL-8, have previously been reported to be activated by NF-KB and had previously been implicated in melanoma progression (reviewed in [46]). Given the consequences of NF-KB activation in a cell, NF-KB function is highly regulated by specific cytosolic inhibitory activities which prevent inappropriate NF-KB activation and shuttling to the nucleus. Thus, only nuclear NF-KB is considered to be functionally activated. In order to evaluate NF-KB function in our tumor cell lines, we used NF-KB cellular localization as a surrogate marker for NF-KB activity. We find that invasive (VGP) melanomas posses both cytosolic (inactive) and nuclear (active) localization of NF-KB, while non-invasive (RGP) melano-mas possess NF-KB confined to the cytosolic compartment suggesting specific activation of NF-KB during melanoma pro-gression (Figure 3E).
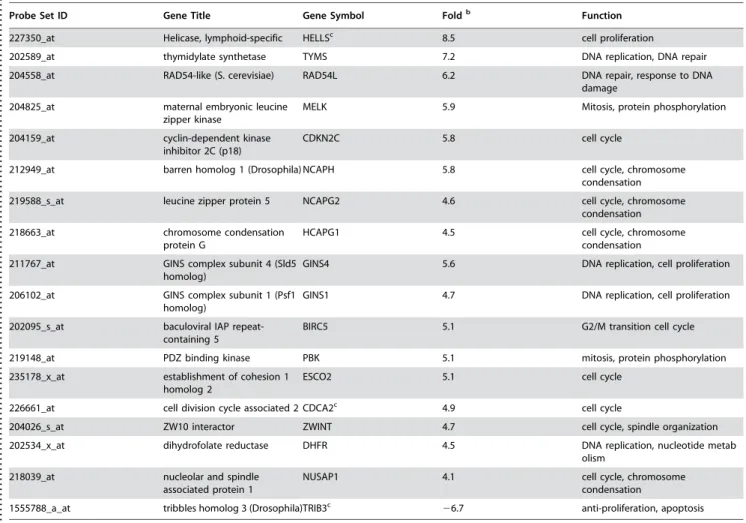
Table 1. Genes with altered expression in aggressive melanoma cells are involved in cell cycle control, cell proliferation, DNA repair and replicationa.
. . . .
Probe Set ID Gene Title Gene Symbol Foldb Function
227350_at Helicase, lymphoid-specific HELLSc 8.5 cell proliferation
202589_at thymidylate synthetase TYMS 7.2 DNA replication, DNA repair
204558_at RAD54-like (S. cerevisiae) RAD54L 6.2 DNA repair, response to DNA damage
204825_at maternal embryonic leucine zipper kinase
MELK 5.9 Mitosis, protein phosphorylation
204159_at cyclin-dependent kinase inhibitor 2C (p18)
CDKN2C 5.8 cell cycle
212949_at barren homolog 1 (Drosophila) NCAPH 5.8 cell cycle, chromosome condensation
219588_s_at leucine zipper protein 5 NCAPG2 4.6 cell cycle, chromosome condensation
218663_at chromosome condensation protein G
HCAPG1 4.5 cell cycle, chromosome
condensation
211767_at GINS complex subunit 4 (Sld5 homolog)
GINS4 5.6 DNA replication, cell proliferation
206102_at GINS complex subunit 1 (Psf1 homolog)
GINS1 4.7 DNA replication, cell proliferation
202095_s_at baculoviral IAP repeat-containing 5
BIRC5 5.1 G2/M transition cell cycle
219148_at PDZ binding kinase PBK 5.1 mitosis, protein phosphorylation
235178_x_at establishment of cohesion 1 homolog 2
ESCO2 5.1 cell cycle
226661_at cell division cycle associated 2 CDCA2c 4.9 cell cycle
204026_s_at ZW10 interactor ZWINT 4.7 cell cycle, spindle organization
202534_x_at dihydrofolate reductase DHFR 4.5 DNA replication, nucleotide metab olism
218039_at nucleolar and spindle associated protein 1
NUSAP1 4.1 cell cycle, chromosome
condensation
1555788_a_at tribbles homolog 3 (Drosophila)TRIB3c
26.7 anti-proliferation, apoptosis
a
Genes with greater than four-fold differential expression are shown.
b
Fold represents average expression ratio of group 2 over Group1.
c
Genes with multiple probesets are shown with data from a single representative probeset. doi:10.1371/journal.pone.0000594.t001
..
...
...
....
...
...
....
...
...
....
...
...
....
...
...
....
...
...
....
...
...
....
...
...
....
...
...
....
...
...
....
...
...
....
...
...
....
DISCUSSION
Molecular profiling studies of melanoma to date have been variably successful and often inconsistent. Much of this in-consistency has been attributed to the heterogeneous nature of this malignancy and the lack of significant sources of meaningful archived tissue specimens for analysis. In addition, variable sample preparation techniques are also likely to lead to disparate results between investigators. Here we have used a series of well-defined melanoma cell lines from varying stages of malignant progression to assess molecular signatures associated with disease progression. These cell lines have undergone extensive charac-terization of their tumorigenic potential and invasion capacity [14,47], and have been shown to possess a remarkable ability to recapitulate the clinical stages of disease from which they were derived. We show that unsupervised hierarchical clustering of global gene expression profiles of melanoma cell lines allows for the classification of tumor cells into 2 groups (Figure 1A) that we have defined as less-aggressive (Group 1) and more-aggressive (Group 2) melanomas. While all radial growth phase melanomas clustered in Group 1, and all metastatic melanomas clustered in
Group 2, vertical growth phase melanomas failed to form a distinctive cluster suggesting that vertical growth phase melanomas may be considered to be a transient or transition phase within the current melanoma progression model [48]. Aggressive (Group 2) melanomas were characterized by upregu-lation of genes associated with cell cycle progression, DNA replication and repair, and altered expression of apoptosis-related genes including upregulation of the antiapoptotic gene BIRC5/survivin [49] and downregulation of the novel stress-associated apoptosis inducer TRIB3 [50] (Table 1). These signature genes for melanoma progression are remarkably similar to those obtained from recent large-scale studies using primary human melanomas and suggest high correlation with alterations seen in primary tumor specimens [10]. Notably, we did not identify a dominant signature associated with BRAF kinase mutations which may be reflective of the relative infrequency of wildtype BRAF in these cell lines. As a whole, this gene signature suggests a series of molecular alterations occur in aggressive melanomas that promote melanoma cell growth, survival and apoptotic resistance which contribute to the unresponsiveness of melanomas to traditional chemotherapeutic agents [51]. Figure 2. Evaluation of differential gene expression from aggressive melanomas (Group 2) vs. primary human melanocytes identifies a signature characterized by loss of differentiation-associated genes.A) Java TreeView analysis of melanoma cell lines and primary human melanocytes clusters two pools of human primary melanocytes (HPM1 and HPM2) with the Group 2 melanomas. B) SAM plot sheet illustrating a signature of down-regulated genes in group 2 melanomas compared to HPMs. Gene expression profiles of two pools of human primary melanocytes (HPM1 and HPM2) were compared to those of aggressive melanomas (Group 2) and a differentially expressed gene signature was identified by SAM. C) The melanoma gene signature was visualized using Java TreeView. Genes over five-fold downregulated are indicated on the right. D) Validation of differential expression for selected genes by semi-quantitative duplex RT-PCR. Four genes (CDH3, KIT, DPP4, SYK) downregulated in the aggressive melanoma cells (Group 2) were selected for analysis and their differential expression was verified.
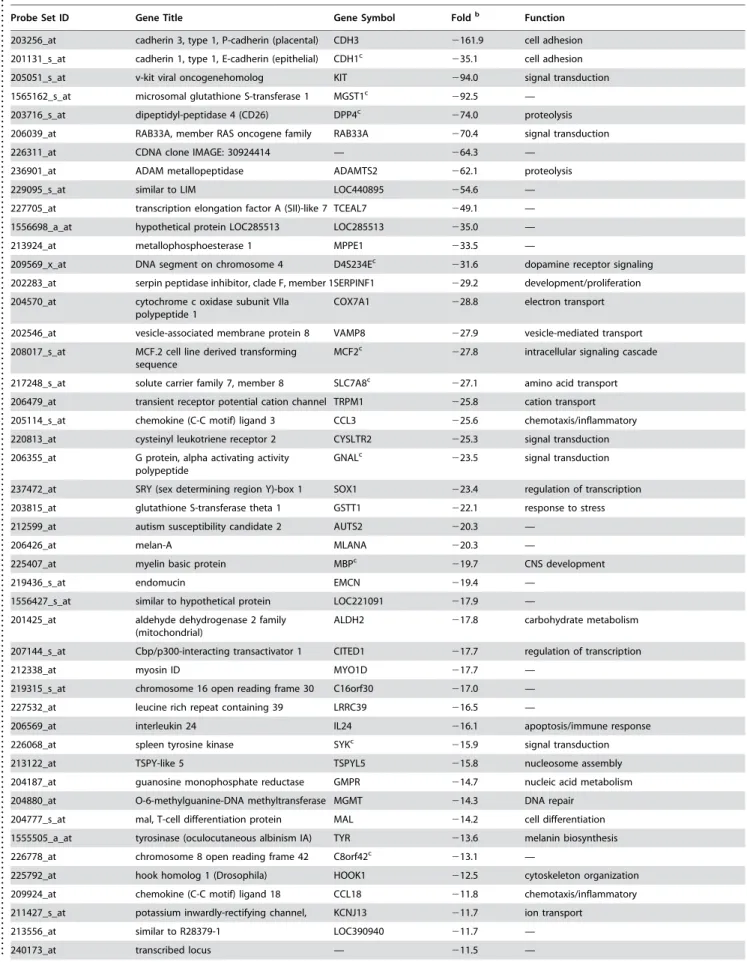
Table 2. Differential expression of genes that are downregulated in aggressive melanoma cells (Group2) compared to primary human melanocytes. Genes with greater than five-fold differential expression are showna.
. . . .
Probe Set ID Gene Title Gene Symbol Foldb Function
203256_at cadherin 3, type 1, P-cadherin (placental) CDH3 2161.9 cell adhesion
201131_s_at cadherin 1, type 1, E-cadherin (epithelial) CDH1c
235.1 cell adhesion 205051_s_at v-kit viral oncogenehomolog KIT 294.0 signal transduction
1565162_s_at microsomal glutathione S-transferase 1 MGST1c 292.5 —
203716_s_at dipeptidyl-peptidase 4 (CD26) DPP4c
274.0 proteolysis 206039_at RAB33A, member RAS oncogene family RAB33A 270.4 signal transduction
226311_at CDNA clone IMAGE: 30924414 — 264.3 —
236901_at ADAM metallopeptidase ADAMTS2 262.1 proteolysis
229095_s_at similar to LIM LOC440895 254.6 —
227705_at transcription elongation factor A (SII)-like 7 TCEAL7 249.1 —
1556698_a_at hypothetical protein LOC285513 LOC285513 235.0 —
213924_at metallophosphoesterase 1 MPPE1 233.5 —
209569_x_at DNA segment on chromosome 4 D4S234Ec 231.6 dopamine receptor signaling
202283_at serpin peptidase inhibitor, clade F, member 1SERPINF1 229.2 development/proliferation
204570_at cytochrome c oxidase subunit VIIa polypeptide 1
COX7A1 228.8 electron transport
202546_at vesicle-associated membrane protein 8 VAMP8 227.9 vesicle-mediated transport
208017_s_at MCF.2 cell line derived transforming sequence
MCF2c 227.8 intracellular signaling cascade
217248_s_at solute carrier family 7, member 8 SLC7A8c
227.1 amino acid transport 206479_at transient receptor potential cation channel TRPM1 225.8 cation transport
205114_s_at chemokine (C-C motif) ligand 3 CCL3 225.6 chemotaxis/inflammatory
220813_at cysteinyl leukotriene receptor 2 CYSLTR2 225.3 signal transduction
206355_at G protein, alpha activating activity polypeptide
GNALc
223.5 signal transduction
237472_at SRY (sex determining region Y)-box 1 SOX1 223.4 regulation of transcription
203815_at glutathione S-transferase theta 1 GSTT1 222.1 response to stress
212599_at autism susceptibility candidate 2 AUTS2 220.3 —
206426_at melan-A MLANA 220.3 —
225407_at myelin basic protein MBPc
219.7 CNS development
219436_s_at endomucin EMCN 219.4 —
1556427_s_at similar to hypothetical protein LOC221091 217.9 —
201425_at aldehyde dehydrogenase 2 family (mitochondrial)
ALDH2 217.8 carbohydrate metabolism
207144_s_at Cbp/p300-interacting transactivator 1 CITED1 217.7 regulation of transcription
212338_at myosin ID MYO1D 217.7 —
219315_s_at chromosome 16 open reading frame 30 C16orf30 217.0 —
227532_at leucine rich repeat containing 39 LRRC39 216.5 —
206569_at interleukin 24 IL24 216.1 apoptosis/immune response
226068_at spleen tyrosine kinase SYKc 215.9 signal transduction
213122_at TSPY-like 5 TSPYL5 215.8 nucleosome assembly
204187_at guanosine monophosphate reductase GMPR 214.7 nucleic acid metabolism
204880_at O-6-methylguanine-DNA methyltransferase MGMT 214.3 DNA repair
204777_s_at mal, T-cell differentiation protein MAL 214.2 cell differentiation
1555505_a_at tyrosinase (oculocutaneous albinism IA) TYR 213.6 melanin biosynthesis
226778_at chromosome 8 open reading frame 42 C8orf42c
213.1 —
225792_at hook homolog 1 (Drosophila) HOOK1 212.5 cytoskeleton organization
209924_at chemokine (C-C motif) ligand 18 CCL18 211.8 chemotaxis/inflammatory
211427_s_at potassium inwardly-rectifying channel, KCNJ13 211.7 ion transport
213556_at similar to R28379-1 LOC390940 211.7 —
240173_at transcribed locus — 211.5 —
...
...
....
...
...
....
...
...
....
...
...
....
...
...
....
...
...
....
...
...
....
...
...
....
...
...
....
...
...
....
...
...
....
...
...
....
...
...
....
...
...
....
...
...
....
...
...
....
...
...
....
...
...
....
...
...
....
...
...
While gene signatures associated with aggressive melanomas provide insights into molecular pathways important for tumor progression, further analysis of these tumor cell lines in conjunction with expression profiles from primary human melanocytes using SAM analysis revealed a striking signature characterized exclusively by gene loss in melanomas and primarily by loss of cellular adhesion and melanocyte differentiation-associated genes (Figures 2B, 2C). We suggest that this melanoma-associated signature defines critical molecular mechanisms involved in melanocyte development and differentiation which distinguish these tumor cells from their primary cell of origin. In fact, the identification of several genes in this signature with established functional roles in melanocyte differentiation and melanin biosynthesis such asCDH3, CDH1,
c-KIT, PAX3, CITED1/MSG-1, TYR, MELANA, MC1R, andOCA2
[35–42], supports this notion. Moreover, this signature has identified two tumor suppressor genes, DPP4 and SYK, whose downregulation has previously been implicated in melanoma development [52–54].
Finally, evaluation of an invasion-specific signature for mela-noma identified dominant gene activation by the transcription factor, NF-KB. Constitutive activation of NF-KB and an in-flammatory response is an emerging hallmark of various tumor types [55]. In addition, NF-KB has specifically been implicated in the development of invasive aggressive melanomas through autocrine and paracrine mechanisms (reviewed in [46]). Our melanoma invasion signature is associated with upregulation of
Probe Set ID Gene Title Gene Symbol Foldb Function
206498_at oculocutaneous albinism II OCA2 211.4 eye pigment biosynthesis
241600_at transcribed locus — 211.0 —
205297_s_at CD79b molecule, immunoglobulin-associated
CD79B 210.9 immune response
228256_s_at erythrocyte membrane protein band 4.1 like 4A
EPB41L4A 210.9 —
223693_s_at hypothetical protein FLJ10324 FLJ10324 210.3 signal transduction
243727_at copine VIII CPNE8 210.1 —
232687_at CDNA FLJ33091 fis, clone TRACH2000660 — 29.9 —
232443_at hypothetical gene supported by AF131741 LOC441052 29.9 —
236377_at transmembrane protein 132D TMEM132D 29.1 —
211748_x_at prostaglandin D2 synthase 21kDa (brain) PTGDS 29.0 lipid biosynthesis
204112_s_at histamine N-methyltransferase HNMT 28.7 respiratory gaseous exchange
228057_at DNA-damage-inducible transcript 4-like DDIT4L 28.6 —
51158_at hypothetical gene LOC400451 28.3 —
209550_at necdin homolog (mouse) NDN 28.3 regulation of cell cycle
214255_at ATPase, Class V, type 10A ATP10A 27.9 cation transport
1553485_at hypothetical protein LOC151278 FLJ32447 27.8 —
204273_at endothelin receptor type B EDNRB 27.6 G-protein signaling
235758_at paraneoplastic antigen like 6A PNMA6A 27.6 —
213816_s_at met proto-oncogene MET 27.2 cell proliferation
227704_at full-length cDNA clone CS0CAP008YI07 — 27.1 —
224566_at trophoblast-derived noncoding RNA TncRNA 26.9 —
207610_s_at EGF-like module containing, mucin-like EMR2 26.8 signal transduction
232504_at hypothetical protein LOC285628 LOC285628 26.8 —
241966_at myosin VA (heavy polypeptide 12, myoxin) MYO5Ac 26.7 actin-based movement
229925_at solute carrier family 6, member 17 SLC6A17 26.6 neurotransmitter transport
229251_s_at two pore segment channel 2 TPCN2c 26.2 cation transport
216059_at paired box gene 3 (Waardenburg syndrome 1)
PAX3c 26.2 development
227949_at phosphatase and actin regulator 3 PHACTR3 25.7 —
209685_s_at protein kinase C, beta 1 PRKCB1 25.6 intracellular signaling cascade
204995_at cyclin-dependent kinase 5, regulatory subunit 1
CDK5R1 25.3 neuron differentiation
206020_at suppressor of cytokine signaling 6 SOCS6 25.0 regulation of cell growth
221036_s_at anterior pharynx defective 1 homolog B APH1B 25.0 Notch signaling pathway
205458_at melanocortin 1 receptor MC1R 25.0 G-protein signaling
a
Genes with greater than five-fold differential expression are shown.
b
Fold represents average expression ratio of aggressive metastatic melanoma samples (group2) over normal primary human melanocyte samples.
c
Gene with multiple probesets are shown with a representative probeset. doi:10.1371/journal.pone.0000594.t002
....
...
...
....
...
...
....
...
...
....
...
...
....
...
...
....
...
...
....
...
...
....
...
...
....
...
...
....
...
...
....
...
...
....
...
...
....
...
...
....
...
...
....
...
...
....
.. Table 2. Cont.
critical NF-KB effectors including CXCL1, FMN2, MMP1, IL-8, IGFBP3 which have been implicated in the regulation of tumor cell proliferation, motility, migration, and/or invasion (Figure 3D). In addition, the putative NF-KB target gene GAGE7B which we identified in our melanoma invasion-specific signature, has been associated with apoptotic resistance and worse prognosis in other tumors [56]. In addition, several of our invasion-specific signature genes are chemokines including CXCL1, CXCL2, and IL-8 which have been implicated in the promotion of tumor-associated angiogenesis, a critical feature of invasive tumors [57].
In summary, our gene expression profiling studies of melanoma cell lines from varying stages of malignant progression and primary human melanocytes have identified several important melanoma signatures including: 1) Aggressive melanomas are characterized by upregulation of genes associated with cell cycle progression, DNA replication and repair and apoptotic resistance as well as loss of genes associated with apoptotic susceptibility, 2) Melanomas notably differ from their cell of origin, primary human melanocytes, due to a loss of cellular adhesion and differentiation-associated genes, and 3) Invasive melanomas are characterized by a signature indicative of global activation of NF-KB and downstream effector genes associated with tumor cell migration, invasion, chemotaxis, and proliferation. Since pathways associated with tumor progression may have clinical utility as prognostic tumor markers and therapeutic targets, we expect novel melanoma signature genes identified in this study will be further developed for
such translational endpoints. Moreover, the important information regarding melanoma biology gleaned from these studies on renewable cell resources cannot be understated. A major roadblock to advances in melanoma therapy has been the relative paucity of informative tissue specimens available for analysis in profiling studies as well as the notoriously heterogeneous nature of this malignancy. The use of surrogate tissue resources including tumor cell lines for the early discovery phases in melanoma, as used in this study, will undoubtedly allow for the conservation of precious tissue specimens for use in more advanced validation studies. It is expected that the novel melanoma progression-associated genes identified in this study will provide new insights into the molecular defects associated with this malignancy and ultimately pave the way for the development of new melanoma biomarkers and novel targeted therapies.
MATERIALS AND METHODS
Cells
Ten melanoma cell lines (WM35, SBC12, and WM1552C,
WM902B, WM278, WM983A, and WM793, WM852,
WM983B, 1205Lu) were obtained from M. Herlyn (The Wistar Institute, Philadelphia, PA). These cell lines were maintained in modified complete melanocyte growth medium (Cell Application Inc., San Diego, CA) which lacked 12-O-tetradecanoyl phorbol-13-acetate and was supplemented with 2 % fetal bovine serum. Figure 3. Identification of an invasion-specific gene signature for melanoma.A) The three-step data reduction algorithm used for identification of a melanoma invasion-specific signature. (see detailed description in Data Extraction and Statistical Analysis section of Methods). B) Relative expression levels of melanoma invasion-specific signature genes in all cells analyzed including human primary melanocytes (HPM1, HPM2). C) Validation of differential expression for selected genes by semi-quantitative duplex RT-PCR. Four genes (IL-8, IGFBP3, CXCL1, CXCL2) that are upregulated in invasive melanomas were selected and their differential expression was verified. D) Promoter analysis of selected genes from the melanoma invasion-specific signature identifies putative NF-KB bindingciselements. E) Immunofluorescence staining of NF-KB in invasive (WM902B)
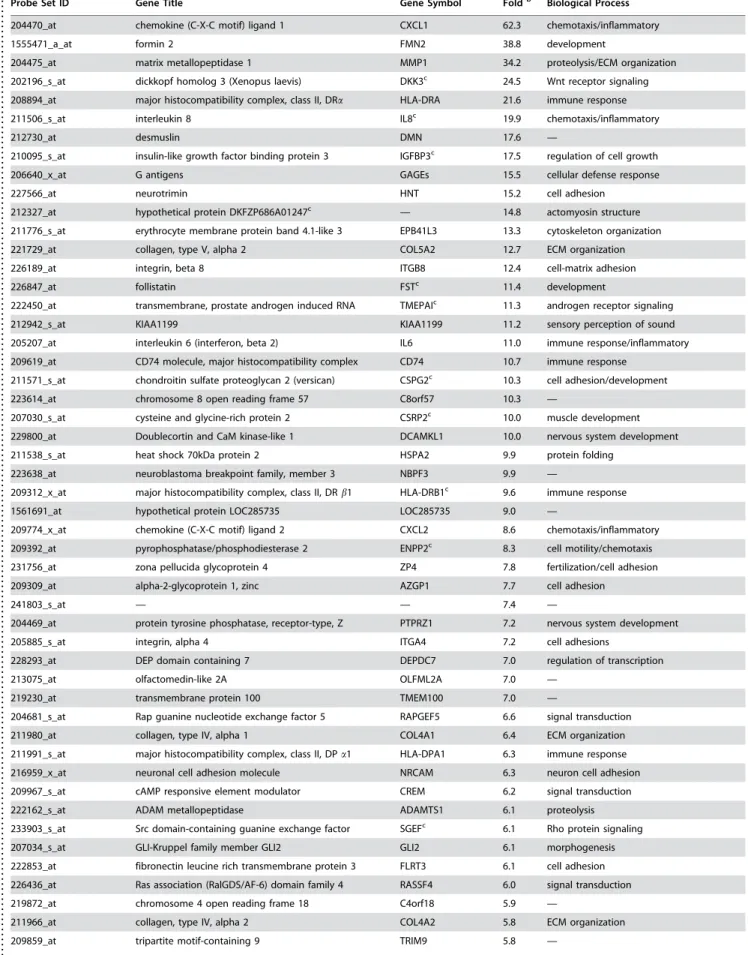
Table 3. Melanoma invasion-specific signature genes that are upregulated in VGP compared to RGP melanoma cellsa.
. . . .
Probe Set ID Gene Title Gene Symbol Foldb Biological Process
204470_at chemokine (C-X-C motif) ligand 1 CXCL1 62.3 chemotaxis/inflammatory
1555471_a_at formin 2 FMN2 38.8 development
204475_at matrix metallopeptidase 1 MMP1 34.2 proteolysis/ECM organization
202196_s_at dickkopf homolog 3 (Xenopus laevis) DKK3c 24.5 Wnt receptor signaling
208894_at major histocompatibility complex, class II, DRa HLA-DRA 21.6 immune response
211506_s_at interleukin 8 IL8c 19.9 chemotaxis/inflammatory
212730_at desmuslin DMN 17.6 —
210095_s_at insulin-like growth factor binding protein 3 IGFBP3c 17.5 regulation of cell growth
206640_x_at G antigens GAGEs 15.5 cellular defense response
227566_at neurotrimin HNT 15.2 cell adhesion
212327_at hypothetical protein DKFZP686A01247c — 14.8 actomyosin structure
211776_s_at erythrocyte membrane protein band 4.1-like 3 EPB41L3 13.3 cytoskeleton organization
221729_at collagen, type V, alpha 2 COL5A2 12.7 ECM organization
226189_at integrin, beta 8 ITGB8 12.4 cell-matrix adhesion
226847_at follistatin FSTc 11.4 development
222450_at transmembrane, prostate androgen induced RNA TMEPAIc 11.3 androgen receptor signaling
212942_s_at KIAA1199 KIAA1199 11.2 sensory perception of sound
205207_at interleukin 6 (interferon, beta 2) IL6 11.0 immune response/inflammatory
209619_at CD74 molecule, major histocompatibility complex CD74 10.7 immune response
211571_s_at chondroitin sulfate proteoglycan 2 (versican) CSPG2c 10.3 cell adhesion/development
223614_at chromosome 8 open reading frame 57 C8orf57 10.3 —
207030_s_at cysteine and glycine-rich protein 2 CSRP2c 10.0 muscle development
229800_at Doublecortin and CaM kinase-like 1 DCAMKL1 10.0 nervous system development
211538_s_at heat shock 70kDa protein 2 HSPA2 9.9 protein folding
223638_at neuroblastoma breakpoint family, member 3 NBPF3 9.9 —
209312_x_at major histocompatibility complex, class II, DRb1 HLA-DRB1c 9.6 immune response
1561691_at hypothetical protein LOC285735 LOC285735 9.0 —
209774_x_at chemokine (C-X-C motif) ligand 2 CXCL2 8.6 chemotaxis/inflammatory
209392_at pyrophosphatase/phosphodiesterase 2 ENPP2c 8.3 cell motility/chemotaxis
231756_at zona pellucida glycoprotein 4 ZP4 7.8 fertilization/cell adhesion
209309_at alpha-2-glycoprotein 1, zinc AZGP1 7.7 cell adhesion
241803_s_at — — 7.4 —
204469_at protein tyrosine phosphatase, receptor-type, Z PTPRZ1 7.2 nervous system development
205885_s_at integrin, alpha 4 ITGA4 7.2 cell adhesions
228293_at DEP domain containing 7 DEPDC7 7.0 regulation of transcription
213075_at olfactomedin-like 2A OLFML2A 7.0 —
219230_at transmembrane protein 100 TMEM100 7.0 —
204681_s_at Rap guanine nucleotide exchange factor 5 RAPGEF5 6.6 signal transduction
211980_at collagen, type IV, alpha 1 COL4A1 6.4 ECM organization
211991_s_at major histocompatibility complex, class II, DPa1 HLA-DPA1 6.3 immune response
216959_x_at neuronal cell adhesion molecule NRCAM 6.3 neuron cell adhesion
209967_s_at cAMP responsive element modulator CREM 6.2 signal transduction
222162_s_at ADAM metallopeptidase ADAMTS1 6.1 proteolysis
233903_s_at Src domain-containing guanine exchange factor SGEFc 6.1 Rho protein signaling
207034_s_at GLI-Kruppel family member GLI2 GLI2 6.1 morphogenesis
222853_at fibronectin leucine rich transmembrane protein 3 FLRT3 6.1 cell adhesion
226436_at Ras association (RalGDS/AF-6) domain family 4 RASSF4 6.0 signal transduction
219872_at chromosome 4 open reading frame 18 C4orf18 5.9 —
211966_at collagen, type IV, alpha 2 COL4A2 5.8 ECM organization
209859_at tripartite motif-containing 9 TRIM9 5.8 —
...
...
....
...
...
....
...
...
....
...
...
....
...
...
....
...
...
....
...
...
....
...
...
....
...
...
....
...
...
....
...
...
....
...
...
....
...
...
....
...
...
....
...
...
....
...
...
....
...
...
....
...
...
....
...
...
....
...
...
Normal human primary melanocytes were isolated from neonatal foreskins and grown in complete melanocyte growth medium (Cell Applications, Cat. No., 135–500). The complete melanocyte growth medium is consisted of the melanocyte basal medium (Cell Applications, Cat. No. 134-500) and growth supplement cocktails containing hydrocortisone (0.5mg/ml), insulin (5mg/ml), 12-O-tetradecanoylphorbol-13-acetate (10 ng/ml), bovine pitui-tary extract (21mg/ml), bFGF (1 ng/ml), heparin (1mg/ml), FBS
(0.5 %), gentamycin sulfate (50mg/ml), amphotericin B (5 ng/ml), and NaCl (45 mM).
Gene Expression Profiling
Total RNA was isolated from exponentially growing melanoma cell lines using RNeasy column purification per manufacturer’s protocol (Qiagen). Two sets of short-term cultured (2 to 3 passage numbers) normal human melanocytes were prepared from neo-natal foreskins. In order to minimize genetic variability melano-cytes from 4–5 individuals were pooled for each culture. Total RNA from normal melanocytes was extracted and purified by a combination of phase extraction and chromatography using TRIzol reagent (Invitrogen Life Technologies Inc.) and RNeasy columns (Qiagen) in order to remove melanin. In brief, exponentially growing melanocytes were lysed with TRIzol reagent and lysate was incubated at 65uC for 2 minutes to inactivate melanin. Lysate was then subjected to phase extraction and RNeasy column purification. RNA quality checks, double strand complementary DNA synthesis, hybridization with Human Genome U133 Plus 2.0 Array Chips (Affymetrix Inc. Santa Clara, CA), and initial data extraction were performed at The Gene Array Core Facility in the Malaria Research Institute (JHMRI) at The Johns Hopkins Bloomberg School of Public Health (http:// malaria.jhsph.edu/jhmri/resources_education/gene_array_core).
Data Extraction and Statistical Analysis
SAM [19], Gene Cluster 3.0 [58] and TreeView (http://bonsai.ims. u-tokyo.ac.jp/,mdehoon/software/cluster/index.html), Access,
and Excel (Microsoft, Seattle, WA) programs were used. For all of the statistical analysis beyond the initial description of datasets, microarray data were normalized (Dataset S1) and a subset of the 12 microarray data (10 from melanoma cell lines and 2 from normal human melanocytes) was obtained by filtering to require each gene probe to have at least one observation in the expression intensity resulting in a ‘present’ call from all 12 samples. This produced a subset of data containing a total of 32,632 affymetrix gene probes (Dataset S2). This filtered subset of data was used for all of the additional analysis. Cluster Analysis. Unsupervised hierarchical
clustering analysis was performed on the subset of data (without log transformation) with Gene Cluster 3.0 (http://bonsai.ims.u-tokyo.ac.jp/,mdehoon/software/cluster/index.html) by using the
correlation (uncentered) similarity metric and centeroid linkage clustering method. The resulting tree-images were visualized using Java TreeView. Statistical Analysis of Microarray (SAM). SAM was performed on the subset of array data without log transformation using SAM software package. Groups are defined based on the hierarchical clustering; for example, group 1 = less-aggressive primary melanomas (RGP melanomas: WM35, Sbcl2, WM1552C and VGP melanomas: WM902B and WM278), and group 2 = aggressive metastatic melanomas (Metastatic melanomas: WM852, WM983B, and 1205Lu; and VGP melanomas: WM983A and WM793) as seen Figure 1. Delta was chosen to limit the output gene list so that minimum predicted false-positives would be included.
Three-step Data Reduction Algorithm. In order to identify melanoma invasion-specific gene signature, uniquely designed three-step data reduction algorithm was applied to the subset of expression data. First step is that the proveset should be called as ‘present’ in three samples out of four VGP melanoma cells and two samples out of three RGP melanoma cells. Second step is that the candidate proveset should be expressed five folds or more in VGP melanoma cell lines than RGP melanoma cell lines. The last step is that the gene probesets were retained only when the expression level is greater than three folds in VGP melanoma cell lines compared to that of primary human melanocytes. The last step is implemented because the candidate gene expression level should be higher if the gene products have certain degree of functional roles in the invasion processes of malignant melanoma. The probesets, those that pass through three-step filtration criteria are subjected to probeset to gene mapping using NetAffx, a web interface program from Affymetrix Inc. Gene annotation for the gene mane, gene symbol, and GO Biological Procession Analysis also performed by the NetAffx.
Quantitative Real-time PCR
cDNA was generated by using the SuperScriptTM First-Strand Synthesis System for RT-PCR according to manufacturers instructions (Invitrogen, Carlsbad, CA). Quantitative real-time PCR was performed with an Applied Biosystems Prism 7900 HT Sequence Detection System using SYBR Green PCR Master Mix (Applied Biosystems, Foster City, CA). The thermal cycling conditions for quantitative real-time RT-PCR analysis to validate gene expression changes were as follows: hold for 10 minutes at 95uC, followed by three-step PCR for 40 cycles of 95uC for 15 seconds, 55uC to 60uC for 25 seconds, and 72uC for 30 seconds. Optimal annealing temperatures were predetermined
Probe Set ID Gene Title Gene Symbol Foldb Biological Process
214023_x_at tubulin, beta 2B TUBB2B 5.7 microtubule-based movement
204702_s_at nuclear factor (erythroid-derived 2)-like 3 NFE2L3 5.7 regulation of transcription
205599_at TNF receptor-associated factor 1 TRAF1 5.6 signal transduction
212325_at hypothetical protein, DKFZP686A01247 — 5.6 actomyosin organization
1554474_a_at monooxygenase, DBH-like 1 MOXD1 5.6 catecholamine metabolism
235116_at TNF receptor-associated factor 1 TRAF1 5.2 signal transduction
210139_s_at peripheral myelin protein 22 PMP22 5.1 peripheral nervous develop
203680_at protein kinase, cAMP-dependent, type II, beta PRKAR2B 5.0 signal transduction
a
Genes with greater than five-fold upregulation are shown.
b
Fold represents average expression ratio of VGP melanoma cells over RGP melanoma cells.
c
Gene with multiple probesets are shown with a representative probeset. doi:10.1371/journal.pone.0000594.t003
..
...
...
....
...
...
....
...
...
....
...
...
....
...
...
to ensure single amplified product. All samples were performed in triplicate. Amplification data were analyzed with an Applied Biosystems Prism Sequencer Detection Software Version 2.3 (Applied Biosystems, Forster City, CA). HumanGAPDHgene was used as endogenous control. To normalize the relative expression of the genes of interest to the GAPDHcontrol, standard curves were prepared for each gene andGAPDHin each experiment.
Semi-quantitative Duplex PCR
Semi-quantitative duplex RT-PCR was performed by an MJ Research Programmable Thermal Controller (PTC-100, Inc., Watertown, MA) and the amplified products were separated on an agarose gel. Our duplex PCR utilized 20 bp oligonucleotides to amplify regions of 300–400 bp from the genes of interest. Intitial optimization experiments were conducted to establish the most favorable primer concentrations between the genes of interest and internal control GAPDH, yielding 0.8mM and 0.04mM, re-spectively. The PCR was carried out in a total volume of 25mL,
containing 2.5mL of 10X PCR Buffer (containing 15 mM
MgCl2), 0.2 mM dNTPs, and 0.3 ul AmpliTaq Gold DNA Polymerase (Applied Biosystems, Foster City, CA). Thirty to thirty-five amplification cycles were performed by an MJ Research Programmable Thermal Controller (PTC-100, Inc., Watertown, MA), using a denaturing temperature of 95uC for 25 seconds, an annealing temperature varying between 55uC260uC (depending on gene) for 30 seconds, and primer extension at 72uC for 30 seconds. Each amplification experiment also included two negative PCR controls, a no-RNA control from reverse transcrip-tion procedures and a no-cDNA water control. Following amplification, 25mL of the samples were separated via electro-phoresis on a 3% agarose gel. The primer sequences were designed by using Primer3, primer analysis software (http://frodo. wi.mit.edu/cgi-bin/primer3/primer3_www.cgi), yielded only one amplified product and had the following sequences:
Immunofluorescence Labeling
RGP and VGP Cells were plated on glass slides and cultured in melanocyte growth media overnight without any stimulation. Cells were fixed at room temperature for 15 minutes using 3.5% para-formaldehyde solution. Cells were washed briefly with PBS and then permeabilized with either 0.5% Triton X-100 for 10 minutes or220uC cooled methanol for 15 minutes. Slides were blocked with 16% normal goat serum (Santa Cruz Biotech., Santa Cruz, CA) for 1 hour and then incubated with rabbit polyclonal IgG p65 antibody (Santa Cruz Biotech., Santa Cruz, CA) at 1:100 dilution. Subsequent to overnight incubation at 4uC, the slides were washed with PBS and incubated with goat anti-rabbit IgG-Alexa 594 (Molecular Probes Eugene, OR) at 1:200 dilution at room temperature for 1 hour. Stained slides were washed with PBS and viewed under a fluorescence microscope (Eclipse TS100, Nikon, Tokyo, Japan).
Gene Transcription Promoter Analysis
Transcription factor bindingciselement sequence profiling in the selected gene promoter was performed by using a web tool known as TESS (Transcription Element Search System, http://www.cbil. upenn.edu/tess). Each genes promoter sequences from the transcription start site up to 2.0 kb of upstream of the genes were subjected to the TESS and screened by TRANSFAC database to identify matched consensus sequences of known DNA binding transcription factors.
SUPPORTING INFORMATION
Dataset S1 A combined and normalized raw dataset from the 12 sets of microarray data (two sets of primary human melanocytes and ten melanoma cell lines).
Found at: doi:10.1371/journal.pone.0000594.s001 (18.02 MB DOC)
Dataset S2 A subset of the 12 microarray data (10 from melanoma cell lines and 2 from human primary melanocytes) was obtained by filtering to require each Affymetrix probe to have at least one observation in the expression intensity resulting in a present call from all 12 samples.
Found at: doi:10.1371/journal.pone.0000594.s002 (4.50 MB DOC)
Table S1 Results of SAM analysis between Group 1 and Group 2 melanoma cells. The results include the SAM Output showing the list of Affymetrix probesets and associated gene symbols that are differentially expressed in the two groups of melanoma cell lines.
Found at: doi:10.1371/journal.pone.0000594.s003 (3.20 MB DOC)
Table S2 Results of SAM analysis between HPMs and Group 2 melanoma cells. The results include the SAM Output showing the list of Affymetrix probesets and associated gene symbols that are downregulated in Group 2 melanoma cell lines.
Found at: doi:10.1371/journal.pone.0000594.s004 (3.05 MB DOC)
ACKNOWLEDGMENTS
We thank M. Herlyn (Wistar Institute) for generously providing melanoma cell lines used in these studies. We thank G. Parmigiani (Johns Hopkins University School of Medicine) for his statistical support and members of the Alani Lab for their careful review of this manuscript and helpful comments.
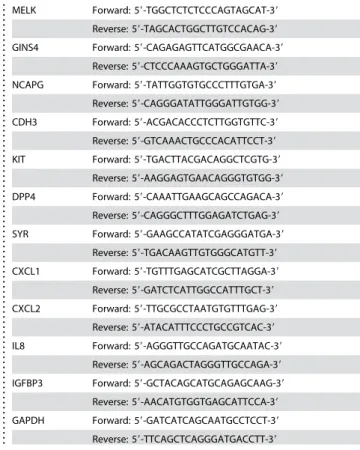
MELK Forward: 59-TGGCTCTCTCCCAGTAGCAT-39
Reverse: 59-TAGCACTGGCTTGTCCACAG-39
GINS4 Forward: 59-CAGAGAGTTCATGGCGAACA-39
Reverse: 59-CTCCCAAAGTGCTGGGATTA-39
NCAPG Forward: 59-TATTGGTGTGCCCTTTGTGA-39
Reverse: 59-CAGGGATATTGGGATTGTGG-39
CDH3 Forward: 59-ACGACACCCTCTTGGTGTTC-39
Reverse: 59-GTCAAACTGCCCACATTCCT-39
KIT Forward: 59-TGACTTACGACAGGCTCGTG-39
Reverse: 59-AAGGAGTGAACAGGGTGTGG-39
DPP4 Forward: 59-CAAATTGAAGCAGCCAGACA-39
Reverse: 59-CAGGGCTTTGGAGATCTGAG-39
SYR Forward: 59-GAAGCCATATCGAGGGATGA-39
Reverse: 59-TGACAAGTTGTGGGCATGTT-39
CXCL1 Forward: 59-TGTTTGAGCATCGCTTAGGA-39
Reverse: 59-GATCTCATTGGCCATTTGCT-39
CXCL2 Forward: 59-TTGCGCCTAATGTGTTTGAG-39
Reverse: 59-ATACATTTCCCTGCCGTCAC-39
IL8 Forward: 59-AGGGTTGCCAGATGCAATAC-39
Reverse: 59-AGCAGACTAGGGTTGCCAGA-39
IGFBP3 Forward: 59-GCTACAGCATGCAGAGCAAG-39
Reverse: 59-AACATGTGGTGAGCATTCCA-39
GAPDH Forward: 59-GATCATCAGCAATGCCTCCT-39
Reverse: 59-TTCAGCTCAGGGATGACCTT-39
..
....
...
...
....
...
...
....
...
...
....
...
...
....
...
...
....
...
...
....
...
...
....
...
...
....
...
Author Contributions
Conceived and designed the experiments: RA BR. Performed the experiments: BR DK AD. Analyzed the data: RA BR DK AD.
Contributed reagents/materials/analysis tools: BR. Wrote the paper: RA BR.
REFERENCES
1. Jemal A, Siegel R, Ward E, Murray T, Xu J, et al. (2006) Cancer statistics, 2006. CA Cancer J Clin 56: 106–130.
2. Quackenbush J (2006) Microarray analysis and tumor classification. N Engl J Med 354: 2463–2472.
3. Bittner M, Meltzer P, Chen Y, Jiang Y, Seftor E, et al. (2000) Molecular classification of cutaneous malignant melanoma by gene expression profiling. Nature 406: 536–540.
4. Smith AP, Weeraratna AT, Spears JR, Meltzer PS, Becker D (2004) SAGE identification and fluorescence imaging analysis of genes and transcripts in melanomas and precursor lesions. Cancer Biol Ther 3: 104–109.
5. Weeraratna AT, Becker D, Carr KM, Duray PH, Rosenblatt KP, et al. (2004) Generation and analysis of melanoma SAGE libraries: SAGE advice on the melanoma transcriptome. Oncogene 23: 2264–2274.
6. Rumpler G, Becker B, Hafner C, McClelland M, Stolz W, et al. (2003) Identification of differentially expressed genes in models of melanoma progression by cDNA array analysis: SPARC, MIF and a novel cathepsin protease characterize aggressive phenotypes. Exp Dermatol 12: 761–771. 7. Hoek K, Rimm DL, Williams KR, Zhao H, Ariyan S, et al. (2004) Expression
profiling reveals novel pathways in the transformation of melanocytes to melanomas. Cancer Res 64: 5270–5282.
8. Gyorffy B, Lage H (2007) A Web-based data warehouse on gene expression in human malignant melanoma. J Invest Dermatol 127: 394–399.
9. Haqq C, Nosrati M, Sudilovsky D, Crothers J, Khodabakhsh D, et al. (2005) The gene expression signatures of melanoma progression. Proc Natl Acad Sci U S A 102: 6092–6097.
10. Winnepenninckx V, Lazar V, Michiels S, Dessen P, Stas M, et al. (2006) Gene expression profiling of primary cutaneous melanoma and clinical outcome. J Natl Cancer Inst 98: 472–482.
11. Jaeger J, Koczan D, Thiesen HJ, Ibrahim SM, Gross G, et al. (2007) Gene expression signatures for tumor progression, tumor subtype, and tumor thickness in laser-microdissected melanoma tissues. Clin Cancer Res 13: 806–815. 12. Hsu M-Y ED, Herlyn M (1999) The Wistar (WM) melanoma cell lines; Palsson,
Masters, eds. London: Kluwer Acad. Publ. pp 259–274.
13. Satyamoorthy K, DeJesus E, Linnenbach AJ, Kraj B, Kornreich DL, et al. (1997) Melanoma cell lines from different stages of progression and their biological and molecular analyses. Melanoma Res 7 Suppl 2: S35–42. 14. Meier F, Nesbit M, Hsu MY, Martin B, Van Belle P, et al. (2000) Human
melanoma progression in skin reconstructs : biological significance of bFGF. Am J Pathol 156: 193–200.
15. Mancianti ML, Herlyn M (1989) Tumor progression in melanoma: the biology of epidermal melanocyte in vitro; ContiCJea, ed. New York: Raven Press. pp 369.
16. Herlyn D, Adachi K, Koprowski H, Herlyn M (1991) Experimental model of human melanoma metastasis. Cancer Treat Res 54: 105–118.
17. Valyi-Nagy I, Rodeck U, Kath R, Mancianti ML, Clark WH, Jr, et al. (1991) The human melanocyte system as a model for studies on tumor progression. Basic Life Sci 57: 315–326.
18. Herlyn M, Thurin J, Balaban G, Bennicelli JL, Herlyn D, et al. (1985) Characteristics of cultured human melanocytes isolated from different stages of tumor progression. Cancer Res 45: 5670–5676.
19. Tusher VG, Tibshirani R, Chu G (2001) Significance analysis of microarrays applied to the ionizing radiation response. Proc Natl Acad Sci U S A 98: 5116–5121.
20. Obuse C, Iwasaki O, Kiyomitsu T, Goshima G, Toyoda Y, et al. (2004) A conserved Mis12 centromere complex is linked to heterochromatic HP1 and outer kinetochore protein Zwint-1. Nat Cell Biol 6: 1135–1141.
21. Trinkle-Mulcahy L, Andersen J, Lam YW, Moorhead G, Mann M, et al. (2006) Repo-Man recruits PP1 gamma to chromatin and is essential for cell viability. J Cell Biol 172: 679–692.
22. Hirano T, Kobayashi R, Hirano M (1997) Condensins, chromosome condensation protein complexes containing XCAP-C, XCAP-E and a Xenopus homolog of the Drosophila Barren protein. Cell 89: 511–521.
23. Kimura K, Cuvier O, Hirano T (2001) Chromosome condensation by a human condensin complex in Xenopus egg extracts. J Biol Chem 276: 5417–5420. 24. Ono T, Losada A, Hirano M, Myers MP, Neuwald AF, et al. (2003) Differential
contributions of condensin I and condensin II to mitotic chromosome architecture in vertebrate cells. Cell 115: 109–121.
25. Simons-Evelyn M, Bailey-Dell K, Toretsky JA, Ross DD, Fenton R, et al. (2001) PBK/TOPK is a novel mitotic kinase which is upregulated in Burkitt’s lymphoma and other highly proliferative malignant cells. Blood Cells Mol Dis 27: 825–829.
26. Raemaekers T, Ribbeck K, Beaudouin J, Annaert W, Van Camp M, et al. (2003) NuSAP, a novel microtubule-associated protein involved in mitotic spindle organization. J Cell Biol 162: 1017–1029.
27. Li F, Ambrosini G, Chu EY, Plescia J, Tognin S, et al. (1998) Control of apoptosis and mitotic spindle checkpoint by survivin. Nature 396: 580–584. 28. Vega H, Waisfisz Q, Gordillo M, Sakai N, Yanagihara I, et al. (2005) Roberts
syndrome is caused by mutations in ESCO2, a human homolog of yeast ECO1 that is essential for the establishment of sister chromatid cohesion. Nat Genet 37: 468–470.
29. Sun LQ, Lee DW, Zhang Q, Xiao W, Raabe EH, et al. (2004) Growth retardation and premature aging phenotypes in mice with disruption of the SNF2-like gene, PASG. Genes Dev 18: 1035–1046.
30. Beullens M, Vancauwenbergh S, Morrice N, Derua R, Ceulemans H, et al. (2005) Substrate specificity and activity regulation of protein kinase MELK. J Biol Chem 280: 40003–40011.
31. Zindy F, Soares H, Herzog KH, Morgan J, Sherr CJ, et al. (1997) Expression of INK4 inhibitors of cyclin D-dependent kinases during mouse brain de-velopment. Cell Growth Differ 8: 1139–1150.
32. Ueno M, Itoh M, Kong L, Sugihara K, Asano M, et al. (2005) PSF1 is essential for early embryogenesis in mice. Mol Cell Biol 25: 10528–10532.
33. Kong L, Ueno M, Itoh M, Yoshioka K, Takakura N (2006) Identification and characterization of mouse PSF1-binding protein, SLD5. Biochem Biophys Res Commun 339: 1204–1207.
34. Banerjee D, Mayer-Kuckuk P, Capiaux G, Budak-Alpdogan T, Gorlick R, et al. (2002) Novel aspects of resistance to drugs targeted to dihydrofolate reductase and thymidylate synthase. Biochim Biophys Acta 1587: 164–173.
35. Nishimura EK, Yoshida H, Kunisada T, Nishikawa SI (1999) Regulation of E-and P-cadherin expression correlated with melanocyte migration E-and di-versification. Dev Biol 215: 155–166.
36. Pla P, Moore R, Morali OG, Grille S, Martinozzi S, et al. (2001) Cadherins in neural crest cell development and transformation. J Cell Physiol 189: 121–132. 37. Mackenzie MA, Jordan SA, Budd PS, Jackson IJ (1997) Activation of the receptor tyrosine kinase Kit is required for the proliferation of melanoblasts in the mouse embryo. Dev Biol 192: 99–107.
38. Hornyak TJ, Hayes DJ, Chiu LY, Ziff EB (2001) Transcription factors in melanocyte development: distinct roles for Pax-3 and Mitf. Mech Dev 101: 47–59. 39. Vachtenheim J, Novotna H (1999) Expression of genes for microphthalmia isoforms, Pax3 and MSG1, in human melanomas. Cell Mol Biol (Noisy-le-grand) 45: 1075–1082.
40. Spritz RA (1994) Molecular genetics of oculocutaneous albinism. Hum Mol Genet 3 Spec No: 1469–1475.
41. Du J, Miller AJ, Widlund HR, Horstmann MA, Ramaswamy S, et al. (2003) MLANA/MART1 and SILV/PMEL17/GP100 are transcriptionally regulated by MITF in melanocytes and melanoma. Am J Pathol 163: 333–343. 42. Suzuki I, Cone RD, Im S, Nordlund J, Abdel-Malek ZA (1996) Binding of
melanotropic hormones to the melanocortin receptor MC1R on human melanocytes stimulates proliferation and melanogenesis. Endocrinology 137: 1627–1633.
43. Bonitsis N, Batistatou A, Karantima S, Charalabopoulos K (2006) The role of cadherin/catenin complex in malignant melanoma. Exp Oncol 28: 187–193. 44. Wesley UV, McGroarty M, Homoyouni A (2005) Dipeptidyl peptidase inhibits
malignant phenotype of prostate cancer cells by blocking basic fibroblast growth factor signaling pathway. Cancer Res 65: 1325–1334.
45. Coopman PJ, Mueller SC (2006) The Syk tyrosine kinase: A new negative regulator in tumor growth and progression. Cancer Lett 241: 159–173. 46. Ueda Y, Richmond A (2006) NF-kappaB activation in melanoma. Pigment Cell
Res 19: 112–124.
47. Hsu MY, Shih DT, Meier FE, Van Belle P, Hsu JY, et al. (1998) Adenoviral gene transfer of beta3 integrin subunit induces conversion from radial to vertical growth phase in primary human melanoma. Am J Pathol 153: 1435–1442. 48. Clark WH Jr, Elder DE, Guerry Dt, Epstein MN, Greene MH, et al. (1984) A
study of tumor progression: the precursor lesions of superficial spreading and nodular melanoma. Hum Pathol 15: 1147–1165.
49. Grossman D, Altieri DC (2001) Drug resistance in melanoma: mechanisms, apoptosis, and new potential therapeutic targets. Cancer Metastasis Rev 20: 3–11. 50. Ohoka N, Yoshii S, Hattori T, Onozaki K, Hayashi H (2005) TRB3, a novel ER stress-inducible gene, is induced via ATF4-CHOP pathway and is involved in cell death. EMBO J 24: 1243–1255.
51. Atkins MB (1997) The treatment of metastatic melanoma with chemotherapy and biologics. Curr Opin Oncol 9: 205–213.
52. Houghton AN, Albino AP, Cordon-Cardo C, Davis LJ, Eisinger M (1988) Cell surface antigens of human melanocytes and melanoma. Expression of adenosine deaminase binding protein is extinguished with melanocyte transformation. J Exp Med 167: 197–212.
54. Muthusamy V, Duraisamy S, Bradbury CM, Hobbs C, Curley DP, et al. (2006) Epigenetic silencing of novel tumor suppressors in malignant melanoma. Cancer Res 66: 11187–11193.
55. Karin M (2006) Nuclear factor-kappaB in cancer development and progression. Nature 441: 431–436.
56. Cilensek ZM, Yehiely F, Kular RK, Deiss LP (2002) A member of the GAGE family of tumor antigens is an anti-apoptotic gene that confers resistance to Fas/
CD95/APO-1, Interferon-gamma, taxol and gamma-irradiation. Cancer Biol Ther 1: 380–387.
57. Rofstad EK, Halsor EF (2000) Vascular endothelial growth factor, interleukin 8, platelet-derived endothelial cell growth factor, and basic fibroblast growth factor promote angiogenesis and metastasis in human melanoma xenografts. Cancer Res 60: 4932–4938.