GEOSPATIAL INFORMATION FROM SATELLITE IMAGERY FOR
GEOVISUALISATION OF SMART CITIES IN INDIA
M. Mohan
Associate Professor of Geography
Centre for the Study of Regional Development, School of Social Sciences – III Jawaharlal Nehru University, New Delhi, INDIA – madanmohan@jnu.ac.in
Commission VIII, WG VIII/8
KEY WORDS: Geospatial Information, Geovisualisation, Globalisation, Urbanisation, Smart Cities,Urban Plans and Policies.
ABSTRACT:
In the recent past, there have been large emphasis on extraction of geospatial information from satellite imagery. The Geospatial information are being processed through geospatial technologies which are playing important roles in developing of smart cities, particularly in developing countries of the world like India. The study is based on the latest geospatial satellite imagery available for the multi-date, multi-stage, multi-sensor, and multi-resolution. In addition to this, the latest geospatial technologies have been used for digital image processing of remote sensing satellite imagery and the latest geographic information systems as 3-D GeoVisualisation, geospatial digital mapping and geospatial analysis for developing of smart cities in India. The Geospatial information obtained from RS and GPS systems have complex structure involving space, time and presentation. Such information helps in 3-Dimensional digital modelling for smart cities which involves of spatial and non-spatial information integration for geographic visualisation of smart cites in context to the real world. In other words, the geospatial database provides platform for the information visualisation which is also known as geovisualisation. So, as a result there have been an increasing research interest which are being directed to geospatial analysis, digital mapping, geovisualisation, monitoring and developing of smart cities using geospatial technologies. However, the present research has made an attempt for development of cities in real world scenario particulary to help local, regional and state level planners and policy makers to better understand and address issues attributed to cities using the geospatial information from satellite imagery for geovisualisation of Smart Cities in emerging and developing country, India.
1. INTRODUCTION
1.1 Geospatial Information
The geographic information from remote sensing in form of spatial and non-spatial data have largely been used in the present information technology age by the society. The geospatial data have a complex structure involving space, time and presentation. The integration of spatial and non-spatial data and its visualisation is known as geographic visualisation or geovisualisation. The visualisation involved the use of maps or 3-D displays to represent physical space. So, the multiple interactively linked view providing different perspectives into the data has become kind of standard in geovisualisation (Mao et al., 2011). There has been paradigm shift in creating, viewing and utilizing geospatial data for planning, navigation and traffic management of urban areas. 3-Dimensional information is preferred over conventional 2-Dimensional maps. Buildings are important objects of any 3-D City model. The algorithms for fully automatic extraction of buildings have not yet been full-fledge developed as a result many researchers in this field opt for semi-automatic methods for 3-D urban landscape modelling (Gruen and Wany, 1999).
For large urban scenarios LIDAR data can be utilized. Another study uses projective geometry for a 3-D reconstruction from image sequences. Similarly a study use stereo approaches for 3-D building reconstruction (Fraser et al., 2002). Aerial images have the advantage of very high geometric resolution and low noise levels. In the recent past, there have been considerable improvement in the technology to provide better resolution images from remote sensing space platforms. The images from Cartosat-2, Quickbird, IKONOS, Worldview-1/2, and Geoeye-1
etc. satellites have geometric resolution less than one meter. But, these geometric resolution levels are not sufficient to generate finer models, however, extraction and representation of major urban features are still possible with uses of these remote sensing imagery (Thomas and Reintarz, 2008). Multi-spectral satellite imagery provides valuable information for urban mapping and 3-D modelling of urban landscape. The use of such exhaustive surface data for urban landscape description is attracting wide range of interest in the geographic information, GI Science community, due to progresses in obtaining accurate surface geometry from remote sensing data. The process of geospatial information extraction from these sources usually performed manually using heads-up digitization or digitally using image classification algorithms (Fan and Meng, 2012). So, at present, the high-resolution satellite sensors available at the less than 0.5 m resolution, hence it becomes more practical and economical to utilize stereo satellite imagery to generate less than 3.0 m digital surface model’s (DSM’s) without any requirements for aerial mapping permits, licenses or mapping in restrictive air space at the regional and global levels.
1.2 Process of Urbanisation
experience a steady decline in the quality of physical environment. So, the reaction to increasing urbanization and the growth and development of cities needs to be viewed positively (Bhattacharya, 2006). Though there is no denial of the fact that the urbanisation should be more balanced and more approachable to national development goals, at large.
The definition of urban area varies from country to country in the world. Besides this, the periodic reclassification of urban also vary within one country over time, making direct comparisons difficult for the different periods (Knox, 1994; Michael et al., 2010; Pacione, 2009; Peter et al., 2013 and Rain, 2007). The urban area can be defined by one or more criteria as followed during different censuses. In the Census of India 2011, the demarcation of urban area is based on the specified criteria which are as firstly, “all places with a municipality, corporation, cantonment board or notified town area committee, etc. (known as statutory town); secondly, all other places which satisfied the following criteria (known as census town) as: (a) a minimum population of 5,000; (b) at least 75 per cent of the male main working population engaged in non-agricultural pursuits; and (c) a density of population of at least 400 persons per sq. km” (CoI, 2011). Besides this, the increase in proportion of urban population over time, calculated as the rate of growth of urban population minus that of the total population. It is a fact that the positive rate of urbanization result when the urban population grows at a faster rate than the total population. Whereas, there is found an increasing concentration of the number of people who live in towns and cities. The pace of urban population growth depends on the natural increase of the urban population and the population gained by urban areas through both the net rural-urban migration and the reclassification of rural settlements into towns and cities.
2. RESEARCH OBJECTIVES
The geospatial technology is playing an essential role in geovisualisation of cities particularly for development of smart cities in country, India. The City is the hub for concentration of population and economic development. In view of this, the rational of present study is based on urban challenges and their resolutions through geospatial information and technologies in context to followings:
i. to evaluate pragmatic of geospatial technologies in geovisualisation of smart cities;
ii. to examine geospatial trends and patterns of process of urbanization;
iii. to analyse geospatial distribution and development of smart cities; and
iv. to suggest suitable geospatial strategies for development of smart cities.
However, the process of urbanization is a challenging task in context to development of smart cities. The present study tried to evolve the preliminary scenario of the development of “Smart Cities” and their future prospects for economic and sustainable development of the country, India. So, the present research has made an attempt to help urban planners and policy makers.
3. STUDY AREA – INDIA
India is situated in the north of equator between the geographical extent of 08° 04’ and 37° 06’ north latitudes and 68° 07’ and 97° 25’ east longitudes. The 3-Dimensional physical geographic features map of the country, India is presented in the Figure 1.
Whereas, the States level administrative divisions based on the Census of India, 2011 is presented in Figure 2 as follows:
Source: CoI, 2011. Census of India 2011, Primary Census Abstract. Office of the Registrar General & Census Commissioner, Ministry of Home Affairs, Government of India, New Delhi.
Figure 1 and 2. 3-D Physiographic Features for India and Administrative Division by States of India, 2011, respectively.
So, the 3-Dimensional landscape model generated using remote sensing imagery of google earth for India and its surrounding environment is presented above in Figure 1. The generated digital 3-D physical landscape model can help urban planners and policy makers to better understand for development, management and geovisualization of city (Batty et al., 2001).
4. DATABASE AND RESEARCH METHODOLOGY
The geospatial information from the open series topographic sheets on the scale of 1: 2,500,000 have been extracted in form of the boundary maps and other relevant spatial features information. These digital topographic sheets have been obtained from the Survey of India, Dehradun. On the other hand, the multispectral digital imagery of the IRS series of satellites procured from the National Remote Sensing Centre (NRSC), Indian Space Research Organisation (ISRO), Department of Space (DOS), Govt. of India, Hyderabad, India. The high resolution multispectral digital imagery of the Landsat satellites have also been obtained from the United States Geological Survey (USGS) website. The details of the satellite imagery used in the present study is given below in the Table 1.
Notes: Image courtesy of the U.S. Geological Survey (USGS), United States of America and the National Remote Sensing Centre (NRSC), Hyderabad, India.
The present study is also based on the latest data available from the different sources to achieve the specified objectives of the research. There are different sources of ancillary data available from the records of the Census of India 2001 and 2011. So, the Primary Census Abstract, Final Population Total, and the Village and Town Directory and the Census Atlas – India have been used in present research. In addition to this, a number of development plans and policies, records, reports and documents published by the different States and Central Government departments and ministries have also been collected from the Department of Land and Development and the Department of Urban Development, Ministry of Urban Development, Govt. of India, New Delhi.
Urban Landscape mapping for the study area has been carried out by standard methods of analysis of remotely sensed data followed by ground truth collection, and visual interpretation of satellite imagery. The Landsat and IRS visible and infrared spectral bands have been used of which details is given in the above Table 1. So, the Digital Image Processing (DIP) has carried out with the help of ERDAS Imagine software based on broadband satellite imagery (Jenson, 2009). Besides this, the present study is based on the spatial and non-spatial data analyses in the ArcGIS application software for geographic analysis and geospatial processing and geovisualisation (Chang, 2008). So, the software’s specific in-built Algorithms, mathematical / statistical methods and models have been applied in the present research.
5. RESULTS AND DISCUSSIONS
5.1 Geospatial Trends of Urbanisation
On the basis of results obtained for the period 2011, there is found that out of the total population of 1,210.19 million, about 377.10 million live in urban areas which is accounting for 31.20 per cent of the total population. On the other hand, the proportion of population living in the urban areas of country increased from 27.82 per cent in 2001 to about 31.20 per cent in 2011. The number of towns also increased from 5,161 in 2001 to 7,935 in 2011 as evidenced by Table 2. Such kind of the increasing pace of urbanization resulted intoincreasing pressure on the level of services in the urban centers. So, by and large, the urbanization has also been accompanied with an increase in the urban poor population. Besides this, there are four components of urban population growth as the natural increase, the rural to urban migration, the reclassification, and the boundary changes of the existing urban centers (Carter, 2010). Based on the Census of India reports, it is found that the natural increase during 1991-2001 was about 59 per cent, on the one hand. And, the rural-urban migration is accounted for about 21 per cent during the same period, on the other hand. Moreover, the remaining urban growth is due to reclassification or boundary changes of the towns and cities in the country, India.
It is important to point out that the significant feature of urbanization is the growth of large towns and metropolitan cities. Such growth of urban centers are the challenges of urbanization in India. For instance, in 1901 only the Calcutta City had more than one lakh population. Later on, such cities number was increased over the periods and there were about 12 cities in 1981, which was almost doubled to about 23 cities in 1991. Moreover, their number was increased to about 35 cities in 2001 and to about 53 cities in 2011 as also evidenced by the Table 2 and 5. In addition to this, the cities altogether accounted for the population of about 108 million in 2001. All these metropolitan cities altogether accounted for nearly 11 per cent of the country’s total population and 38 per cent of the urban population. As mentioned earlier, there are 53 urban agglomerations with the population of
one lakh or more as of 2011. So, there is found approximately 43 per cent of the urban population living in these cities in India. Whereas, one of the important aspect of metropolitan growth is that there is very favourable geospatial spread of these large cities that may help in achieving the goals of the balanced urban growth in the country, India.
So, the urban population projections indicate that by 2030, the urban population will be about 575 million constituting over 40 per cent of total population in India (United Nations, 2006 and 2014; and UNPD, 2009). In lieu of this, there is found that most of the cities are experiencing a steady decline in the quality of physical environment. For instance, there is found a lots of stress on physical infrastructure, inadequate delivery of basic services, air and water pollution, uncollected wastes, etc. are some of more recently emerging problems in urban areas of the country. So, the urbanization is inevitable and needs to be considered as positive in national development. The response to increasing urbanization and growth and development of cities needs to be viewed positively. There is no denial of the fact that it should be more balanced and more responsive in context to the national development goals (Smith, 1975). The basic prerequisite of the present is that these cities need to be better managed and efforts are to be made to improve urban land governance in the country, India.
Notes: * Class-I Town/City with population of 1,00,000 & above; ** Cities including Metropolitan Cities with more than Million+ (Plus) Population.
Source: CoI (2011) Census of India 2011, Primary Census Abstract, Office of the Registrar General & Census Commissioner, Ministry of Home Affairs, Government of India, New Delhi.
Table 2. Urban Population – Towns, Cities and Urban Agglomerations in India: 1981 to 2011.
The total urban population has been increased over the periods as it is accounted for about 23.73 per cent which further increased to about 26.13 per cent and about 27.82 per cent in 1981, 1991 and 2001, respectively. In addition to this, the total urban proportion was further increased to about 31.20 per cent in 2011 which accounted for about 377 million persons of the total population as also evidenced by the above Table 2. Whereas, the statutory towns are first category of urban units notified under law by the concerned State and Union territory governments. These statutory towns have local bodies like municipal corporations, municipalities, municipal committees, etc. irrespective of their demographic characteristics. The number of statutory towns were accounted for about 3,799 in 2001 which further increased to about 4,041 in 2011. Besides this, the second category of towns is known as the Census Towns. These are identified on the basis of census data which accounted for about 1,362 towns in 2001 and later on increased to about 3,894 in 2011. In addition to this, the number of all class size towns was
Urban Population 1981 1991 2001 2011
Urban Population
(as % to total population) 23.73 26.13 27.82 31.20
Statutory Towns - - 3,799 4,041
Census Towns - - 1,362 3,894
All Class Towns & Cities –
Urban Settlements & Centres
(I-VI size classes)
4,019 4,680 5,161 7,935
Urban Agglomerations (UA)
& Cities * 216 296 394 475
Urban Out Growth (OG) - - 962 981
increased from 4,019 in 1981 to 4,680 in 1991 and further increased to 5,161 in 2001. In addition to this, at the 2011 Census, there were about 7,935 towns in the country, India. So, there by an increase of about 2,774 towns since the last Census 2001. Many of these towns are part of urban agglomerations and the rest are independent towns in the country, India (CoI, 2011).
5.2 Geospatial Trends of Urban Agglomeration
The urban agglomeration is a continuous urban spread constituting a town and its adjoining outgrowths (OGs). In other words, the two or more physically contiguous towns together with or without outgrowths of such towns form the urban agglomeration. The urban agglomeration must consist of at least a statutory town on the one hand and its total population including all the constituents put together which should not be less than 20,000 on the other hand, as per the 2001 Census. In varying local conditions, there are similar other combinations which have been treated as urban agglomerations satisfying the basic condition of contiguity. There were about 216 cities and urban agglomerations in 1981 which number increased to about 296 in 1991. Likewise, their number was further increased to about 394 in 2001. And, thereafter, it was increased to about 475 in 2011. For instance, the Greater Mumbai and the Delhi Metropolitan, are some of the distinct urban agglomerations of the country, India.
The Outgrowth is a viable unit such as a village or a hamlet on the one hand. And, an enumeration block made up of such village or hamlet and clearly identifiable in terms of its boundaries and location, on the other hand. Some of the examples of the urban outgrowth are the railway colony, university campus, port area, military camps, etc. (Rain, 2007). All these usually come up near a statutory town outside its statutory limits but within the revenue limits of villages contiguous to the town. While determining the outgrowth of a town, it has been ensured that it possesses the urban features in terms of infrastructure and amenities such as metalled roads, electricity, tap water, drainage system for disposal of sewage wastes, educational institutions, post offices, medical facilities, banks etc., on the one hand. And, it must be physically contiguous with the core town of the urban agglomeration, on the other hand. There were about 981 towns out growth in 2011 Census as compared to 962 towns out growth in 2001 Census in the country, India which was also evidenced by the Table 2.
Source: CoI (2011) Census of India 2011, Primary Census Abstract, Office of the Registrar General & Census Commissioner, Ministry of Home Affairs, Government of India, New Delhi.
Table 3. Towns and Cities based on Population Size in India: 1981 to 2011.
The Towns and urban agglomerations are grouped on the basis of their population size for different censuses as presented in the Table 3. Besides this, the towns and urban agglomerations which have at least 1,00,000 population are categorized as Class I urban
center. In the Census 2011, there are about 468 such urban centers as is evidenced by the Table 3. The corresponding number of such towns is about 441 in 2001 Census. So, there are about 264.90 million persons, constituting 64.82 per cent of the total urban population, who live in these Class I towns and urban agglomerations as is evidenced by the Table 4. However, the population proportion of Class I towns recorded an increase in 2011 Census in comparison to the previous 2001 Census. Whereas, the proportion of population in the remaining classes of towns found nominal as is evidenced by the Table 4.
Size of Population
Class/ Categor
y
1981 1991 2001 2011
1,00,000 & above I 52.66 56.68 61.48 64.82
50, 000 to 99, 999 II 13.98 13.33 12.23 11.42
20, 000 to 49, 999 III 17.04 16.35 15.00 14.12
10, 000 to 19, 999 IV 11.21 9.77 8.08 7.45
5, 000 to 9, 9999 V 4.40 3.43 2.85 1.98
Less than 5, 000 VI 0.72 0.45 0.29 0.21
Total 100 100 100 100
Source: CoI (2011) Census of India 2011, Primary Census Abstract, Office of the Registrar General & Census Commissioner, Ministry of Home Affairs, Government of India, New Delhi.
Table 4. Population Growth among the Six-fold Classification of Towns and Cities in India: 1981 to 2011.
In other words, out of the total towns and cities of about 7,935, there were about 468 towns and cities belonging to Class I category. There were about 53 towns and urban agglomerations, each one of them having population of above one lakh as evidenced by the Tables 2. Besides this, there were number of major urban centers in the country known as the million plus cities and urban agglomerations. For instance, there was about 160.7 million persons which accounted for about 42.61 per cent of the urban population who live in these million plus cities and urban agglomerations (CoI, 2011). Whereas, there were about 18 new towns and urban agglomerations which added to this list since the last Census 2001.
5.3 Geospatial Patterns of Urbanisation
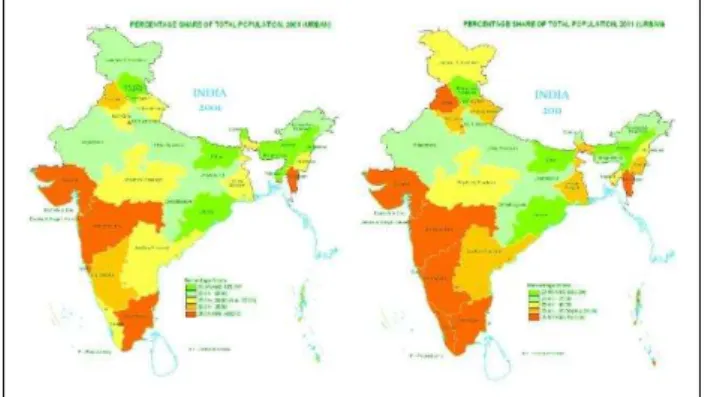
The Geospatial patterns of urbanization in terms of percentage share of urban population to total population was found high among industrialized States, particularly, the western and southern States as the Gujarat, Maharashtra, Tamil Naidu in 2001 and likewise in 2011 with the addition of Karnataka State in the country as evidenced by Figures 3 and 4.
Source: CoI (2011) Census of India 2011, Primary Census Abstract, Office of the Registrar General & Census
Size of Population Class/ Categ
ory
1981 1991 2001 2011
1,00,000 & above I 226 322 441 468
50, 000 to 99, 999 II 325 421 496 601
20, 000 to 49, 999 III 883 1,161 1,399 2,047
10, 000 to 19, 999 IV 1,247 1,451 1,563 2,451
5, 000 to 9, 9999 V 920 971 1,041 2,147
Less than 5, 000 VI 348 289 232 221
Commissioner, Ministry of Home Affairs, Government of India, New Delhi.
Figures 3 and 4. Geospatial Patterns of Urbanisation in India, 2001 and 2011.
So, the comparative scenario of levels of urbanization in terms of percentage share of urban population to total population for whole country, India for periods of 2001 and 2011 are also presented in Figures 3 and 4. Whereas, the Geospatial patterns of urbanization in terms of distribution of cities and mega cities which is found highly uneven among States and Union territories of the country, India during periods of 1981, 1991, 2001 and 2011 is clearly accessible by Table 5. It is noteworthy to mention that in terms of the total number of cities, there is found an increasing trend over the periods since 1981. Such as, there are about 12 cities in 1981. These cities are almost doubled to about 23 in 1991. These cities further increased to about 35 in 1991. Moreover, there are about 53 cities in 2011 as also evidenced by Table 5.
States
1981 1991 2001 2011
S.
C
ities Cities
Andhra Pradesh 1 2 2 3 5
Hyderabad, Vishakhapatanam (GVMC) & Vijayawada
Arunachal Pradesh – – – – 1 –
Assam – – – – 1 –
Bihar – 1 3 1 3 Patna
Chhattisgarh – – – 2 2 Raipur, Dur-Bhilainagar
Goa – – – – 1 –
Gujarat 1 3 4 4 6 Ahmdabad, Surat,
Vadodra & Rajkot
Haryana – – 1 1 2 Faridabad
Himachal Pradesh – – – – 1 –
Jammu & Kashmir – – – 1 1 Srinagar
Jharkhand – – 1 3 1 Jameshedpur, Dhanbad
& Rachi
Karnataka 1 1 2 1 6 Banglore
Kerala – 1 1 7 1
Kochi, Kozhikode,
Thrissur, Malappuram, Triuvananthapuram, Kannur & Kollam
Madhya Pradesh – 2 3 4 7 Indore, Bhopal, Jabalpur
& Gwalior
Maharashtra 3 3 4 6 10
G. Mumbai, Pune,
Nagpur, Nasik, Vasai Virar City & Aurangabad
Manipur – – – – 1 –
Meghalaya – – – – 1 –
Mizoram – – – – 1 –
Nagaland – – – – 1 –
Orissa – – – – 2 –
Punjab – 1 2 2 3 Ludhiana & Amritsar
Rajasthan 1 1 1 3 4 Jaipur, Jodhpur & Kota
Sikkim – – – – 1 –
Tamil Nadu 1 3 3 4 12
Chennai, Coimbatore,
Madurai &
Tiruchirappalli
Tripura – – – – 1 –
Uttar Pradesh 2 3 6 7 13
Kanpur, Lucknow,
Ghaziabad, Agra,
Varanasi, Meerut &
Allahabad
Uttarakhand – – – – 1 –
West Bengal 1 1 1 2 4 Kolkota & Asansol
Union Territories Cities
Andaman & Nicobar
Islands – – – – 1 –
Chandigarh – – – 1 1 Chandigarh
Dadra & Nagar Haveli – – – – 1 –
Daman & Diu – – – – 1 –
Lakshadweep – – – – 1 –
NCT of Delhi 1 1 1 1 1 Delhi
Puducherry – – – 1 –
Total 12 23 35 53 100
Notes: Table excludes the states of Assam and Jammu & Kashmir. S.
Cities – the proposed 100 Smart Cities in India.
Source: CoI (2011) Census of India 2011, Primary Census Abstract, Office of the Registrar General & Census Commissioner, Ministry of Home Affairs, Government of India, New Delhi.
Table 5. State-wise Distribution of Cities and Mega Cities in India: 1981 to 2011.
5.4 Geospatial Distribution of Mega Cities
It is noteworthy to mention that among the million plus cities and urban agglomerations, there are three very large cities and urban agglomerations with more than 10 million peoples, in the country, India. In other words, these are known as the mega cities. For instance, the Greater Mumbai urban agglomeration is one of them which accounted for about 18.40 million population. Whereas, The Delhi urban agglomeration accounted for about 16.30 million population. The Kolkata urban agglomeration accounted for about 14.10 million population. So, it is also important to mention that the largest urban agglomeration is the Greater Mumbai which is followed by Delhi urban agglomeration in the country, India. Whereas, the Kolkata urban agglomeration which held the second rank in Census 2001 replaced by Delhi urban agglomeration in Census 2011. It is also significant to point out that the population growth of these mega cities has been slowed down considerably during the last decade. For instance, the Greater Mumbai urban agglomeration recorded to about 30.47 per cent population growth during 1991-2001 which recorded to decline to about 12.05 per cent during 2001-2011. Similarly, the Delhi urban agglomeration recorded growth of about 52.24 per cent in 1991-2001 which further declined to about 26.69 per cent in 2001-2011. Likewise, the Kolkata urban agglomeration recorded growth of about 19.60 per cent in 1991-2001 which also declined to about 6.87 per cent in 1991-2001-2011. So, all these mega cities growth of population have been slowed down considerably over the periods.
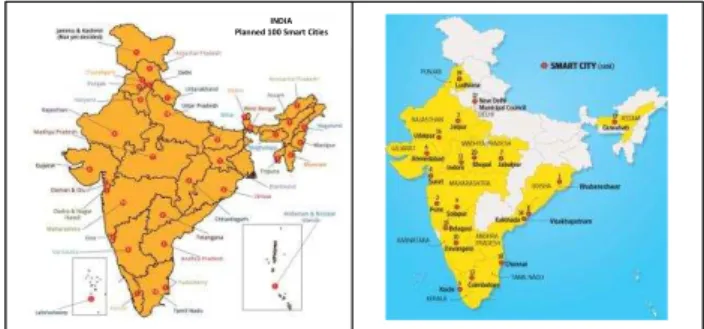
5.5 Geospatial Distribution of Planned Smart Cities
There is a visualization to set up 100 smart cities across the country, India. The 100 smart cities mission intends to promote adoption of smart solutions for efficient use of available assets, resources and infrastructure. Based on urban facts presented earlier, there is phenomenal increase in number and growth of towns and cities which are responsible to fast pace of urbanization. There are enormous potential for smart cities development in India. For instance, country wide achievable one goal is development of 100 smart cities. It is expected that “India’s urban population will reach 590 million by 2030, living in at least 60 cities with a population of more than one million, requiring huge investment by the government for their development” (MoUD, 2015).
Lakshadweep – Kavaratti; Madhya Pradesh – Bhopal, Indore, Jabalpur, Gwalior, Sagar, Satna, Ujjain; Maharashtra – Navi Mumbai, Nashik, Thane, Greater Mumbai, Amravati, Solapur, Nagpur, Kalyan-Dombivali, Aurangabad, Pune; Manipur – Imphal; Meghalaya – Shillong; Mizoram – Aizawl; Nagaland – Kohima; Odisha – Bhubaneshwar, Raurkela; Puducherry – Oulgaret; Punjab – Ludhiana, Jalandhar, Amritsar; Rajasthan – Jaipur, Udaipur, Kota, Ajmer; Sikkim – Namchi; Tamil Nadu – Tiruchirapalli, Tirunelveli, Dindigul, Thanjavur, Tiruppur, Salem, Vellore, Coimbatore, Madurai, Erode, Thoothukudi, Chennai; Telangana – Greater Hyderabad, Greater Warangal; Tripura – Agartala; Uttar Pradesh – Moradabad, Aligarh, Saharanpur, Bareilly, Jhansi, Kanpur, Allahabad, Lucknow, Varanasi, Agra, Rampur; Uttarakhand – Dehradun; West Bengal – New Town Kolkata, Bidhannagar, Durgapur, Haldia. All these above mentioned smart cities accounted for about 98 cities and the rest are as Jammu & Kashmir has asked for more time to decide potential smart city in the State. Whereas, around 12 cities have been shortlisted against 13 cities allocated to Uttar Pradesh State.
Figure 5a and 5b. Geospatial Distribution of Planned Smart Cities, India (5a); First 20 Smart Cities selected from 11 States
and UT for development in India (5b).
Moreover, there is also needs for finding new ways to manage complexity, increase efficiency, reduce expenses, and improve quality of life by developing more smart cities in India. In view of this, a decision have been taken for developing about 100 “Smart Cities” through the development of the satellite towns of larger cities and by modernizing the existing mid-sized cities in the country, India (MoUD, 2015) So, the key features of a smart city is the interconnection between the competitiveness and the capital and sustainability. The smart cities should be able to provide good infrastructure facilities as water, sanitation, reliable utility services and health care. However, at fundamental level smart cities need smart planning and smart governance along with sophisticated capacity planning process to directly impact livability (Arthur, 2005; Batty et al.; and E. P., 2014). While the increasing role of geospatial database and technologies available currently enhances the citizen experience, whether it is learning experience or shopping or healthcare or mobility. There is now much trendy in the application of geospatial enabling technologies in addressing fundamental issues like water, energy, sanitation, waste management and mobility particularly in Smart Cities in India. However, at fundamental level smart cities need smart planning and smart governance along with sophisticated capacity planning process to directly impact livability (MoUD, 2015). So, there are few sophisticated approaches which few countries have adopted as well as supported by advancement of geospatial data base and technologies in the world with special reference to the developing country, India. However, cities are emerging as the engines of national economy and generators of wealth. Cities are the centers of geospatial digital technology development, innovation, creativity and economic growth as well
as the hub for spread of digital knowledge and hope for migrants from rural areas for employment and better quality of life.
6. CONCLUSIONS AND SUGGESTIONS
It is important to mention that the significant feature of urbanization is the growth of large towns and metropolitan cities. Such growth of urban centers are the challenges of urbanization in India. For instance, in 1901 only the Calcutta City had more than one lakh population. Later on, such cities number increased over the periods and there are about 12 cities in 1981, which almost doubled to about 23 in 1991. Moreover, their number increased to about 35 in 2001 and to about 53 in 2011. So, the urban population projections indicate that by 2030, the urban population will be about 575 million constituting over 40 per cent of total population in India. So, Cities act as beacons for the rural population as they represent a higher standard of living and offer opportunities to people not available in rural areas. The Cities have, in effect become an indicator of humankind’s progress into the 21st century, whether this is an upward trend or downward.
So, the concentration of people and their engagement in many activities as the economic, social, political and administrative are components of a nation or region in cities which have made them as a magnet for rich as well as poor households settling down in the formal and informal settlements in cities. So, there is need that such challenges are to be efficiently tackled under the various development plans and policies for the sustainable urban life style in the country, India. And, also it is a fact that the phenomenal increasing pace of urbanization is inevitable and needs to be considered as positive for the all-round national development.
The Smart cities takes into account different facets like the smart design, smart utilities, smart housing, smart mobility, smart technology etc. So, it is challenging to define features of smart cities. Typically, a large number of people migrate to cities mainly in pursuit of employment and economic activities along with better quality of life. By virtue of this, Smart City for its sustainability requires to offer economic and employment opportunities to large section of its population, regardless of their level of education, skills or income levels, at large. Subsequently, Smart City requirements are to identify unique advantage in specific areas of economic development and elongate them aggressively by developing compulsory institutional, physical, social and economic infrastructures etc. by attracting investors and professionals for betterment of urban population and society. So, as a result there have been an increasing research interest which is being directed to the mapping, monitoring and developing of the smart cities based on geospatial information and geospatial technologies. However, the present research has made an attempt to help the local, regional and state level planners and policy makers to better understand and address the issues attributed to the developing of smart cities in the emerging and developing country, India.
7. REFERENCES
Aggarwal, S.K., 2007. Urbanisation, Urban Development and Metropolitan Cities in India. New Delhi, Concept Publishing Company.
Arthur B. Gallion and Simon Eisner, 2005. The Urban Pattern: City Planning and Design. New Delhi, CBS Publishers & Distributors Pvt. Ltd.
Batty, M. et al., 2001. Visualizing the City: Communicating Urban Design to Planners and Decision-Makers. Planning INDIA
Support Systems, R. Brail and R. Klosterman, eds., Environmental Systems Research Institute (ESRI) Press and Center for Urban Policy Research, Rutgers University.
Bhattacharya, B., 2006. Urban Development in India. New Delhi, Concept Publishing Company, IInd Edition.
Breese, G. (eds.), 1969. The City in Newly Developing Countries: Readings on Urbanism and Urbanization. Prentice Hall, pp. 507-534.
Carter, Harold, 2010. The Study of Urban Geography. London, Arnold.
Chang, Kang-tsung, 2008. Introduction to Geographic Information System. New Delhi, Tata McGraw-Hill Publishing Company Ltd., Fourth Edition.
CoI (2011) Census of India 2011, Primary Census Abstract, Office of the Registrar General & Census Commissioner, Ministry of Home Affairs, Government of India, New Delhi.
CoI, 2011. Census of India 2011, Administrative Atlas of India. New Delhi, Census of India, Office of the Registrar General & Census Commissioner, India Ministry of Home Affairs, Government of India.
E. P., 2014. Mapping Smart Cities in the European Union. Brussels (UK), European Parliament, Directorate General for Internal Policies, Policy Department A: Economic and Scientific Policy.
Fan, H. C. and L. Q. Meng, 2012. A three-step approach of simplifying 3D buildings modeled by CityGML. International Journal of Geographical Information Science, 26, pp. 1091-1107.
Fraser, C. S., E. Baltsavias, and A. Gruen, 2002. Processing of IKONOS Imagery for Submetre 3D-Positioning and Building Extraction, ISPRS Journal of Photogrammetry & Remote Sensing, 56, pp. 177-194.
Gruen A, Xinhua Wang, 1999. Cyber City Modeler, A Tool for Interactive 3-D City Model Generation. German Photogrammetry Week, Stuttgart, Germany.
Jensen, J.R., 2009. Remote Sensing of the Environment: An Earth Resource Perspective. Delhi, Dorling Kindersley (India) Pvt. Ltd., Perason Eduction, Inc. IInd Ed.
Knox, Paul, 1994. Urbanisation: An Introduction to Urban Geography. New Delhi, Prentice-Hall of India Ltd.
Mao, B., Y. F. Ban and L. Harrie, 2011. A Multiple Representation Data Structure for Dynamic Visualisation of Generalised 3D City Models. ISPRS Journal of Photogrammetry and Remote Sensing, 66, pp. 198-208.
Michael Spence, Patricia Clarke Annex and Robert M. Buckley et. al., 2010. Urbanisation and Growth. New Delhi, Rawat Publications.
MoUD, 2015. Smart Cities: Mission Statement and Guidelines. New Delhi, Ministry of Urban Development, Government of India, pp. 23-24.
Pacione, Michael, 2009. Urban Geography: A Global Perspective. London & New York, Routledge (Taylor & Francis Group).
Peter J. Taylor, Ben Derudder, Pieter Saey and Frank Witlox, 2013. Cities in Globalization: Practices, Policies and Theories. London & New York, Routledge Taylor & Francis Group.
Rain, D., 2007. Towards Settlement Science: A Research Agenda for Urban Geography. Geography Journal, 69, pp. 1-8.
Smith, Wallance, 1975. Urban Development: The Process and the Problems. Berkeley, University of California Press.
Thomas, K., Manfred L. and Peter Reintarz, 2008. Generation of Coarse 3-D Models of Urban Areas from High Resolution Stereo Satellite Images. International Archives of the Photogrammetry, Remote Sensing and Spatial Information Sciences, Vol. XXXVII, part B1, pp. 1091-1098.
UN-HABITAT, 2004. Urban Land for All, United Nations Human Settlements Program (UN-HABITAT). Nairobi, Kenya.
United Nations, 2006. World Urbanization Prospects: The 2005 Revision, United Nations Department of Economic and Social Affairs, Population Division (2006), Working Paper No. ESA/P/WP/200.
United Nations, 2014. Millennium Development Goals Report 2014. New York, United Nations.
UNPD, 2009. World Urbanization Prospects. New York United Nations Population Division, United Nations, Department of Economic and Social Affairs.
World, Bank, 2002. World Banks Statistics (World Development Indicators). The World Bank, Washington, DC.
World Wide Web Resources:
http://www.censusindia.gov.in/
http://planningcommission.nic.in/
http://censusindia.net/
http://www.smartcitiesindia.com/ http://moud.gov.in/