ECOLOGY, BEHAVIOR AND BIONOMICS
Castes and Asynchronous Colony Cycle in
Polybia bistriata
(Fabricius)
(Hymenoptera: Vespidae)
O
TAVIOA.L.
DEO
LIVEIRA1, F
ERNANDOB. N
OLL1, S
IDNEIM
ATEUS2 ANDB
RUNOG
OMES11Depto.Zoologia e Botânica, Instituto de Biociências, Letras e Ciências Exatas, UNESP, Rua Cristóvão Colombo, 2265 15054-000, São José do Rio Preto, SP, covy_nada@yahoo.com.br, noll@dzb.ibilce.unesp.br
biologia_unesp@yahoo.com.br
2Depto. Biologia, Fac. Ciências e Letras de Ribeirão Preto, USP, Av. Bandeirantes 3900, 140140-901 Ribeirão Preto, SP, sidmateu@usp.br
Neotropical Entomology 36(6):817-827 (2007)
Castas e Assincronismo no Ciclo Colonial de Polybia bistriata (Fabricius) (Hymenoptera: Vespidae)
RESUMO - Os Epiponini, vespas sociais neotropicais, são um grupo de insetos sociais com sociedades poligínicas, construtoras de ninhos complexos. O dimorfi smo das castas varia de incipiente até altamente distinto. Análises morfométricas de nove partes corporais, estágio de desenvolvimento ovariano, idade relativa e desenvolvimento da glândula do quinto esternito do gáster (glândula de Richards) de Polybia bistriata (Fabricius) foram utilizados para calcular o nível de diferenciação das castas de nove colônias. Dados morfológicos e fi siológicos foram usados em análises multivariadas para avaliar o nível de discriminação entre fêmeas inseminadas e não-inseminadas. Foram encontradas diferenças fi siológicas claras: rainhas tinham ovários altamente desenvolvidos e inseminados, e as operárias não estavam inseminadas e tinham ovários não desenvolvidos ou uns poucos oócitos desenvolvidos (em duas colônias). ANOVA e análise da função discriminante detectaram diferenças signifi cantes entre as castas. Considerou-se, pelos dados obtidos, que as colônias estavam nas seguintes fases em relação ao ciclo colonial: uma em pré-emergência, quatro em produção de operárias ;.e quatro em produção de sexuados. Análises das glândulas de Richards indicaram o seu menor desenvolvimento em rainhas de colônias pequenas (< 100 fêmeas) do que aquelas de colônias médias (100-200 fêmeas), e grandes (> 200 fêmeas). Considerando-se todos os dados, é possível concluir que as diferenças entre as castas são pequenas, mas evidentes em algumas fases do ciclo colonial, um fenômeno previamente descrito para outros epiponíneos.
PALAVRAS- CHAVE: Inseto social, diferenciação de castas, vespa social, morfometria
ABSTRACT - Neotropical swarm-founding wasps, the Epiponini, are an outstanding group of social insects whose societies are polygynic and complex nest builders. Caste dimorphism in these wasps ranges from incipient to highly distinct. Morphometric analyses of nine body parts, ovarian status, relative age and development of the 5th gastral sternite gland (Richards´ gland) of Polybia bistriata
Fabricius were undertaken in order to estimate caste differentiation in nine colonies. Morphological and physiological data were used in multivariate analyses in order to evaluate the level of discrimination between inseminated and non-inseminated females. Clear physiological differences were found: queens had highly developed ovaries and they were inseminated, and workers had totally undeveloped ovaries or they had few developed oocytes (only in two colonies), but in both cases insemination was not detected. ANOVA and discriminant function analysis detected slight, but signifi cant differences between castes. In relation to colony cycle, colonies were considered to be in the following stages: one in pre-emergence, four in worker production and four in sexuals production. Richards´ gland analyses indicated that in small colonies (<100 females) queens had a less developed gland than in medium (100-200 females), and large colonies (>200 females). Taking the whole data, it was possible to conclude that caste differences were slight, but more evident in some phases of the colony cycle, a phenomenon previously described for other epiponines.
Caste differentiation in insects is a crucial feature in evaluating the evolution of sociality (Wilson 1971): the differences between queen and worker result from nutritional dissimilarities during larval development, resulting in pre-imaginal caste determination (Wilson 1971, O’Donnell 1998, Keeping 2002). On such aspects, wasps seem to be very important for understanding social insect evolution (Jeanne 1980, O’Donnell 1998). Differentiation patterns among females in social wasps are highly variable. Female dimorphism in Vespidae is absent in the Stenogastrinae – females rarely behave specifi cally as queens or workers (Turillazzi 1991); in the Vespinae queens are larger than workers (Spradbery 1991); in Polistinae, there is an intermediary condition between queens and workers (Carpenter 1982). The most basal groups, Polistes and Mischocyttarus, present solitary nest foundation. However, Polybioides, some Ropalidia and all of the 22 genera of Epiponini are swarm founders: usually there are several inseminated queens, accompanied by numerous workers, moving massively to begin a new colony (Jeanne 1991).
In Polistinae, Epiponini (Carpenter 1997) instigates great interest because castes are quite complex (reviewed in Noll et al. 2004). Several taxa present the usual pre-imaginal pattern of caste determination, while several other taxa give clear indication that post-imaginal castes are widely distributed in epiponines (Mateus et al. 2004). Recently, Noll and Zucchi (2002) recognized fi ve forms of caste differentiation due to the infl uence of the colonial cycle in the Epiponini: 1) Morphological differences between queens and workers absent during the whole colonial cycle, associated with ovarian activation in unmated females (intermediates); 2) Absence of pronounced morphological differences in queens and workers during the whole colonial cycle, but with clear physiological distinction; 3) Morphological discontinuities among castes are subject to variations during colony cycle. In early stages of the cycle, queens possess a variable size and later queens tend to be monomorphic, usually the largest individuals (Noll & Zucchi 2000). In this case, ovarian activation in intermediates occurs during the whole colony cycle; 4) Similar to 3, but intermediates appear only in some phases of the colonial cycle; 5). Morphological differences among castes are evident during the whole colonial cycle and queens are always different from the workers. Except in queens, no ovarian development in other females is found.
Polybia is a very large genus, comprising several subgenera: Apopolybia, Cyllindroeca, Formicicola, Furnariana, Hypopolybia, Myraptera, Pedothoeca, Platypolybia, Polybia and Trichothorax. Carpenter et al. (2000) included Synoecoides as a subgenus. Myrapetra is certainly the most studied subgenus, especially because most studies so far have been done in a single species, Polybia occidentalis Oliver(London & Jeanne 2003, Hunt et al. 1987, Jeanne 1986). However, even for this subgenus, P. occidentalis cannot be considered a species-model, because colony size and nest architecture are highly variable. In a general way, Myrapetra presents colonies with more than 100 individuals, easily overcoming thousands (Richards 1978; Noll & Zucchi 2000, 2002). Different from the cases above mentioned, Polybia bistriata Fabricius presents colonies with size inferior to some dozens of females (Jeanne 1991).
According to Richards (1978), nests are small, elliptic, with one comb, and fastened on the internal side of leaves. Cells usually contain some nectar and pockets in the envelope contain some winged ants. Differences among the queens and workers are very slight, based on the hamulli number (Richards & Richards 1951). Altogether, data on its biology is scarce, besides the remarkable abundance of P. bistriata in the Amazon area (J. M. Carpenter, personal information). This works intends to investigate some biological aspects of P. bistriata, especially thoserelated to caste differences.
Material and Methods
For this study, nine colonies of P. bistriata were used. They were collected in the municipal district of Presidente Figueiredo – Amazonas State (01°49’596´´ S 060° 12 ‘ 078´´ W), in July of 2004 by Fernando B. Noll and Sidnei Mateus. Nests were collected using plastic sacks with paper-towel soaked in ether. All adult wasps from each colony were preserved in 96% ethanol immediately after collection. Caste was determined by examination of the ovaries and insemination. Groups for analysis were defi ned based on ovarian development and insemination. Queens were defi ned as inseminated females (bearing sperm in the spermatheca) and with developed ovaries; intermediates as unmated females with some level of ovarian development, and workers as females without ovarian development. However, it is important to point out that the defi nition of these groups is not an indication of castes or sub-castes. In order to analyze insemination, the spermatheca was removed and put on a slide bearing a drop of acid fuchsine solution (1:1). The presence of sperm cells was detected under a microscope.
In order to estimate the relative age of adult wasps by noting the progressive pigmentation of the transverse apodeme across the hidden base of each sternum, all individuals of each colony were analyzed under a stereomicroscope. Following Richards (1971) and West-Eberhard (1973), females were classified as: without pigmentation, light brown, dark brown and black. The 5th sternite, removed for the relative
age analysis, was examined in order to detect differences in Richards´ gland. Sternites were photographed with the help of a program of image capture coupled to a binocular stereomicroscope and separated according to coloration into four groups of glandular development: not developed, slightly developed, medium development and maximum development.
All individuals with any level of ovary development and fi fty workers randomly chosen from each colony were used for morphometric analysis. Measurements were taken from eight morphometric variables in each female: HW, head width; PML, minimum interorbital distance; MSW, mesoscutellar width; AL, alitrunk length; T1BH, basal width tergum I; T2BW, basal width tergum II; T1L, maximum width tergum I; WL, partial length of forewing (Fig. 1). Measurements were taken using a stereomicroscope equipped with a video camera linked to a computer.
the most signifi cant contributions for caste distinction. Later, the most discriminant characters were plotted for caste discrimination. Wilks’ Lambda values were used to infer the individual contribution of each variable to the model. The Wilks’ lambda statistic for the overall discrimination is computed as the ratio of [the determinant of the within-groups variance / covariance matrix] to [the determinant of the total variance / covariance matrix]. When this value is close to 1.0, then the residual is high and the variable is not a good discriminator, while a value closer to 0 means that the residual is low and the variable is a good discriminator. In order to check the effi ciency of the test, a classifi cation matrix test was used to check the number and percent of correctly classifi ed cases in each group. This test compares the actual data with predicted results based on the discrimination model.
Results
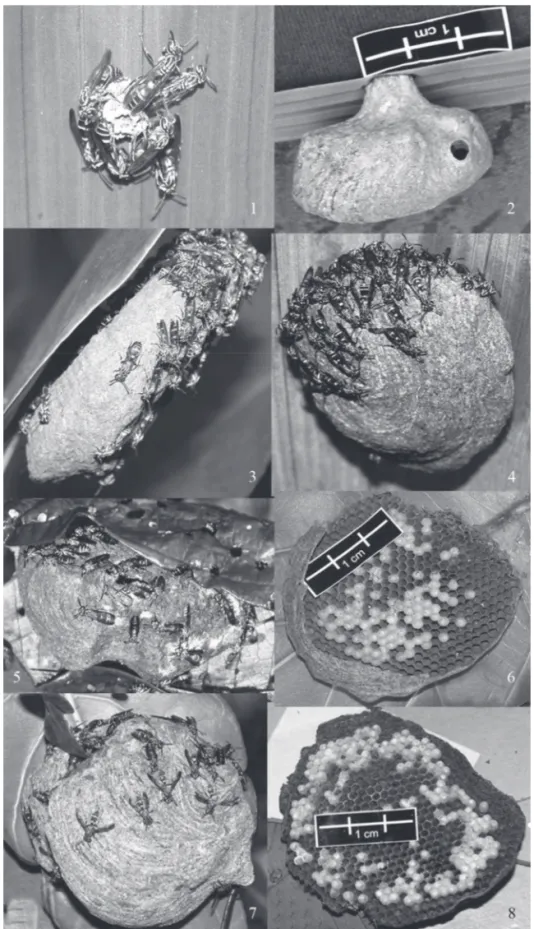
Nest architecture, colony composition, relative age and colony phase. Nests were found exclusively in trees (especially below tree leaves from different species, usually bearing a central structure similar to a peduncle – Fig. 2), even though several buildings were searched at the time these nests were found, once it is usual to fi nd Polybia Myrapetra nest on buildings (FBN, personal information). Brood and meconia were found in all colonies, except in colony 1. The envelope was light brown with many brown and dark gray striated spots (Fig. 2). Entrance was always in the lateral side of the
nest. Nest shape varied from elliptic to round. Carton was composed of short dark chips. All colonies had a single stout stalk and more than one comb was found in some colonies. Secondary combs were sessile upon primary envelope and nests had single entrances. The adult population for each colony was estimated as follows: colony 1: 5 females; colony 2: 29 females; colony 3: 37 females; colony 4: 51 females; colony 5: 119 females and 22 males; colony 6: 148 females; colony 7: 157 females and 45 males; colony 8: 205 females; colony 9: 292 females.
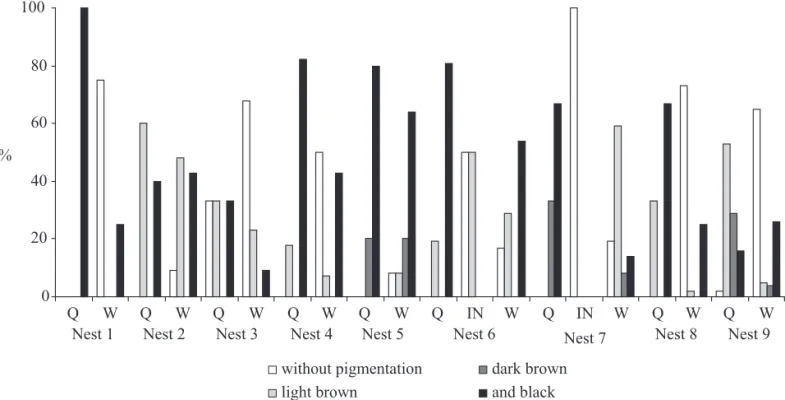
Based on the parameters established for identifi cation of phases of the colonial cycle (Mateus et al. 2004), colonies of P. bistriata met in the following phases: pre-emergence of workers: colony 1; workers’ production: colonies 2, 4, 8 and 9; gynes’ production: colonies 3, 5, 6 and 7. In the pre-emergence colony (colony 1), most queens were old and most workers were young; in worker-producing colonies, both queens and workers had females bearing all ages; in gyne-producing colonies, most queens were old. Also, in colonies 6 and 7, intermediates were found; in colony 3, young queens were also found and in colonies 5 and 7, males were found.
Ovarian development and insemination. Three types of ovarian development were observed in the analyzed colonies, to know: type A – from non defi ned oocytes to very small, slightly defi ned oocytes; type B – from small oocytes, and reduced in length to oocytes larger in length; and type C – with complete developed oocytes, from reduced in length,
Fig. 1. Representative measures for morphometric analyses of this paper: PML, minimum interorbital distance; HW, head width; MSW, mesoscutellar width; AL, alitrunk length; T1BH, basal width tergum I; T2BW, basal width tergum II; T1L, maximum width tergum I; WL, partial length of forewing.
HW
PML
WL
T2BW MSW
with a pair of mature oocytes at the base of the ovary to long and with six or more oocytes at the base of the ovary. Females classifi ed as workers presented ovaries type A, intermediates presented type B, and as queens, type C. In all the colonies,
only queens were inseminated, except for two colonies: in colonies 1 and 4 one queen was not inseminated in each colony and, in colony 4, six females with worker-like ovaries were inseminated.
Richards’ gland. In the analyzed colonies, a different level of development was found among queens: in small colonies (<100 females: colonies 1, 2, 3 and 4), queens presented a smaller development of the gland, not, slightly and medium development, not reaching maximum development. In medium colonies (between 100 and 200 individuals: colonies 5, 6 and 7) and large colonies (>200 individuals, colonies 8 and 9), queens showed developed glands, among slightly to maximum development, with larger amount in medium development. Intermediate females never reached the maximum development. (Table 1, Fig. 3).
Morphometric analyses. After ANOVA, differences
between castes were variable among the eight analyzed characters. As shown in Table 2, no differences were found in colonies 3 and 5, one signifi cant character in colonies 2 and 4, two in colony 8, and all measures in colony 9. In colonies with ovarian-developed, unmated females, no differences were found in colony 7, six signifi cant measures were found in colony 6, where queens were smaller than workers and ovarian-developed, unmated females.
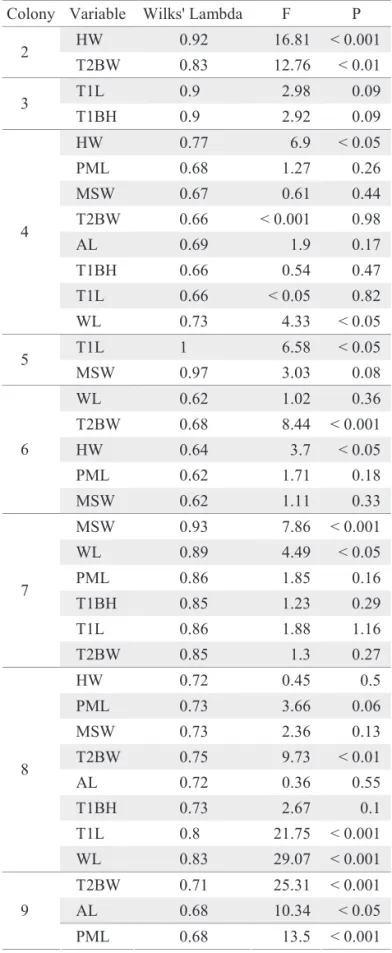
Based on discriminant analyses, the discrimination model was shown unable to separate castes based on only one or a few measurements. Wilks’ lambda (Table 3) varied between 0.6 and 0.9, with smaller values presented by colony 6 and the largest ones by colonies 3 and 5. Castes seem
Table 1. Colony classifi cation based on size; colony cycle stage and number of males and females.
Colony Colony size Colony cycle stage Female Male
1 Small (< 100 individuals) Pre-emergence of workers 5 — 2 Small (< 100 individuals) Workers’ production 29 — 3 Small (< 100 individuals) Gynes’ production 37 — 4 Small (< 100 individuals) Workers’ production 51 — 5 Medium (between 100 and 200 individuals) Gynes’ production 119 22 6 Medium (between 100 and 200 individuals) Gynes’ production 148 — 7 Medium (between 100 and 200 individuals) Gynes’ production 157 45 8 Large (> 200 individuals) Workers’ production 205 — 9 Large (> 200 individuals) Workers’ production 292 —
0 20 40 60 80 100
Q Nest 1
Q Nest 2
Q Nest 3
Q Nest 4
Q Nest 5
Q Nest 6
W IN Q
Nest 8 Q
Nest 9 %
not developed slightly developed
medium development maximum development W
W W W W IN Q W W W
Nest 7
Fig. 3. Development of Richards’ gland in queens (Q), workers (W), and intermediates (IN) in the nine studied colonies of
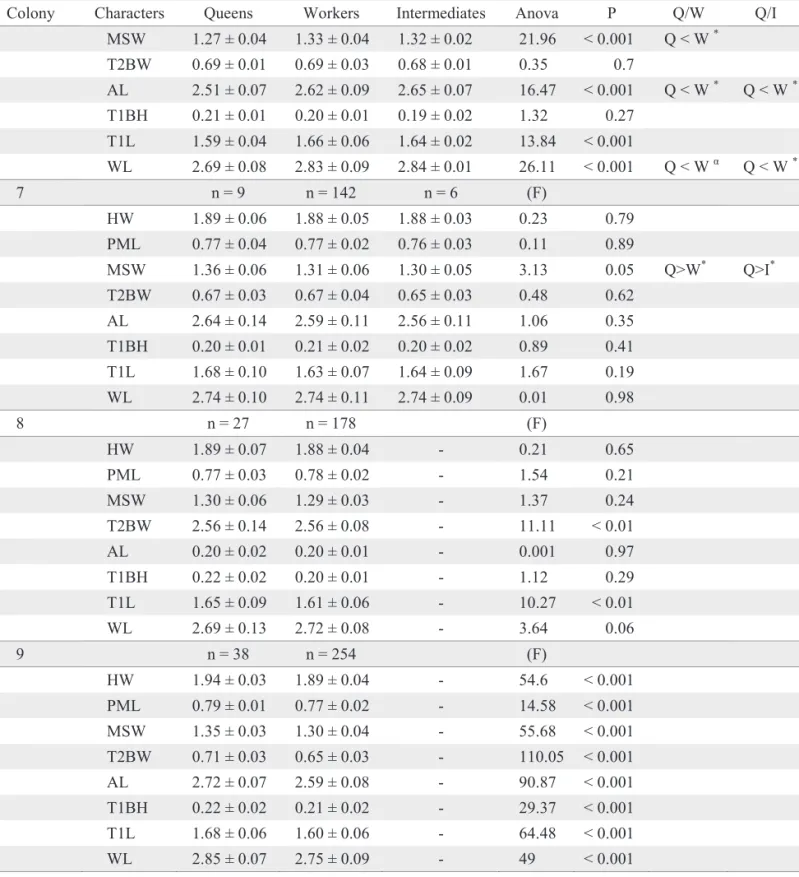
Table 2. Means in millimeters (± SD) and observed values of ANOVA test, for eight characters used for discriminating castes of colonies of P. bistriata (Q = queen, W = worker and I = intermediate).
Continue
Colony Characters Queens Workers Intermediates Anova P Q/W Q/I
2 n = 5 n = 24 (F)
HW 1.93 ± 0.02 1.86 ± 0.05 - 4.86 < 0.05 PML 0.78 ± 0 0.77 ± 0.03 - 0.37 0.55 MSW 1.29 ± 0.04 1.27 ± 0.07 - 0.27 0.61 T2BW 0.65 ± 0.02 0.67 ± 0.04 - 2.96 0.1 AL 2.66 ± 0.10 2.54 ± 0.14 - 3.25 0.08 T1BH 0.22 ± 0.01 0.22 ± 0.02 - 0.002 0.96 T1L 1.60 ± 0.05 1.58 ± 0.08 - 0.17 0.68 WL 2.75 ± 0.06 2.68 ± 0.16 - 0.63 0.43
3 n = 3 n = 34 (F)
HW 1.97 ± 0.02 1.94 ± 0.04 - 2.6 0.11 PML 0.80 ± 0.01 0.79 ± 0.02 - 0.005 0.94 MSW 1.31 ± 0.04 1.29 ± 0.04 - 0.73 0.4 T2BW 0.69 ± 0.02 0.67 ± 0.03 - 2.41 0.13 AL 2.69 ± 0.04 2.65 ± 0.06 - 1.04 0.31 T1BH 0.24 ± 0.04 0.22 ± 0.01 - 3.79 0.06 T1L 1.70 ± 0.02 1.64 ± 0.05 - 3.86 0.06 WL 2.80 ± 0.03 2.76 ± 0.07 - 0.94 0.34
4 n = 11 n = 40 (F)
HW 1.97 ± 0.04 1.90 ± 0.06 - 9.59 < 0.01 PML 0.77 ± 0.02 0.76 ± 0.03 - 2.76 0.1 MSW 1.34 ± 0.02 1.30 ± 0.06 - 3.04 0.09 T2BW 0.66 ± 0.02 0.64 ± 0.04 - 1.23 0.27 AL 2.63 ± 0.08 2.55 ± 0.13 - 4.29 0.04 T1BH 0.22 ± 0.01 0.21 ± 0.02 - 2.48 0.12 T1L 1.64 ± 0.05 1.58 ± 0.10 - 3.63 0.06 WL 2.71 ± 0.08 2.70 ± 0.13 - 0.19 0.66
5 n = 09 n = 110 (F)
HW 1.94 ± 0.06 1.93 ± 0.05 - 0.34 0.54 PML 0.81 ± 0.02 0.80 ± 0.03 - 0.61 0.43 MSW 1.35 ± 0.08 1.35 ± 0.06 - 0.1 0.75 T2BW 0.69 ± 0.03 0.68 ± 0.03 - 0.76 0.38 AL 2.69 ± 0.11 2.66 ± 0.11 - 0.34 0.56 T1BH 0.23 ± 0.02 0.22 ± 0.02 - 2.57 0.11 T1L 1.67 ± 0.09 1.63 ± 0.07 - 3.6 0.06 WL 2.84 ± 0.11 2.82 ± 0.12 - 0.19 0.66
6 n = 26 n = 120 n = 2 (F)
morphologically ill-separated, once the classifi cation matrix obtained after discrimination analysis restored only the group “workers”, with queens group hardly reaching 60% of correct classifi cation in some colonies (Table 4).
Discussion
In P. bistriata, the colony cycle is asynchronous, once the analyzed colonies in this work were clearly in different
(* P < 0.05) (αP < 0.01) (βP < 0.002) HW, head width; PML, minimum interorbital distance; MSW, mesoscutellar width; AL,
alitrunk length; T1BH, basal width tergum I; T2BW, basal width tergum II; T1L, maximum width tergum I; WL, partial length of forewing
Table 2. Continuation.
Colony Characters Queens Workers Intermediates Anova P Q/W Q/I MSW 1.27 ± 0.04 1.33 ± 0.04 1.32 ± 0.02 21.96 < 0.001 Q < W *
T2BW 0.69 ± 0.01 0.69 ± 0.03 0.68 ± 0.01 0.35 0.7
AL 2.51 ± 0.07 2.62 ± 0.09 2.65 ± 0.07 16.47 < 0.001 Q < W * Q < W * T1BH 0.21 ± 0.01 0.20 ± 0.01 0.19 ± 0.02 1.32 0.27
T1L 1.59 ± 0.04 1.66 ± 0.06 1.64 ± 0.02 13.84 < 0.001
WL 2.69 ± 0.08 2.83 ± 0.09 2.84 ± 0.01 26.11 < 0.001 Q < W α Q < W *
7 n = 9 n = 142 n = 6 (F)
HW 1.89 ± 0.06 1.88 ± 0.05 1.88 ± 0.03 0.23 0.79 PML 0.77 ± 0.04 0.77 ± 0.02 0.76 ± 0.03 0.11 0.89
MSW 1.36 ± 0.06 1.31 ± 0.06 1.30 ± 0.05 3.13 0.05 Q>W* Q>I* T2BW 0.67 ± 0.03 0.67 ± 0.04 0.65 ± 0.03 0.48 0.62
AL 2.64 ± 0.14 2.59 ± 0.11 2.56 ± 0.11 1.06 0.35 T1BH 0.20 ± 0.01 0.21 ± 0.02 0.20 ± 0.02 0.89 0.41 T1L 1.68 ± 0.10 1.63 ± 0.07 1.64 ± 0.09 1.67 0.19 WL 2.74 ± 0.10 2.74 ± 0.11 2.74 ± 0.09 0.01 0.98
8 n = 27 n = 178 (F)
HW 1.89 ± 0.07 1.88 ± 0.04 - 0.21 0.65 PML 0.77 ± 0.03 0.78 ± 0.02 - 1.54 0.21 MSW 1.30 ± 0.06 1.29 ± 0.03 - 1.37 0.24 T2BW 2.56 ± 0.14 2.56 ± 0.08 - 11.11 < 0.01 AL 0.20 ± 0.02 0.20 ± 0.01 - 0.001 0.97 T1BH 0.22 ± 0.02 0.20 ± 0.01 - 1.12 0.29 T1L 1.65 ± 0.09 1.61 ± 0.06 - 10.27 < 0.01 WL 2.69 ± 0.13 2.72 ± 0.08 - 3.64 0.06
9 n = 38 n = 254 (F)
stages of the cycle, even though they were collected in the same period of time. Non-synchronicity is characteristic of epiponines, apparently as a consequence of a less harsh climate found in the tropics (Jeanne 1991). Other interesting aspect is that queen number decrease as the colonies go to later cycle stages, i.e., later stages present fewer queens than colonies in earlier stages. As a consequence, colonies in later stages present mostly older queens. In this way, the presence of young queens in older colonies serves as an indication of gyne production, as seen in the observed colonies. There are also caste differences among the colonies in relation to the cycle, with later staged colonies bearing larger females than earlier staged colonies. The only exception was found in the pre-emergence colony, which had a single queen. This fi nding may suggest that swarms may occasionally start monogynically and later go to polygyny.
Based on the available information, it is possible to infer the following events for each colony (Fig. 4): the colony 2 were in workers’ production, having probably already gone by a renewal of the queens, because it had less old queens and more ovarian-developed, unmated females, the same happening with the workers; colonies 4 and 8, also in workers’ production, they possessed old and intermediary aged queens, even so with a larger number of older queens, and young workers, indicating colony maturing; colonies 6 and 7, in production of queens, were replacing queens, for they possess young females with intermediary ovarian development, and old queens. The colony 6 possessed queens with intermediary age, and females with intermediary ovarian development, with intermediary age. It is suggested that those intermediary females suffer an increase in the ovarian development, being able to become queens; the colony 3 would have produced new queens, however they were not identifi ed females with intermediary ovarian development. That fact can suggest that ovarian-developed, unmated females in P. bistriata are, actually, potential queens, and that the phase in that the colony 3 met was already late in the process of new queens’ emergence. Consequently, ovarian-developed, unmated females would have already been inseminated; the colony 9 was classifi ed as in workers’ production, where the queens are in development phase and producing new individuals in the colony; the colony 5 was classifi ed as in production of males, together with the colony 7, this even so tends much less males than the colony 5.
Richards’ gland was larger in workers than in queens. It would be expected, because in the swarming process, workers select the place for the new nest, and conduct the colony by means of a pheromonal trail, with scout workers moving between the new and the old nests, scrubbing the
HW, head width; PML, minimum interorbital distance; MSW, mesoscutellar width; AL, alitrunk length; T1BH, basal width tergum I; T2BW, basal width tergum II; T1L, maximum width tergum I; WL, partial length of forewing
Table 3. Wilks’ Lambda and F-Statistics. Lambda values estimate the degree of contribution for each separate measure to the fi nal discriminant function model. In these cases values were between 1.0 and about 0.5, indicating low discrimination of castes. F-statistics for ANOVA using the same variables are shown, with appropriate signifi cance values.
Continue
Colony Variable Wilks' Lambda F P HW 0.92 16.81 < 0.001 2
T2BW 0.83 12.76 < 0.01 T1L 0.9 2.98 0.09 3
T1BH 0.9 2.92 0.09
HW 0.77 6.9 < 0.05
PML 0.68 1.27 0.26
MSW 0.67 0.61 0.44 T2BW 0.66 < 0.001 0.98 AL 0.69 1.9 0.17
T1BH 0.66 0.54 0.47
T1L 0.66 < 0.05 0.82 4
WL 0.73 4.33 < 0.05 T1L 1 6.58 < 0.05
5
MSW 0.97 3.03 0.08
WL 0.62 1.02 0.36 T2BW 0.68 8.44 < 0.001 HW 0.64 3.7 < 0.05
PML 0.62 1.71 0.18
6
MSW 0.62 1.11 0.33
MSW 0.93 7.86 < 0.001 WL 0.89 4.49 < 0.05
PML 0.86 1.85 0.16
T1BH 0.85 1.23 0.29
T1L 0.86 1.88 1.16
7
T2BW 0.85 1.3 0.27
HW 0.72 0.45 0.5
PML 0.73 3.66 0.06
MSW 0.73 2.36 0.13
T2BW 0.75 9.73 < 0.01
AL 0.72 0.36 0.55
T1BH 0.73 2.67 0.1
T1L 0.8 21.75 < 0.001 8
WL 0.83 29.07 < 0.001 T2BW 0.71 25.31 < 0.001 AL 0.68 10.34 < 0.05 9
PML 0.68 13.5 < 0.001
Table 3. Continuation.
Colony Variable Wilks' Lambda F P T1L 0.66 3.6 0.06 9
abdominal gland on the leaves and the wasps follow that scent trail (Forsyth 1981, Jeanne 1981). However, an interesting fi nding was that smaller colonies or at beginning of worker production present queens with less glandular development than queens from larger colonies (Table 1 and Fig. 5). The signifi cance of such fact is unknown, but because queens never perform any activity related to the swarming process, the development of such gland according to the size of the colony may be related somehow to the events of queen selection in older colonies (West-Eberhard 1978).
In the studied colonies, queens were slightly larger than workers, except in colony 6, which could be explained by a possible lack of nutrients in the phase of queen production. Even so, any of the individual measures has support to discriminate castes, since Wilks’ Lambda values were very close to 1.0. Ovarian development was also unable to clearly
separate castes, once inseminated worker-like females were found yet, it is possible to suggest that caste differentiation in P. bistriata is allometric based on size, similar to other previously found epiponines (Noll et al. 2004). In addition, the lesser the number of queens the larger the differences between castes (Fig. 3), which suggests a pattern of selection of queens for the size already found in some Polybia (Noll & Zucchi 2000).
Acknowledgments
The authors acknowledge the financial support by FAPESP (grants 01/02491-4, 04/14646-0 and 05/03569-8) and CNPq (grants 300312/2004-0 and 479790/2004-3). Specimes were collected under permits from IBAMA (187/2005 - CGFAV/LIC).
Table 4. Classifi cation scores for group comparisons using discriminant analysis.
Predicted classification Colony Observed
classification Worker Queen Intermediate % correct P = 0.82 P = 0.17
Worker 21 2 91.3 2
Queen 2 3 60
P = 0.91 P = 0.08
Worker 34 0 100
3
Queen 2 1 33.3
P = 0.78 P = 0.21
Worker 37 3 92.5 4
Queen 6 5 45.4
P = 0.91 P = 0.08
Worker 110 0 100
5
Queen 9 0 0
P = 0.81 P = 0.17 P = 0.01
Worker 115 5 0 95.8
Intermediate 2 0 0 0
6
Queen 12 14 0 53.8
P = 0.90 P = 0.05 P = 0.03
Worker 140 2 0 98.6
Intermediate 6 0 0 0
7
Queen 8 1 0 11.1
P = 0.86 P = 0.13
Worker 174 3 98.3 8
Queen 16 11 40.7
P = 0.86 P = 0.13
Worker 247 7 97.2
9
References
Carpenter, J.M. 1982. Vespoidea, Masaridae, Eumenidae, Vespidae, p.676-677. In S. Parker (ed.), Taxonomy and classifi cation of living organisms. McGraw-Hill Co., New York, 843p.
Carpenter, J.M. 1997. A note on the names of paper wasp tribes (Insecta: Hymenoptera: Vespidae). Ibaraki Univ. Nat. Hist. Bull. 1: 15-16.
Carpenter, J.M., J.I. Kojima & J.W. Wenzel. 2000. Polybia, paraphyly, and polistine phylogeny. Am. Mus. Novit. 3298: 24.
Fig. 5. Increase of Richards’ gland development in queens (Q) according to colony size increase in the studied colonies of P. bistriata.
Fig. 4. Relative age for queens (Q), workers (W), and intermediates (IN) in the nine studied colonies of P. bistriata, based of the progressive pigmentation of the transverse apodeme across the hidden base of each sternum, classifi ed in without pigmentation, light brown, dark brown and black.
0 20 40 60 80 100
Q Nest 1
Q Nest 2
Q Nest 3
Q Nest 4
Q Nest 5
Q Nest 6
W IN Q
Nest 8 Q
Nest 9 %
without pigmentation light brown
dark brown and black
W W W W W IN Q W W W
Nest 7
0 20 40 60 80 100
Q Nest 1
Small Q Nest 2
Q Nest 3
Q Nest 4
Q Nest 5 Medium
Q Nest 6
Q Nest 7
Q Nest 8
Large Q Nest 9 %
not developed slightly developed
Forsyth, A. 1981. Swarming activity of Polybiine social wasps (Hymenoptera, Vespidae, Polybiini) Biotropica 13: 93-99.
Hunt, J.H., R.L. Jeanne, L. Baker & D.E. Grogan. 1987. Nutrient dynamics of a swarm-founding social wasp species, Polybia occidentalis (Hymenoptera: Vespidae). Ethology 25: 291-305.
Jeanne, R.L. 1980. Evolution of social behavior in the Vespidae. Annu. Rev. Entomol.25: 371-396.
Jeanne, R.L. 1981. Alarm recruitment, attack behavior, and the role of the alarm pheromone in Polybia occidentalis (Hymenoptera, Vespidae) Behav. Ecol. Sociobiol 9: 143-148.
Jeanne, R.L. 1986. The organization of work in Polybia occidentalis: The costs and benefi ts of specialization in a social wasp. Behav. Ecol. Sociobiol. 19: 333-341.
Jeanne, R.L. 1991. The swarm-founding Polistinae, p.191-231. In K.G. Ross & R.W. Matthews (eds.), The social biology of wasps, Cornell Univ. Press, Ithaca, NY, 678p.
Keeping, M.G. 2002. Reproductive and worker castes in the primitively eusocial wasp Belonogaster petiolata (DeGeer) (Hymenoptera: Vespidae): Evidence for pre-imaginal differentiation. J. Insect Physiol. 48: 867- 879.
London, K.B. & R.L. Jeanne. 2003. Effects of colony size and stage of development on defense response by the swarm founding wasp Polybia occidentalis. Behav. Ecol. Sociobiol. 54: 539-546.
Mateus, S., F.B. Noll & R. Zucchi. 2004. Caste fl exibility and variation according to the colônia cycle in the swarm-founding wasp, Parachartergus fraternus (Hymenoptera: Vespidae: Epiponini). J. Kansas Entomol. Soc. 77: 281-294.
Noll, F.B., J.W. Wenzel & R. Zucchi. 2004. Evolution of caste in Neotropical swarm-founding wasps (Hymenoptera: Vespidae; Epiponini). Am. Mus. Novit. 3467: 24.
Noll, F.B. & R. Zucchi. 2000. Increasing caste differences related to life cycle progression in some Neotropical swarm-founding
polygynic wasps (Hymenoptera: Vespidae: Epiponini). Ethol. Ecol. Evol.12: 43-65.
Noll, F.B. & R. Zucchi. 2002. Castes and the infl uence of the colony cycle in swarm-founding polistine wasps (Hymenoptera: Vespidae; Epiponini). Insectes Sociaux 49: 62-74.
O’Donnell, S. 1998. Reproductive caste determination in eusocial wasps (Hymenoptera, Vespidae). Ann. Ver. Entomol. 43: 323-346.
Richards, O.W. 1971. The biology of the social wasps (Hymenoptera, Vespidae). Biol. Rev. (Cambridge) 46: 483-528.
Richards, O.W. 1978. The social wasps of the Americas excluding the Vespinae. Br. Mus. (Nat. Hist.) J., 580p.
Richards, O.W. & M.J. Richards. 1951. Observations on the social wasps of South America (Hymenoptera, Vespidae). Trans. R. Entomol. Soc. Lond.102: 1-170.
Spradbery, J.P. 1991. Evolution of queen number and queen control, p.336-388. InK.G. Ross & R.W. Matthews (eds.), The social biology of wasps. Cornell Univ. Press, Ithaca, NY,678p.
Turillazzi, S. 1991. The Stenogastrinae, p.74-98. InK.G. Ross & R.W. Matthews (eds.), The social biology of wasps. Cornell Univ. Press, Ithaca, NY,678p.
West-Eberhard, M.J. 1973. Monogyny in polygynous social wasps, p.396-403. In Proceedings of the VII Congress of I.U.S.S.I. London.
West-Eberhard, M.J. 1978. Temporary queens in Metapolybia wasps: Non-reproductive helpers without altruism? Science 200: 441-443.
Wilson, E.O. 1971. The insect societies. Belknap Press. Harv. Univ. Press., Camb. Mass., 548p.