Exploring Regional Variation in Roost
Selection by Bats: Evidence from a
Meta-Analysis
François Fabianek1*, Marie Anouk Simard2,3, André Desrochers1
1Centre d’Étude de la Forêt (CEF), and Faculté de Foresterie, de Géographie et de Géomatique, Université
Laval, Québec, Quebec, Canada,2Ministère des Forêts, de la Faune et des Parcs, Québec, Quebec,
Canada,3Centre de la Sciences de la Biodiversité du Québec, and Faculté de Foresterie, de Géographie et de Géomatique, Université Laval, Québec, Quebec, Canada
Abstract
Background and Aims
Tree diameter, tree height and canopy closure have been described by previous meta-anal-yses as being important characteristics in roost selection by cavity-roosting bats. However, size and direction of effects for these characteristics varied greatly among studies, also referred to as heterogeneity. Potential sources of heterogeneity have not been investigated in previous meta-analyses, which are explored by correlating additional covariates (moder-ator variables). We tested whether effect sizes from 34 studies were consistent enough to reject the null hypothesis that trees selected by bats did not significantly differ in their char-acteristics from randomly selected trees. We also examined whether heterogeneity in tree diameter effect sizes was correlated to moderator variables such as sex, bat species, habi-tat type, elevation and mean summer temperature.
Methods
We used Hedges’g standardized mean difference as the effect size for the most common characteristics that were encountered in the literature. We estimated heterogeneity indices, potential publication bias, and spatial autocorrelation of our meta-data. We relied upon meta-regression and multi-model inference approaches to evaluate the effects of moderator variables on heterogeneity in tree diameter effect sizes.
Results
Tree diameter, tree height, snag density, elevation, and canopy closure were significant characteristics of roost selection by cavity-roosting bats. Size and direction of effects varied greatly among studies with respect to distance to water, tree density, slope, and bark remaining on trunks. Inclusion of mean summer temperature and sex in meta-regressions further explained heterogeneity in tree diameter effect sizes.
OPEN ACCESS
Citation:Fabianek F, Simard MA, Desrochers A (2015) Exploring Regional Variation in Roost Selection by Bats: Evidence from a Meta-Analysis. PLoS ONE 10(9): e0139126. doi:10.1371/journal. pone.0139126
Editor:Brock Fenton, University of Western Ontario, CANADA
Received:May 27, 2015
Accepted:September 8, 2015
Published:September 29, 2015
Copyright:© 2015 Fabianek et al. This is an open access article distributed under the terms of the Creative Commons Attribution License, which permits unrestricted use, distribution, and reproduction in any medium, provided the original author and source are credited.
Data Availability Statement:All relevant data are included within the manuscript.
Funding:This research was funded by the Fonds de Recherche du Québec–Nature et Technologies (FQRNT). The funding organization had no role in study design, data collection and analysis, decision to publish, or preparation of the manuscript.
Conclusions
Regional differences in roost selection for tree diameter were related to mean summer tem-perature. Large diameter trees play a central role in roost selection by bats, especially in colder regions, where they are likely to provide a warm and stable microclimate for repro-ductive females. Records of summer temperature fluctuations inside and outside tree cavi-ties that are used by bats should be included in future research.
Introduction
Roosts selected by bats
Descriptions of roosts that are used by insectivorous bats in North American forests were mostly anecdotal prior to the mid-1990s. Technical developments in telemetry have been instrumental for our current understanding of habitat-species interactions with small mam-mals, such as bats [1].We now know that cavity- and bark-roosting bats rely upon living and standing dead trees (i.e., snags) in intermediate stages of decay [2,3] for roosting [4,5]. They have been reported roosting under exfoliating bark, inside trunk crevices, and within the cavi-ties of both living and dead trees during the summer [2,5–7]. The occurrence of several snags in a given stand likely indicates available roosts to bats [8,9]. Bats are faithful to their roosting sites [10–12] and switch regularly from primary roosts (which are used more frequently) to alternate roosts [13,14]. They therefore rely upon networks of clustered roost trees [15] that share similar characteristics, such as a large diameter and an intermediate stage of decay [2,
16], perhaps to minimize predation risk or to reduce commuting costs. Furthermore, snags are an ephemeral resource [17–19], which may explain—in addition to the aforementioned rea-sons—why bats favour a high density of snags near roosts [2,6,16,20,21].
Like roost availability, distance to resources (e.g., water and insect availability) appears to drive roost selection by bats. Roosts are commonly found in close proximity (i.e.,<10 km) to
ponds and riparian habitats [1,22–24], which provide good foraging conditions for bats [25–27]. Habitat complexity (i.e., level of vegetation clutter) and acoustic interferences are reduced over calm water bodies (i.e., ponds), increasing both prey detectability and capture success for bats [28,29]. Moreover, the abundance and diversity of prey is generally greater over and near ponds
[30–32]. Bats, especially lactating females [33], must rehydrate at dusk after roosting [33–35].
Sexual differences in the choice of roosts are often reported [36–39], with reproductive females (i.e., pregnant and lactating females) selecting for trees with larger diameters [36,40] compared to males and non-reproductive females. Large diameter trees offer greater thermal inertia compared to trees with smaller diameters [40–42]. The thermoregulatory advantage of warm and stable temperatures [43–45] is commonly accepted as a major driver of roost selec-tion by bats [46], especially in the case of reproductive females [5,46–48].
Like males and non-reproductive females, reproductive females may also use torpor (i.e., state of reduced body temperature and metabolic rate) to reduce energy expenditures [49], but this comes at the cost of reduced milk production [50], and delayed fetal development and juvenile growth [5,47]. To counteract these costs, lactating females may enter torpor for shorter bouts [48,51] or adopt other behavioural strategies, such as social thermoregulation [52]. Sticking together to stay warm requires large tree cavities [53,54], which underscores a central role that tree diameter plays in roost selection.
Like many birds and other small mammals [55], bats probably use passive rewarming to reduce energy expenditure during arousal, which requires an external heat source in the
afternoon [43]. Several studies [16,20,56–58] proposed that canopy emergents and tall trees that are located within canopy openings or within stands of low tree density are more accessible to bats and also benefit from greater heat transfer by solar radiation [59]. Slope, slope aspect and elevation have also been associated with longer periods of external heating provided by solar radiation [7,60,61].
As has been suggested by Lacki, Cox [7], bats might favour trees that are located at lower elevations to benefit from warmer microclimates relative to those located at higher elevations. However, without temperature measurements on the field, it is difficult to establish a causal link between microclimate and roost selection by bats. For example, preference in elevation could also be related to variation in tree species composition [60,62,63]. Lacki, Baker [8] sug-gested that stands at lower elevations provide better roosting characteristics to bats (i.e., taller canopies, higher snag densities) than higher elevation stands.
Previous narrative and quantitative reviews
The increasing number of published radio-telemetry studies has led to three systematic reviews [5,47,64] and three meta-analyses [1,7,65] that summarize habitat use by bats in both unmanaged and managed forests. In a previous systematic review, Miller, Arnett [64] suggested that most studies had small sample sizes and suffered from pseudo-replication, but the authors did not account for these caveats quantitatively. Unlike a systematic synthesis or a narrative review, a meta-analysis provides a statistical synthesis of literature by pooling effect sizes from several studies. Effect size reflects the strength of the difference between experimental and con-trol group means [66]. Standardized effect sizes are commonly used in meta-analyses to com-pare results among studies independent of the scale of measurement [66].
By performing a meta-analysis, Lacki and Baker [65], and Kalcounis-Rueppell, Psyllakis [1] confirmed that tree diameter, tree height and canopy closure were important characteristics explaining roost selection by bats, despite notable differences in size and direction of effects (i.
e., negative or positive effects) among studies. In a more recent meta-analysis of two bat spe-cies, Lacki, Cox [7] found that roosting requirements of Indiana bat (Myotis sodalis) and north-ern long-eared bat (M.septentrionalis) overlapped, except for tree diameter and variation in the type of roosts that were used. The authors concluded that the northern long-eared bat showed greater plasticity than the Indiana bat in the choice of roosting sites.
None of these meta-analyses (i.e., [1,7,65]) have tried to explain differences in effect sizes and in the direction of effects among studies, which is referred to as heterogeneity [66]. Hetero-geneity is likely to be encountered in meta-analyses, since individual studies are conducted under various field conditions, use different methodologies and attempt to answer different questions [66,67]. Meta-regression approaches are increasingly employed in meta-analyses to explore whether the heterogeneity may be correlated with additional covariates, which are referred to as moderator variables [67,68]. Moderator variables may be included to test whether heterogeneity is associated with differences in study methods [66], or in the present case, with differences in roost selection that could be related to sex [36], bat species [7] or large-scale environmental factors [48].
Aims and hypotheses
Indiana bats avoided roosting in upland habitats in regions near the northern end of the species distribution, with cooler climate and shorter growing season, with the converse occurring in southern populations (sensuLacki, Cox [7]). In the same vein, Boland, Hayes [72] suggested that in the northern range of Keen’s myotis (M.keenii), reproductive females should select for trees with larger diameters, which likely provide warmer temperatures than smaller trees, due to relatively cold and short summers in Alaska compared to southern regions. Such large-scale hypotheses typically may be tested using meta-analysis coupled with a meta-regression approach [67].
A decade of research has passed since the last meta-analysis on North American bats was conducted [1] and the number of studies on roost selection by bats has doubled (S1 Table). There are now enough studies to investigate for regional differences in roost selection using meta-regression approaches and test large-scale hypotheses based on previous knowledge of bat roosting ecology during the summer.
Our first aim was to test whether the results for the most common characteristics in the lit-erature were consistent enough among studies to reject the null hypothesis that trees selected by bats are not significantly different in their characteristics from randomly selected trees. We predicted that the effect sizes would be significantly different from zero and that the direction of effects would be consistent enough among studies (i.e., homogeneous) to reject the null hypothesis (i.e., no significant difference in characteristics from random trees) for each charac-teristic that we intended to test. After having identified the most consistent characcharac-teristics of roost selection by bats (i.e., with the strongest effect size), our second aim was to explain het-erogeneity in tree diameter effect sizes by incorporating moderator variables such as habitat type, bat species, mean summer temperature, and elevation into a set of alternative meta-regression models. According to the microclimate hypothesis (sensuBoyles [46]), we predicted that reproductive females should select larger tree diameters (relative to random trees) in northern regions and at higher altitudes, because of lower mean summer temperatures, com-pared to southern regions and lower altitudes. We predicted that reproductive females and larger species of bats would require trees with larger diameters, compared to non-reproductive females and males [36,40] or smaller species of bats [6]. We also predicted that larger tree diameters would be found in unmanaged (i.e., national parks) and riparian areas, compared to managed areas (i.e., where logging activity still occurs).
Material and Methods
Selection of studies
We searched for published bat-roost selection studies that were available online in Google Scholar and the Web of Science. Those included journal articles, government reports, Ph.D. and M.Sc. theses, book chapters, and symposia. We included most of the studies that were pre-sented in Miller, Arnett [64], Barclay and Kurta [5], Kalcounis-Rueppell, Psyllakis [1], Lacki and Baker [65], and Lacki, Cox [7]. We retained only studies that reported comparisons between random and selected trees (i.e., case/control design). Because of distinct roosting ecol-ogies [4,14], we did not include studies on foliage-roosting bats, but retained those that dealt with bark- and cavity-roosting bats.
Dataset extraction and preparation
Studies that compared different treatments or sites, or differences in roost selection among bat species, and between sexes, had more than one dataset. We regarded each dataset as a sample unit for our meta-analysis (expressed asnunless otherwise stated). We examined 20 candidate characteristics for explaining roosting preferences of cavity-roosting bats, but retained only
nine for which we found a minimum of 10 studies (i.e., 19 datasets): tree diameter (cm;S1
Table), tree height (m;S2 Table), snag density (stems/0.1 ha;S3 Table), elevation (m;S4 Table),
canopy closure (%;S5 Table), distance to water (m;S6 Table), tree density (stems/0.1 ha;S7
Table), slope (%;S8 Table), and bark remaining on trunks (%;S9 Table). We extracted means,
standard errors, standard deviations, and sample sizes for each dataset. We converted standard errors to standard deviations by multiplying the standard error of the mean by the square-root of the sample size,i.e., the number of trees. We converted all measurements of size, density and distance to the same units. For each of the nine characteristics, we calculated Hedges’g Stan-dardized Mean Difference (SMD) as an estimate of the effect size between trees that had been selected by bats (i.e., experimental group) and random trees (i.e., control group), as suggested by Borenstein, Hedges [68].
We excluded studies with an effect size greater than 4 times the mean group standard devia-tion to meet criteria of effect size normality and variance homogeneity [68]. We computed pre-diction intervals, fixed-effects and random-effects models (metapackage, R Development Core Team 2015 [73]) for comparison purposes, but used only random-effects models in our meta-analysis (S1–S9Tables). Random-effects models assume that heterogeneity not only depends upon sampling variance but also random population effect sizes [68], which is the case in our meta-analysis involving numerous bat species, together with potential variation between sexes and among habitat types.
Publication bias and heterogeneity
Testing for publication bias supposes that there is a tendency for publishing studies with signif-icant findings. If such bias is present, studies should be unbalanced towards positive results with only a few published studies supporting the null hypothesis. Publication bias is considered null when studies are well balanced (e.g., when roughly the same number of studies have reported significant findings versus those supporting the null hypothesis). We used funnel plots (i.e., effect size plotted against its standard error) to assess potential publication bias [74] for each of the nine characteristics. We tested for funnel plot asymmetry using the conventional weighted linear regression method [75], which is provided in the packagemeta[76].
We used l’Abbé plots to display meta-data visually and to investigate potential patterns of heterogeneity. In l’Abbé plots, the experimental group is plotted against the control group and the resulting regression line and its associated 95% CI is compared visually with the equality line (1:1), for which the mean difference is null [77]. We used the maximum likelihood approach (packagemeta, R Development Core Team 2015) to estimate heterogeneity (τ2) in the population effect sizes. We further quantified heterogeneity using Higgins' I2index [78] (expressed as a percentage) and used the classification scheme that was given by the authors to interpret the severity of heterogeneity (see Higgins, Thompson [78] for further details).
Moderator variables and meta-regressions
resolution) [79]. Monthly mean temperatures are based on daily minimum and maximum temperature fluctuations from 1950 to 2000 [80].
We extracted additional moderator variables from the reviewed manuscripts, such as sex (male, female, and combined), habitat type (managed areas, riparian areas and protected areas such as national parks), and bat species. Given the limited number of datasets (n= 63), we grouped bat species with fewer than 5 datasets by genus, resulting in only six classes of bat spe-cies. To interpret our meta-regression results correctly, we verifieda priorithat random-tree diameter was not correlated with latitude (r2= 0.00;P<0.9). We verified that mean summer
temperature was negatively correlated with elevation (r2= 0.21;P<0.001) and latitude (r2=
0.77;P<0.001). We decided to exclude latitude from our set of moderator variables since it
was strongly correlated (i.e.,r0.7; [81]) with mean summer temperature.
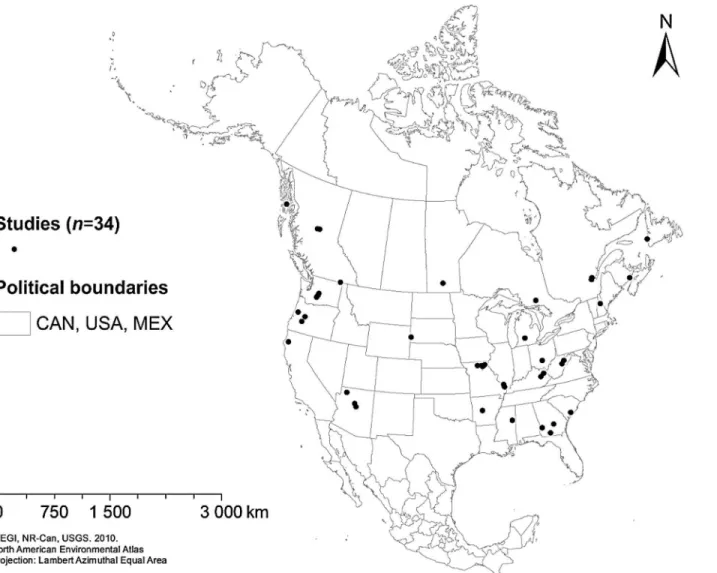
Due to the apparent spatial proximity of several studies (Fig 1), we verified that our SMD estimates and our best meta-regression model residuals were not dependent upon the effect of spatial scale (i.e., they were not autocorrelated). We predicted that studies that are close to each other would not share similar SMD (and model residual) values and the converse for distant
Fig 1. Locations of the 34 studies (66 datasets) that were included in meta-analysis of roost selection by North American bats.Map source: North American Environmental Atlas (INEGI, NR-Can, USGS, 2010).
doi:10.1371/journal.pone.0139126.g001
studies. In other words, we tested the null hypothesis of spatial randomness, for which SMD (and model residual) values would not depend upon values at neighbouring locations [82]. We chooseK= 4 nearest studies as distance-based neighbours among studies. Once our neighbour-hood of studies was created, we assigned spatial weights for each pair of neighbours, which was the inverse Euclidean distance among studies [82]. We performed a global Moran’s I test of spatial autocorrelation under randomization on the resulting Inverse Distance Weight (IDW) matrices [82]. We also used Moran's I test for residual spatial autocorrelation, which was pro-vided in the packagespdep[83].
We compared 17 candidate meta-regression models (packagemetafor, R Development Core Team 2015) to examine whether the heterogeneity in tree diameter effect sizes was explained by the aforementioned moderator variables. We constructed five subsets of candidate meta-regression models. The first set combined habitat type (i.e., management level), microclimate (i.e., mean summer temperature and elevation) and bat-related (i.e., bat species and sex) mod-erator variables. The second set combined both microclimate, and bat-related modmod-erator vari-ables. The third, fourth and fifth sets included only microclimate, bat-related or habitat type as moderator variables, respectively. We ranked the candidate set of models using the second-order Akaike’s Information Criterion for small samples (AICc). We calculatedΔAICc values (Δi) and Akaike weights (ωi) to determine the importance of the candidate set of models rela-tive to the best explanatory model (Δi= 0). Models were considered equivalent when they had aΔAICc2 [84]. We also included the pseudo-R2statistic provided by the packagemetafor
[85], which estimates the amount of heterogeneity (%) accounted for by each candidate meta-regression model.
Results
Selected studies
Of the 121 potential studies that we identified for roost selection by bats across North America, 74 studies compared roost trees that were selected by bats to random trees, and 40 of them studied rock-, lichen- or foliage-roosting bats (Fig 2). From this screening, we retained 34 stud-ies on bark- and cavity-roosting bats for our meta-analysis, which corresponded to 66 datasets
(Fig 2). We found 49 datasets in published manuscripts, 14 in unpublished Ph.D. theses, 2 in
research symposia, and 1 in a governmental report. Datasets ranged from Prince of Wales Island in Alaska (northwest;Fig 1) to Baker County, on the Coastal Plain of Georgia (southeast;
Fig 1). The datasets included 4 genera and 12 species of cavity-roosting bats: big brown bat
(Eptesicus fuscus), silver-haired bat (Lasionycteris noctivagans), southeastern myotis (M. aus-troriparius), California bat (M.californicus), western long-eared bat (M.evotis), Keen’s myotis, little brown bat (M.lucifugus), northern long-eared bat, Indiana bat, fringed myotis (M. thysa-nodes), long-legged myotis (M.volans), and evening bat (Nycticeius humeralis). Most studies were performed on females (62.1%,n= 41), while 18.2% (n= 13) were conducted on males, and 19.7% (n= 12) combined both sexes. Bats using both snags and living trees as roosts repre-sented 47% (n= 31) of the datasets, while 47% (n= 31) reported only snags, and 6% (n= 4) reported only living trees. Studies were mostly performed in managed areas (50%,n= 33), fol-lowed by 30.4% (n= 20) in protected areas, and 13.6% (n= 9) in riparian areas; 6% of the remaining datasets (n= 4) considered other treatment effects, such as fire (3%,n= 2) or vegeta-tion types (3%,n= 2).
Standardized mean differences
SMD = 0.51,P<0.0001) than random trees. Roost trees were mostly located in stands with a
higher snag density (n= 34, SMD = 0.47,P<0.0001), at a lower elevation (n= 19, SMD =
-0.35,P<0.0001), and with lower canopy closure (n= 33, SMD = -0.32,P= 0.006) compared
to random stands. We found no significant difference between roost and random trees with respect to distance to water (n= 22, SMD = -0.16,P= 0.05), tree density (n= 24, SMD = 0.06,
P= 0.58), slope (n= 21, SMD = 0.03,P= 0.78), and bark remaining on trunks (n= 26, SMD = 0.05,P= 0.78).
Publication bias and heterogeneity
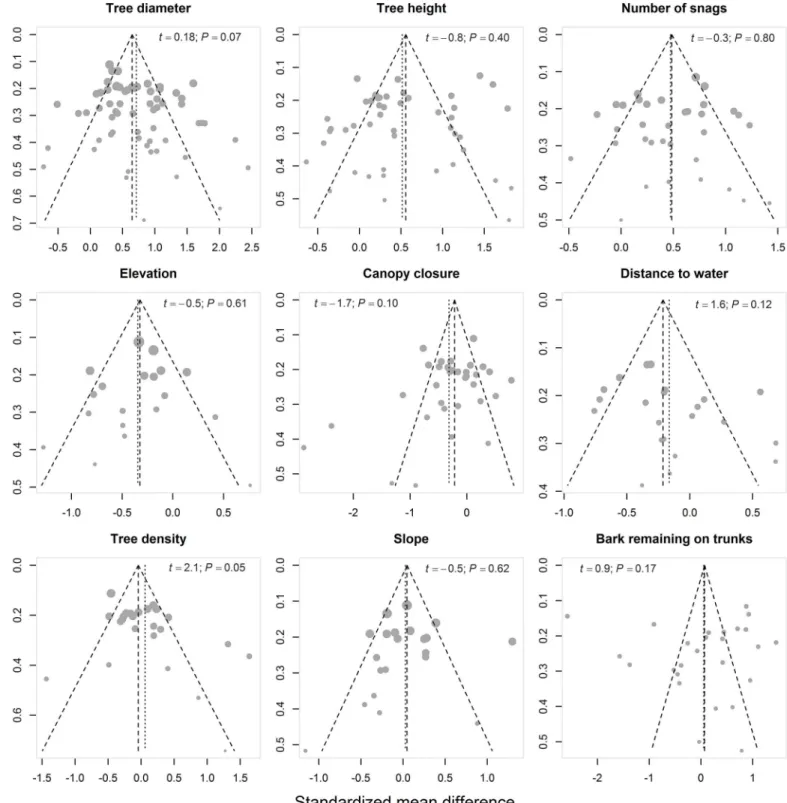
Funnel plots were well balanced (Fig 3); therefore, asymmetry tests did not reveal any signifi-cant publication bias (Table 1). Higgins’I2heterogeneity index indicated considerable levels of heterogeneity (i.e., I2indices ranging from 50% to 100%) for each characteristic of roost selec-tion by bats (Table 1;Fig 4).
Fig 2. Flow diagram for identification and selection of studies of roost selection by North American bats for meta-analysis. doi:10.1371/journal.pone.0139126.g002
Spatial autocorrelation and meta-regressions
SMD values and squared residuals of our best regression model (i.e., tree diameter effect sizes vs. mean summer temperature) were not spatially autocorrelated. Moran’s I test for spatial autocorrelation did not reject the null hypothesis of spatial randomness either for our SMD values (Moran I standard deviate = -0.29,P= 0.62) or for our best regression model residuals (Moran I standard deviate = -1.07,P= 0.28).
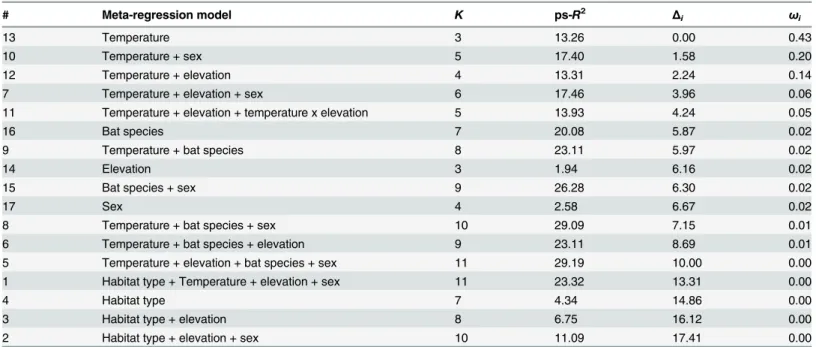
According toΔAICc (Table 2), the two meta-regression models that best explained hetero-geneity in tree diameter effect sizes, included (i) mean summer temperature (pseudo-R2= 13.26%; AICcω= 0.42) and (ii) mean summer temperature + sex (pseudo-R2= 17.40%; AICc ω= 0.19) as moderator variables. Tree diameter effect sizes for female bats increased signifi-cantly with decreasing mean summer temperature and increasing latitude. However, elevation (pseudo-R2= 1.94%; AICcω= 0.02), sex (pseudo-R2= 2.58%; AICcω= 0.02) and habitat type (pseudo-R2= 4.34%; AICcω= 0), alone had little effect on heterogeneity in tree diameter effect sizes. These single predictor models were ranked among the poorest AICc models (Table 2).
The model that explained the most heterogeneity in tree diameter effect sizes (pseudo-R2 = 29.19%) included mean summer temperature, elevation, bat species and sex as moderator vari-ables. This model had a highΔAICc (ΔAICc = 10; AICcω= 0), compared to the two best AICc models (i.e., withΔAICc = 0 and = 1.58), which included only mean summer temperature and sex as moderator variables.
Discussion
Meta-analysis and heterogeneity
Our meta-analysis included a larger number of characteristics, and increased the scope to a wider range of bat species and forest habitats throughout North America than previous quanti-tative reviews [1,7,65]. Despite an overall high level of heterogeneity among studies, five char-acteristics showed strong general trends in roost selection by bats. Cavity-roosting bats selected larger and taller roosts compared to random trees. They also roosted in stands with a larger number of surrounding snags, at lower elevations, and with less canopy closure compared to random stands. These results are consistent with those found by Lacki and Baker [65], and Kal-counis-Rueppell, Psyllakis [1]. Other characteristics, such as distance to water, slope, and bark
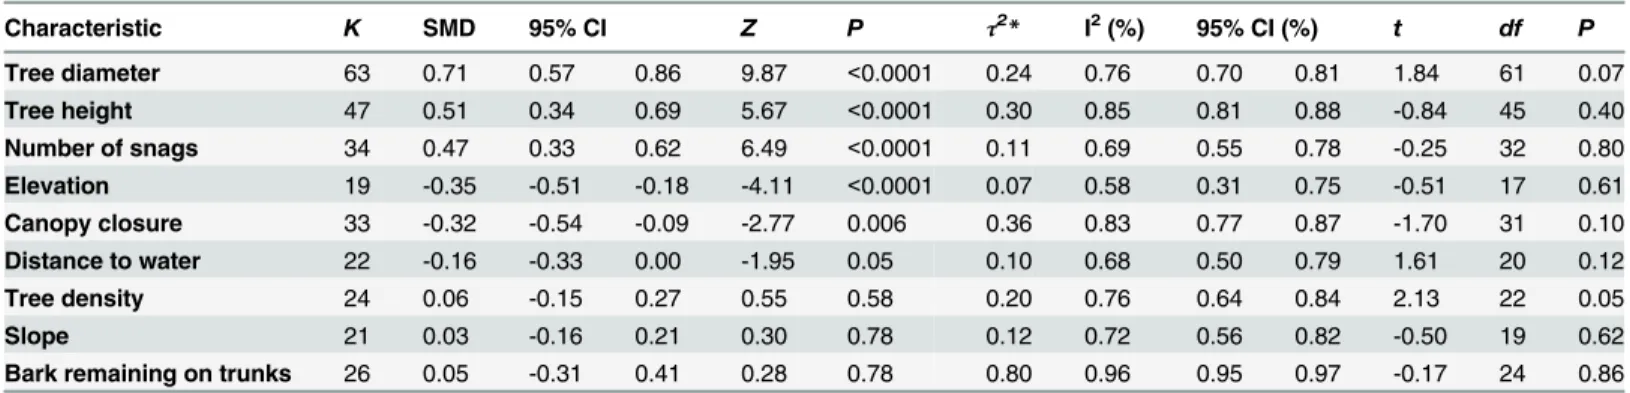
Table 1. Summary of the random effects meta-analysis of roost selection by North American bats, with heterogeneity indices and publication biases for each characteristic.
Characteristic K SMD 95% CI Z P τ2* I2(%) 95% CI (%) t df P
Tree diameter 63 0.71 0.57 0.86 9.87 <0.0001 0.24 0.76 0.70 0.81 1.84 61 0.07
Tree height 47 0.51 0.34 0.69 5.67 <0.0001 0.30 0.85 0.81 0.88 -0.84 45 0.40
Number of snags 34 0.47 0.33 0.62 6.49 <0.0001 0.11 0.69 0.55 0.78 -0.25 32 0.80
Elevation 19 -0.35 -0.51 -0.18 -4.11 <0.0001 0.07 0.58 0.31 0.75 -0.51 17 0.61
Canopy closure 33 -0.32 -0.54 -0.09 -2.77 0.006 0.36 0.83 0.77 0.87 -1.70 31 0.10
Distance to water 22 -0.16 -0.33 0.00 -1.95 0.05 0.10 0.68 0.50 0.79 1.61 20 0.12
Tree density 24 0.06 -0.15 0.27 0.55 0.58 0.20 0.76 0.64 0.84 2.13 22 0.05
Slope 21 0.03 -0.16 0.21 0.30 0.78 0.12 0.72 0.56 0.82 -0.50 19 0.62
Bark remaining on trunks 26 0.05 -0.31 0.41 0.28 0.78 0.80 0.96 0.95 0.97 -0.17 24 0.86
K = number of datasets and SMD = standardized mean difference;τ2and I2indices indicate the severity of between-studies heterogeneity; t-tests are for
funnel-plot asymmetry, with associated degrees-of-freedom and P-values. All values are rounded upward to two decimal places. *Estimated by maximum likelihood
Fig 3. Funnel plots showing publication bias for each of the nine characteristics that were included in our quantitative meta-analysis.For each dataset, the effect size on the horizontal axis (standardized mean difference) is plotted against its standard error on the vertical axis. Dotted lines define the 95% CI limits around the mean effect size (vertical dotted line). The size of the circle varies according to the assigned random weight (inverse variance of the standardized mean differences) of each dataset. Funnel plot asymmetryt-test results and associatedP-values are shown in each plot. In the absence of publication bias, studies should follow a symmetric funnel shape. Deviation from this shape may indicate publication bias.
doi:10.1371/journal.pone.0139126.g003
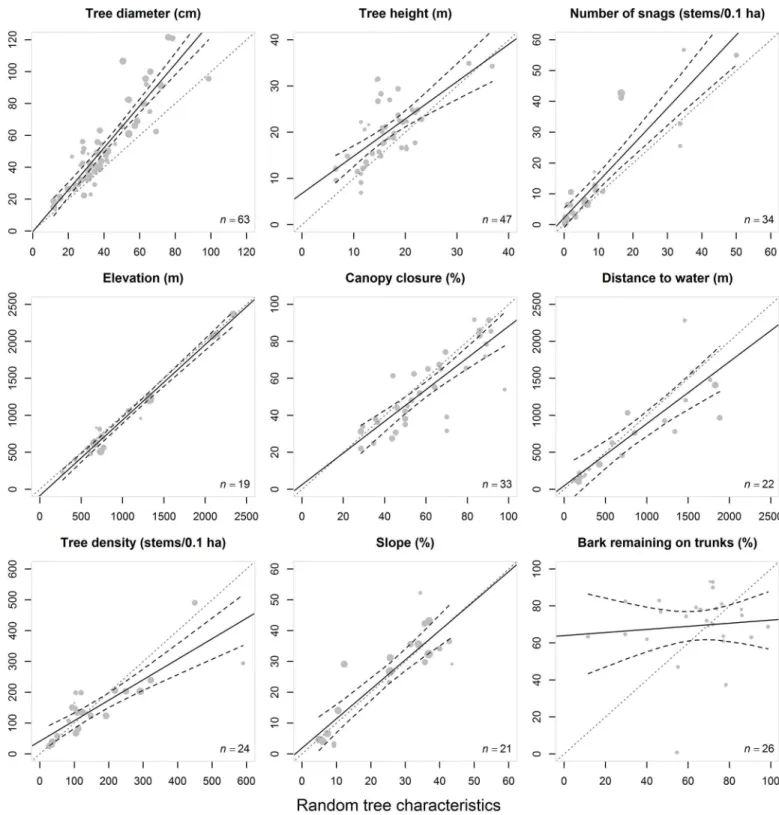
Fig 4. L’Abbé plots of the tree characteristics selected by bats (experimental groups) against the random tree characteristics (control group) with the 95% CI (black dashed lines) for each dataset, and for each characteristic (tree diameter, tree height, snag density, bark remaining on trunks, distance to water, canopy closure, elevation, slope, and stand density).The size of the circle varies according to the assigned random weight (inverse
variance of the standardized mean differences) of each dataset. The diagonal (x = y) grey dotted line is the equality line (1:1) between both means (i.e., the zero effect line, for which the mean difference = 0). Above the x = y line, the experimental group mean is higher than the control group mean. Below the x = y line, the experimental group mean is lower than the control group mean. Tau-squared (τ2) and Higgins’I2heterogeneity indices are shown in each plot.
Higgins' I2index is expressed in percentage and is used to interpret the severity of heterogeneity.
remaining on trunks, did not significantly differ from random trees because of strong differ-ences in size and direction of effects among studies. With respect to distance to water, our results slightly differed from those of Kalcounis-Rueppell, Psyllakis [1], since we included a larger set of studies [59,72,86] with a positive effect size (i.e., random trees that were closer to water). Water is an important resource for bats [33–35], especially in arid regions [34,35]. Only two studies included in our meta-analysis were located in arid regions and reported dis-tance to water [87,88]. It would be interesting to investigate if studies located in arid areas show roosts being at shorter distances to water than studies where the availability of water to bats and precipitation are important.
Characteristics likely related to temperature
We found considerable heterogeneity in slope effect sizes. Further, it was difficult to identify a general trend from the literature, since slope appears to be related to the topographical context of the study. Unlike slope, we found greater consistency between results from different studies for elevation. Heterogeneity in elevation was even the lowest compared to the other character-istics explaining roost selection that we tested. Studies were conducted at a specific elevation (i.
e., where roosts and random trees are in the same elevation zone), and short distances between roosts and matching random trees are typically taken in the field [64], which likely minimized the effect size for this characteristic. Despite the fact that studies are conducted at a specific ele-vation, we showed that elevation differences between selected and random trees is a consistent pattern among studies. Bats might select trees located at lower elevations to benefit from warmer microclimate and greater insect availability near roosts, relative to trees that are located at higher elevations [89]. Several studies found sexual segregation in bats with reproductive females less likely to occur in stands at higher elevation [90]. Russo [91] and Arnold [92]
Table 2. Meta-regression model number, number of estimated parameters (K), pseudo-R2(ps-R2) estimating the amount of heterogeneity (%) accounted for by each model, differences between model AICc and those of the best model (Δi), and Akaike weights (ωi), for 17 meta-regression models.
# Meta-regression model K ps-R2 Δ
i ωi
13 Temperature 3 13.26 0.00 0.43
10 Temperature + sex 5 17.40 1.58 0.20
12 Temperature + elevation 4 13.31 2.24 0.14
7 Temperature + elevation + sex 6 17.46 3.96 0.06
11 Temperature + elevation + temperature x elevation 5 13.93 4.24 0.05
16 Bat species 7 20.08 5.87 0.02
9 Temperature + bat species 8 23.11 5.97 0.02
14 Elevation 3 1.94 6.16 0.02
15 Bat species + sex 9 26.28 6.30 0.02
17 Sex 4 2.58 6.67 0.02
8 Temperature + bat species + sex 10 29.09 7.15 0.01
6 Temperature + bat species + elevation 9 23.11 8.69 0.01
5 Temperature + elevation + bat species + sex 11 29.19 10.00 0.00
1 Habitat type + Temperature + elevation + sex 11 23.32 13.31 0.00
4 Habitat type 7 4.34 14.86 0.00
3 Habitat type + elevation 8 6.75 16.12 0.00
2 Habitat type + elevation + sex 10 11.09 17.41 0.00
All values are rounded upward to two decimal places.
doi:10.1371/journal.pone.0139126.t002
obtained similar results with Daubenton’s bat (Myotis daubentonii) and the northern long-eared bat, respectively. Cryan, Bogan [93] showed an inverse relationship between habitat ele-vation and the presence of reproductive females in South Dakota.
Tree decay and bark remaining on trunks
Most bat species that we included in our meta-analysis seek shelter inside trunk cavities [7,72] and under the exfoliating bark of snags with an intermediate stage of decay [16,20,56,58]. Only 3 studies have reported the exclusive use of cavities within living trees [3,59,60] and two of these were associated with southeastern myotis [59,60]. Although bark remaining on trunks was the most heterogeneous characteristic among those that we studied, a clear preference was exhibited by bats towards snags with about 70% of bark remaining on trunks (Fig 4). An inter-mediate stage of decay should offer the best compromise between an appropriate tree height and enough bark remaining on the trunk to provide a roost [2,3]. Another interesting aspect of snags is that they offer less buffering capacity against external temperature variation, com-pared to living trees [42,94]. However, they likely provide more available cavities [95] com-pared to living trees. Thus, selection of roosts by bats might be driven by a trade-off between the availability of potential roost trees in a given stand [59], their related benefits in terms of warm microclimates, and their relatively short distances to feeding sites [96]. More studies are clearly needed to better understand the thermal capacity of trees and its implications in bat behaviour [41,48].
Moderator variables and tree diameter effect sizes
Tree diameter was the strongest characteristic explaining roost selection by cavity-roosting bats, since positive effect sizes (i.e., trees selected with a larger diameter than random trees) were a common finding in several studies [6,20,59,72]. The main hypothesis invoked by these studies was that trees with a larger diameter offered greater thermal inertia against external temperature variation [41,42,94,97], compared to trees with a smaller diameter. For repro-ductive female bats, the importance of stable and warm temperatures has been discussed in detail by Barclay and Kurta [5]. Reproductive females are thought to benefit from warm and stable microclimates that minimize thermoregulation costs and which maximize their fitness [5,47]. However, these assumptions have rarely been tested empirically in North American bat research [48]. Most studies that have measured temperature variation in roosts of bats and other mammals have been conducted in Europe [44,45,98] and New Zealand [41,99,100]. To our knowledge, only Park and Broders [40], have shown reductions in temperature fluctuations within roosts that were used by lactating northern long-eared bats in Newfoundland. Lacki, Johnson [43] also showed reductions in temperature fluctuations within roosts that were used by long-legged myotis and which were located beneath the exfoliating bark of trees, in Idaho and Oregon.
e.,K= 11 parameters to estimate) than the two best models [101,102], which include only mean summer temperature (K= 3) and mean summer temperature + sex (K= 5) as moderator variables.
Mean summer temperature and sex were the two moderator variables that best explained heterogeneity in tree diameter effect sizes. Our main finding was that, in the case of female bats, regional differences in selection for tree diameter were correlated to mean summer tem-peratures of the location where the studies were performed. In northern regions with lower mean summer temperatures, female bats showed greater selectivity towards large trees, com-pared to southern regions, which benefit from higher mean summer temperatures [72].
This study confirmed a relation between regional differences in roost selection by bats and differences in the climatic conditions (i.e., temperature) occurring across a broad spatial scale [7]. Most of the studies that we included in our analyses were from the Pacific Northwest of the US, the southeastern US, and southeastern Canada/northeastern US. Although the studies within these three regions appeared clustered (Fig 1), SMD estimates from these studies were not spatially dependent. In light of these results, the challenge of retaining trees with large diameters seems critical to ensuring the survival of bats, particularly in northern and moun-tainous regions with low mean summer temperatures and short growing seasons [2,72].
Limitations and research perspective
We expected a high degree of heterogeneity because the studies that we included in our meta-analysis were conducted in various habitats, had included numerous bat species, and attempted to answer different questions. Despite the inclusion of moderator variables, most heterogeneity in tree diameter effect sizes remained unexplained. We are aware that we have used a relatively coarse measure of daily summer temperature that likely underscored regional temperature fluctuations. More accurate moderator variables could likely capture more heterogeneity in tree diameter effect sizes. It is likely that the differences in results among studies were also influenced by measurement methods [64]. We agree with Miller, Arnett [64] that random sites that are located in close proximity to selected roosts by bats might increase the lack of indepen-dence, and therefore, minimize the true effect sizes for several distance-based characteristics, such as elevation and distance to water. We were not able to estimate this potential bias since the authors rarely mentioned distances between trees that were selected by bats and random trees. Including this information in future research should greatly improve the interpretation of the results.
Ambient temperature, exposure to solar radiation, and thermal properties of trees appear to play a central role in roost selection by bats. These aspects of the roost microclimate hypothesis, as described by Boyles [46], have been rarely investigated and should be included in future research. Driven by a forest management perspective, the majority of studies have focused their research on tree and stand characteristics (e.g., tree diameter, tree height, density of trees and canopy closure) that provide indirect links to microclimate. Studies that we reviewed also rarely mentioned stand age, although it may be correlated with the most important covariates of roost selection, such as tree diameter and tree height [103,104], canopy closure [105], tree density [106], snag density [18,107], and the number of available cavities [108]. The lack of published studies and available reports in northern Canada, in the desert southwest and the Midwest-West prairies in the US, and in Mexico has also limited our analyses to the southeast-ern US, the US Pacific Northwest and southeastsoutheast-ern Canada/northeastsoutheast-ern US. It would be inter-esting to include studies on roost selection by bats that were performed in northern regions to challenge our hypothesis.
Supporting Information
S1 Table. Meta-analysis on diameter at breast height (cm). Number of selected and random trees is provided for each dataset with corresponding mean, standard deviation (SD), stan-dardized mean difference (SMD) with 95% CI, fixed weight (W), and random weight. Fixed effect and random effects SMD with 95% CI, and prediction intervals are provided at the end of the table. All values are rounded upward to two decimal places.
(DOCX)
S2 Table. Meta-analysis on tree height (m). Number of selected and random trees is pro-vided for each dataset with corresponding mean, standard deviation (SD), standardized mean difference (SMD) with 95% CI, fixed weight (W), and random weight. Fixed effect and random effects SMD with 95% CI, and prediction intervals are provided at the end of the table.All values are rounded upward to two decimal places.
(DOCX)
S3 Table. Meta-analysis on snag density (stems/0.1 ha). Number of selected and random trees is provided for each dataset with corresponding mean, standard deviation (SD), stan-dardized mean difference (SMD) with 95% CI, fixed weight (W), and random weight. Fixed effect and random effects SMD with 95% CI, and prediction intervals are provided at the end of the table.All values are rounded upward to two decimal places.
(DOCX)
S4 Table. Meta-analysis on elevation (m). Number of selected and random trees is provided for each dataset with corresponding mean, standard deviation (SD), standardized mean difference (SMD) with 95% CI, fixed weight (W), and random weight. Fixed effect and ran-dom effects SMD with 95% CI, and prediction intervals are provided at the end of the table.All values are rounded upward to two decimal places.
(DOCX)
S5 Table. Meta-analysis on canopy closure (%). Number of selected and random trees is provided for each dataset with corresponding mean, standard deviation (SD), standardized mean difference (SMD) with 95% CI, fixed weight (W), and random weight. Fixed effect and random effects SMD with 95% CI, and prediction intervals are provided at the end of the table.All values are rounded upward to two decimal places.
(DOCX)
S6 Table. Meta-analysis on distance to water (m). Number of selected and random trees is provided for each dataset with corresponding mean, standard deviation (SD), standardized mean difference (SMD) with 95% CI, fixed weight (W), and random weight. Fixed effect and random effects SMD with 95% CI, and prediction intervals are provided at the end of the table.All values are rounded upward to two decimal places.
(DOCX)
S7 Table. Meta-analysis tree density (%). Number of selected and random trees is provided for each dataset with corresponding mean, standard deviation (SD), standardized mean difference (SMD) with 95% CI, fixed weight (W), and random weight. Fixed effect and ran-dom effects SMD with 95% CI, and prediction intervals are provided at the end of the table. All values are rounded upward to two decimal places.
(DOCX)
difference (SMD) with 95% CI, fixed weight (W), and random weight. Fixed effect and ran-dom effects SMD with 95% CI, and prediction intervals are provided at the end of the table.All values are rounded upward to two decimal places.
(DOCX)
S9 Table. Meta-analysis on bark remaining on trunks (%). Number of selected and random trees is provided for each dataset with corresponding mean, standard deviation (SD), stan-dardized mean difference (SMD) with 95% CI, fixed weight (W), and random weight. Fixed effect and random effects SMD with 95% CI, and prediction intervals are provided at the end of the table.All values are rounded upward to two decimal places.
(DOCX)
Acknowledgments
We thank all researchers and bat workers who made their study data available. We are grateful to J. Marchal, W.F.J. Parsons, M.C. Kalcounis-Rueppell and anonymous reviewers, who greatly improved the quality of this manuscript. This research was funded by the Fonds de Recherche du Québec–Nature et Technologies (FQRNT). The funding organization had no role in the study design, data collection and analysis, decision to publish, or preparation of the manuscript.
Author Contributions
Conceived and designed the experiments: FF MAS AD. Performed the experiments: FF. Ana-lyzed the data: FF. Contributed reagents/materials/analysis tools: FF. Wrote the paper: FF MAS AD.
References
1. Kalcounis-Rueppell MC, Psyllakis JM, Brigham RM. Tree roost selection by bats: an empirical synthe-sis using meta-analysynthe-sis. Wildlife Society Bulletin. 2005; 33(3):1123–32. doi:10.2193/0091-7648
(2005)33[1123:TRSBBA]2.0.CO;2
2. Fabianek F, Simard MA, Racine B. E, Desrochers A. Selection of roosting habitat by maleMyotisbats in a boreal forest. Canadian Journal of Zoology. 2015;(0: ):539–46. doi:10.1139/cjz-2014-0294 3. Parsons S, Lewis KJ, Psyllakis JM. Relationships between roosting habitat of bats and decay of
aspen in the sub-boreal forests of British Columbia. Forest Ecology and Management. 2003; 177(1–
3):559–70. doi:10.1016/S0378-1127(02)00448-6
4. Kunz TH, Lumsden LF. Ecology of cavity and foliage roosting bats. In: Kunz TH, Fenton MB, editors. Bat ecology. Chicago, IL: University of Chicago Press; 2007. p. 3–89.
5. Barclay RMR, Kurta A. Ecology and behavior of bats roosting in tree cavities and under bark. In: Lacki MJ, Hayes JP, Kurta A, editors. Bats in Forests. Baltimore, MD: Johns Hopkins University Press; 2007. p. 17–60.
6. Arnett EB, Hayes JP. Use of conifer snags as roosts by female bats in western Oregon. Journal of Wildlife Management. 2009; 73(2):214–25. doi:10.2193/2007-532
7. Lacki MJ, Cox DR, Dickinson MB. Meta-analysis of summer roosting characteristics of two species of Myotisbats. American Midland Naturalist. 2009; 162(2):318–26. doi:10.1674/0003-0031-162.2.318
8. Lacki MJ, Baker MD, Johnson JS. Geographic variation in roost-site selection of long-legged myotis in the Pacific Northwest. Journal of Wildlife Management. 2010; 74(6):1218–28. doi:10.2307/40801116 9. Johnson JB, Ford WM, Rodrigue JL, Edwards JW, Johnson CM. Roost selection by male Indiana
myotis following forest fires in Central Appalachian hardwood forests. Journal of Fish and Wildlife Management. 2010; 1(2):111–21. doi:10.3996/042010-JFWM-007
10. Veilleux JP, Veilleux SL. Intra-annual and interannual fidelity to summer roost areas by female eastern pipistrelles,Pipistrellus subflavus. American Midland Naturalist. 2004; 152(1):196–200. doi:10.1674/
0003-0031(2004)152[0196:IAIFTS]2.0.CO;2
11. Lewis SE. Roost fidelity of bats: a review. Journal of Mammalogy. 1995; 76(2):481–96. doi:10.2307/ 1382357
12. Willis CKR, Kolar KA, Karst AL, Kalcounis-Rueppell MC, Brigham RM. Medium- and long-term reuse of trembling aspen cavities as roosts by big brown bats (Eptesicus fuscus). Acta Chiropterologica,. 2003; 5(1):85–90. doi:10.3161/001.005.0107
13. Willis CKR, Brigham RM. Roost switching, roost sharing and social cohesion: forest-dwelling big
brown bats,Eptesicus fuscus, conform to the fission–fusion model. Animal Behaviour. 2004; 68 (3):495–505. doi:10.1016/j.anbehav.2003.08.028
14. Lacki MJ, Hayes JP, Kurta A. Bats in Forests. Baltimore, MD: Johns Hopkins University Press; 2007.
15. Johnson JB, Ford MW, Edwards JW. Roost networks of northern myotis (Myotis septentrionalis) in a managed landscape. Forest Ecology and Management. 2012; 266:223–31. doi:10.1016/j.foreco.
2011.11.032
16. Menzel MA, Owen SF, Ford WM, Edwards JW, Wood PB, Chapman BR, et al. Roost tree selection by northern long-eared bat (Myotis septentrionalis) maternity colonies in an industrial forest of the central
Appalachian mountains. Forest Ecology and Management. 2002; 155(1):107–14. doi:10.1016/ S0378-1127(01)00551-5
17. Angers VA, Drapeau P, Bergeron Y. Snag degradation pathways of four North American boreal tree species. Forest Ecology and Management. 2010; 259(3):246–56. doi:10.1016/j.foreco.2009.09.026
18. Lee P. Dynamics of snags in aspen-dominated midboreal forests. Forest Ecology and Management. 1998; 105(1–3):263–72. doi:10.1016/S0378-1127(97)00286-7
19. Lacki MJ, Baker MD, Johnson JS. Temporal dynamics of roost snags of long-legged myotis in the Pacific Northwest, USA. Journal of Wildlife Management. 2012; 76(6):1310–6. doi:10.1002/jwmg.376 20. Baker MD, Lacki MJ. Day-roosting habitat of female long-legged myotis in ponderosa pine forests.
Journal of Wildlife Management. 2006; 70(1):207–15. doi:10.2307/3803562
21. Weller TJ, Zabel CJ. Characteristics of fringed myotis day roosts in northern California. Journal of Wildlife Management. 2001; 65(3):489–97. doi:10.2307/3803102
22. Quinn GM, Broders HG. Roosting and foraging ecology of eastern pipistrelle (Perimyotis subflavus) bats in SW Nova Scotia. Unpublished report to Nova Scotia Habitat Conservation Fund c/o NS Department of Natural Resources, 2007.
23. Grindal SD. Habitat use by bats in fragmented forests. In: Barclay RMR, Brigham RM, editors. Bats and forests symposium October 1995; Victoria, BC: Research Branch, Britich Columbia Ministry of Forests; 1996. p. 260–72.
24. Krusic RA, Yamasaki M, Neefus CD, Pekins PJ. Bat habitat use in White Mountain National Forest. Journal of Wildlife Management. 1996; 60(3):625–31. doi:10.2307/3802081
25. Syme DM, Fenton MB, Zigouris J. Roosts and food supplies ameliorate the impact of a bad summer on reproduction by the bat,Myotis lucifugusLeConte (Chiroptera: Vespertilionidae). Ecoscience. 2001; 8(1):18–25.
26. Warren RD, Waters DA, Altringham JD, Bullock DJ. The distribution of Daubenton's bats (Myotis dau-bentonii) and pipistrelle bats (Pipistrellus pipistrellus) (Vespertilionidae) in relation to small-scale vari-ation in riverine habitat. Biological Conservvari-ation. 2000; 92(1):85–91. doi:10.1016/s0006-3207(99)
00062-2PMID:WOS:000083856800008.
27. Zahn A, Maier S. Hunting activity of bats at streams and ponds. Zeitschrift Fur Saugetierkunde-Inter-national Journal of Mammalian Biology. 1997; 62(1):1–11. PMID:WOS:A1997WP81700001. 28. Mackey RL, Barclay RMR. The influence of physical clutter and noise on the activity of bats over
water. Canadian Journal of Zoology. 1989; 67(5):1167–70. doi:10.1139/z89-168
29. Siemers BM, Stilz P, Schnitzler HU. The acoustic advantage of hunting at low heights above water: behavioural experiments on the European 'trawling' batsMyotis capaccinii,M.dasycnemeandM.
daubentonii. Journal of Experimental Biology. 2001; 204(22):3843–54. PMID:
WOS:000172644800003.
30. Whitaker DM, Carroll AL, Montevecchi WA. Elevated numbers of flying insects and insectivorous birds in riparian buffer strips. Canadian Journal of Zoology. 2000; 78(5):740–7. doi:10.1139/z99-254 31. Fukui D, Murakami M, Nakano S, Aoi T. Effect of emergent aquatic insects on bat foraging in a riparian
forest. Journal of Animal Ecology. 2006; 75(6):1252–8. doi:10.1111/j.1365-2656.2006.01146.x PMID:17032357.
33. Kurta A, Bell GP, Nagy KA, Kunz TH. Water balance of free-ranging little brown bats (Myotis lucifu-gus) during pregnancy and lactation. Canadian Journal of Zoology. 1989; 67(10):2468–72. doi:10.
1139/z89-348
34. Seibold S, Buchner J, Baessler C, Mueller J. Ponds in acidic mountains are more important for bats in providing drinking water than insect prey. Journal of Zoology. 2013; 290:302–8. doi:10.1111/jzo.
12041
35. Adams RA, Hayes MA. Water availability and successful lactation by bats as related to climate change in arid regions of western North America. Journal of Animal Ecology. 2008; 77:1115–21. doi:
10.1111/j.1365-2656.2008.01447.xPMID:18684132
36. Broders HG, Forbes GJ. Interspecific and intersexual variation in roost-site selection of northern long-eared and little brown bats in the Greater Fundy National Park ecosystem. Journal of Wildlife Manage-ment. 2004; 68(3):602–10. doi:10.2193/0022-541x(2004)068[0602:iaivir]2.0.co;2
37. Hamilton IM, Barclay RMR. Patterns of daily torpor and day-roost selection by male and female big brown bats (Eptesicus fuscus). Canadian Journal of Zoology. 1994; 72(4):744–9. doi:
10.1139/z94-100
38. Perry RW, Thill RE. Roost selection by male and female northern long-eared bats in a pine-dominated landscape. Forest Ecology and Management. 2007; 247(1–3):220–6. doi:10.1016/j.foreco.2007.04.
041
39. Hein CD, Castleberry SB, Miller KV. Sex-specific summer roost-site selection by Seminole bats in response to landscape-level forest management. Journal of Mammalogy. 2008; 89(4):964–72. doi:
10.1644/07-MAMM-A-335.1
40. Park AC, Broders HG. Distribution and roost selection of bats on Newfoundland. Northeastern Natu-ralist. 2012; 19(2):165–76. doi:10.1656/045.019.0203
41. Sedgeley JA. Quality of cavity microclimate as a factor influencing selection of maternity roosts by a tree-dwelling bat,Chalinolobus tuberculatus, in New Zealand. Journal of Applied Ecology. 2001; 38 (2):425–38. doi:10.1046/j.1365-2664.2001.00607.x
42. Wiebe KL. Microclimate of tree cavity nests: is it important for reproductive success in Northen
Flick-ers? The Auk. 2001; 118(2):412–21. doi:10.1642/0004-8038(2001)118[0412:MOTCNI]2.0.CO;2
43. Lacki MJ, Johnson JS, Baker MD. Temperatures beneath bark of dead trees used as roosts byMyotis volansin forests of the Pacific Northwest, USA. Acta Chiropterologica. 2013; 15(1):143–51. doi:10. 3161/150811013X667948
44. Kerth G, Weissmann K, König B. Day roost selection in female Bechstein's bats (Myotis bechsteinii):
a field experiment to determine the influence of roost temperature. Oecologia. 2001; 126(1):1–9. doi:
10.1007/s004420000489
45. Ruczyński I. Influence of temperature on maternity roost selection by noctule bats (Nyctalus noctula)
and Leisler’s bats (N.leisleri) in Białowieża Primeval Forest, Poland. Canadian Journal of Zoology. 2006; 84(6):900–7. doi:10.1139/z06-060
46. Boyles JG. Describing roosts used by forest bats: the importance of microclimate. Acta Chiropterolo-gica. 2007; 9(1):297–303. doi:10.3161/1733-5329(2007)9[297:DRUBFB]2.0.CO;2
47. Kunz TH, Lumsden LF. Ecology of cavity and foliage roosting bats. In: Kunz TH, Fenton MB, editors. Bat ecology. Chicago, IL: University of Chicago Press; 2003. p. 3–19.
48. Johnson JS, Lacki MJ. Effects of reproductive condition, roost microclimate, and weather patterns on summer torpor use by a vespertilionid bat. Ecology and Evolution. 2014; 4(2):157–66. doi:10.1002/
ece3.913PMID:24558571
49. Stawski C, Willis CKR, Geiser F. The importance of temporal heterothermy in bats. Journal of Zool-ogy. 2014; 292(2):86–100. doi:10.1111/jzo.12105
50. Wilde CJ, Knight CH, Racey PA. Influence of torpor on milk protein composition and secretion in lac-tating bats. Journal of Experimental Zoology. 1999; 284(1):35–41. doi:10.1002/(SICI)1097-010X (19990615)284:1<35::AID-JEZ6>3.0.CO;2-ZPMID:10368932
51. Dzal YA, Brigham RM. The tradeoff between torpor use and reproduction in little brown bats (Myotis lucifugus). Journal of Comparative Physiology B. 2013; 183(2):279–88. doi: 10.1007/s00360-012-0705-4
52. Willis CKR, Brigham RM. Social thermoregulation exerts more influence than microclimate on forest roost preferences by a cavity-dwelling bat. Behavioral Ecology and Sociobiology. 2007; 62(1):97–
108. doi:10.1007/s00265-007-0442-y
53. Willis CKR, Voss CM, Brigham RM. Roost selection by forest-living female big brown bats (Eptesicus fuscus). Journal of Mammalogy. 2006; 87(2):345–50. doi:10.1644/05-mamm-a-118r1.1
54. Randall LA, Jung TS, Barclay RM. Roost-site selection and movements of little brown myotis (Myotis lucifugus) in southwestern Yukon. Northwestern Naturalist. 2014; 95:312–7. doi:10.1898/13-02.1
55. Geiser F, Drury RL, Körtner G, Turbill C, Pavey CR, Brigham RM, editors. Passive rewarming from tor-por in mammals and birds: energetic, ecological and evolutionary implications. Life in the cold: Evolu-tion, Mechanisms, AdaptaEvolu-tion, and Application Twelfth International Hibernation Sympotium; 2004; Fairbanks, Alaska, USA: Institute of Arctic Biology. University of Alaska.
56. Brigham RM, Vonhof MJ, Barclay RMR, Gwilliam JC. Roosting behavior and roost-site preferences of forest-dwelling California bats (Myotis californicus). Journal of Mammalogy. 1997; 78(4):1231–9. doi:
10.2307/1383066
57. Ormsbee PC, McComb WC. Selection of day roosts by female long-legged myotis in the central Ore-gon Cascade range. Journal of Wildlife Management. 1998; 62(2):596–603. doi:10.2307/3802335 58. Vonhof MJ, Barclay RMR. Roost-site selection and roosting ecology of forest-dwelling bats in
south-ern British Columbia. Canadian Journal of Zoology. 1996; 74(10):1797–805. doi:10.1139/z96-200 59. Clement MJ, Castleberry SB. Southeastern myotis (Myotis austroriparius) roost selection in
cypress-gum swamps. Acta Chiropterologica. 2013; 15(1):133–41. doi:10.3161/150811013x667939
60. Fleming HL, Jones JC, Belant JL, Richardson DM. Multi-scale roost site selection by Rafinesque's big-eared bat (Corynorhinus rafinesquii) and southeastern myotis (Myotis austroriparius) in Missis-sippi. American Midland Naturalist. 2013; 169(1):43–55. doi:10.1674/0003-0031-169.1.43
61. Lacki MJ, Schwierjohann JH. Day-roost characteristics of northern bats in mixed mesophytic forest. Journal of Wildlife Management. 2001; 65(3):482–8. doi:10.2307/3803101
62. Broders HG. Summer roosting and foraging behaviour of sympatricMyotis septentrionalisandM. luci-fugus. Fredricton, NB: University of New Brunswick; 2003.
63. Carter TC. Summer habitat use of roost trees by the endangered Indiana bat(Myotis sodalis) in the Shawnee National Forest of southern Illinois. Southern Illinois: Carbondale University; 2003.
64. Miller DA, Arnett EB, Lacki MJ. Habitat management for forest-roosting bats of North America: a criti-cal review of habitat studies. Wildlife Society Bulletin. 2003; 31(1):30–44. doi:10.2307/3784357
65. Lacki MJ, Baker MD. A prospective power analysis and review of habitat characteristics used in stud-ies of tree-roosting bats. 2003; 5(2): 199–208. doi:10.3161/001.005.0211
66. Borenstein M, Hedges LV, Higgins JPT, Rothstein HR. Introduction to Meta-Analysis. Chichester, UK: John Wiley & Sons; 2009. Available from: doi:10.1002/9780470743386.refs
67. Baker WL, Michael White C, Cappelleri JC, Kluger J, Coleman CI, From the Health Outcomes P, et al. Understanding heterogeneity in meta-analysis: the role of meta-regression. International Journal of Clinical Practice. 2009; 63(10):1426–34. doi:10.1111/j.1742-1241.2009.02168.xPMID:19769699 68. Borenstein M, Hedges LV, Higgins JPT, Rothstein HR. A basic introduction to fixed-effect and ran-dom-effects models for meta-analysis. Research Synthesis Methods. 2010; 1(2):97–111. doi:10.
1002/jrsm.12PMID:26061376
69. Hughes TP, Baird AH, Dinsdale EA, Harriott VJ, Moltschaniwskyj NA, Pratchett MS, et al. Detecting regional variation using meta-analysis and large-scale sampling: latitudinal patterns in recruitment. Ecology. 2002; 83(2):436–51. doi:10.1890/0012-9658(2002)083[0436:DRVUMA]2.0.CO;2 70. Britzke ER, Harvey MJ, Loeb SC. Indiana bat,Myotis sodalis, maternity roosts in the southern United
States. Southeastern Naturalist. 2003; 2:235–42. doi:10.1656/1528-7092(2003)002[0235:IBMSMR]
2.0.CO;2
71. Britzke ER, Hicks AC, Von Oettingen SL, Darling SR. Description of spring roost trees used by female Indiana bats (Myotis sodalis) in the Lake Champlain valley of Vermont and New York. American Mid-land Naturalist. 2006; 155(1):181–7. doi:10.1674/0003-0031(2006)155[0181:DOSRTU]2.0.CO;2 72. Boland JL, Hayes JP, Smith WP, Huso MM. Selection of day-roosts by Keen's myotis (Myotis keenii)
at multiple spatial scales. Journal of Mammalogy. 2009; 90(1):222–34. doi:
10.1644/07-MAMM-A-369.1
73. R Development Core Team. R: A language and environment for statistical computing. Vienna, Aus-tria.http://www.R-project.org/: R Foundation for Statistical Computing; 2015.
74. Anzures-Cabrera J, Higgins JPT. Graphical displays for meta-analysis: an overview with suggestions
for practice. Research Synthesis Methods. 2010; 1(1):66–80. doi:10.1002/jrsm.6PMID:26056093
75. Egger M, Smith GD, Schneider M, Minder C. Bias in meta-analysis detected by a simple, graphical test. British Medical Journal. 1997; 315(7109):629–34. doi:10.1136/bmj.315.7109.629PMID: 9310563
76. Schwarzer G. meta: meta-analysis with R. R package version 3.6–0. 2014.
77. Song F. Exploring heterogeneity in meta-analysis: is the L'Abbé plot useful? Journal of Clinical Epide-miology. 1999; 52(8):725–30. doi:10.1016/S0895-4356(99)00066-9PMID:10465316
79. Hijmans RJ, Cameron SE, Parra JL, Jones PG, Jarvis A. Very high resolution interpolated climate sur-faces for global land areas. International Journal of Climatology. 2005; 25(15):1965–78. doi:10.1002/
joc.1276
80. O’Donnell MS, Ignizio DA. Bioclimatic predictors for supporting ecological applications in the conter-minous United States. U.S. Geological Survey Data Series 691; 2012. p. 10.
81. Dormann CF, Elith J, Bacher S, Buchmann C, Carl G, Carré G, et al. Collinearity: a review of methods
to deal with it and a simulation study evaluating their performance. Ecography. 2013; 36(1):27–46. doi:10.1111/j.1600-0587.2012.07348.x
82. Dormann CF, McPherson JM, Araújo MB, Bivand R, Bolliger J, Carl G, et al. Methods to account for spatial autocorrelation in the analysis of species distributional data: a review. Ecography. 2007; 30 (5):609–28. doi:10.1111/j.2007.0906–7590.05171.x
83. Bivand R, Piras G. Comparing implementations of estimation methods for spatial econometrics. Jour-nal of Statistical Software. 2015; 63(18):1–36. doi: 11250/276920
84. Burnham KP, Anderson DR. Model Selection and Multimodel Inference: A Practical Information-Theo-retic Approach. Second ed. New York, NY: Springer; 2002. 488 p.
85. Viechtbauer W. Conducting meta-analyses in R with the Metafor package. Journal of Statistical Soft-ware. 2010; 36:1–48.
86. Jung TS, Thompson ID, Titman RD. Roost site selection by forest-dwelling maleMyotisin central Ontario, Canada. Forest Ecology and Management. 2004; 202(1–3):325–35. doi:10.1016/j.foreco.
2004.07.043
87. Rabe MJ, Morrell TE, Green H, Devos JJC, Miller CR. Characteristics of ponderosa pine snag roosts used by reproductive bats in northern Arizona. Journal of Wildlife Management. 1998; 62:612–21. doi:
10.2307/3802337
88. Herder MJ, Jackson JG. Roost preferences of long-legged myotis in northern Arizona. Transactions of the Western Section of the Wildlife Society. 2000; 36:1–7.
89. Grindal SD, Morissette JL, Brigham RM. Concentration of bat activity in riparian habitats over an ele-vational gradient. Canadian Journal of Zoology. 1999; 77: 972–7. doi:10.1139/z99-062
90. Senior P, Butlin RK, Altringham JD. Sex and segregation in temperate bats. Proceedings of the Royal Society of London Series B-Biological Sciences. 2005; 272(1580):2467–73. doi:10.2307/30047851
91. Russo D. Elevation effects on the distribution of the two sexes in Daubenton’s batsMyotis daubento-nii(Chiroptera: Vespertilionidae) from Italy. Mammalia. 2002; 66:543–51. doi:10.1515/mamm.2002.
66.4.543
92. Arnold BD. Population structure and sex-biased dispersal in the forest dwelling vespertilionid bat,
Myotis septentrionalis. American Midland Naturalist. 2007; 157(2):374–84. doi:10.1674/0003-0031
(2007)157[374:PSASDI]2.0.CO;2
93. Cryan PM, Bogan MA, Altenbach JS. Effect of elevation on distribution of female bats in the Black Hills, South Dakota. Journal of Mammalogy. 2000; 81(3):719–25. doi:10.1644/1545-1542(2000)
081<0719:eoeodo>2.3.co;2
94. Paclík M, Weidinger K. Microclimate of tree cavities during winter nights—implications for roost site
selection in birds. International Journal of Biometeorology. 2007; 51(4):287–93. doi:
10.1007/s00484-006-0067-2PMID:17211641
95. Fan Z, Shifley SR, Spetich MA, Thompson Iii FR, Larsen DR. Distribution of cavity trees in midwestern old-growth and second-growth forests. Canadian Journal of Forest Research. 2003; 33(8):1481–94.
doi:10.1139/x03-068
96. Kurta A. Bats on the surface: the need for shelter, food, and water. In: Vories KC, Throgmorton D, edi-tors. Bat conservation and mining; Alton, IL: Office of Surface Mining, U.S. Department of the Interior; 2001. p. 14–6.
97. Coombs AB, Bowman J, Garroway CJ. Thermal properties of tree cavities during winter in a northern hardwood forest. Journal of Wildlife Management. 2010; 74(8):1875–81. doi:10.2193/2009-560 98. Grüebler MU, Widmer S, Korner-Nievergelt F, Naef-Daenzer B. Temperature characteristics of winter
roost-sites for birds and mammals: tree cavities and anthropogenic alternatives. International Journal of Biometeorology. 2013;(58: ):629–37. doi:10.1007/s00484-013-0643-1
99. Sedgeley JA. Roost site selection and roosting behaviour in lesser short‐tailed bats (Mystacina tuber-culata) in comparison with long‐tailed bats (Chalinolobus tuberculatus) in Nothofagus forest, Fiord-land. New Zealand Journal of Zoology. 2003; 30(3):227–41. doi:10.1080/03014223.2003.9518341 100. Sedgeley JA, O'Donnell CF. Roost use by long-tailed bats in South Canterbury: examining predictions
of roost-site selection in a highly fragmented landscape. New Zealand journal of ecology. 2004; 28 (1):1–18.
101. Arnold TW. Uninformative parameters and model selection using Akaike's Information Criterion. Jour-nal of Wildlife Management. 2010; 74(6):1175–8. doi:10.1111/j.1937-2817.2010.tb01236.x
102. Burnham KP, Anderson DR, Huyvaert KP. AIC model selection and multimodel inference in behav-ioral ecology: some background, observations, and comparisons. Behavbehav-ioral Ecology and Sociobiol-ogy. 2011; 65(1):23–35. doi:10.1007/s00265-010-1029-6
103. Leak WB. Relationships of tree age to diameter in old-growth northern hardwoods and spruce-fir.
Broomall, PA: USDA, Forest Service, Northeastern Forest Experiment Station, 1985 Contract No.: Research Note NE-329.
104. Vanclay JK. Tree diameter, height and stocking in even-aged forests. Annals of Forest Science. 2009; 66(7):702–. doi:10.1051/forest/2009063
105. McCarthy JW. Gap dynamics of forest trees: a review with particular attention to boreal forests. Envi-ronmental Reviews. 2001; 9(1):1–59. doi:10.1139/a00-012
106. Tyrrell LE, Crow TR. Structural characteristics of old-growth hemlock-hardwood forests in relation to age. Ecology. 1994; 75(2):370–86. doi:10.2307/1939541
107. Moroni MT, Harris DD. Snag frequency, diameter and species distribution and input rate in Newfound-land boreal forests. Forestry. 2010; 83(3):229–44. doi:10.1093/forestry/cpp027