The Antiviral Activity of Approved and Novel
Drugs against HIV-1 Mutations Evaluated
under the Consideration of Dose-Response
Curve Slope
Shuai Chang1, Daomin Zhuang2, Wei Guo3, Lin Li2, Wenfu Zhang1, Siyang Liu2,
Hanping Li2, Yongjian Liu2, Zuoyi Bao2, Jingwan Han2, Hongbin Song1☯*, Jingyun Li2☯*
1Institute of Disease Control and Prevention, Academy of Military Medical Science, Beijing, China,2State Key Laboratory of Pathogen and Biosecurity, Institute of Microbiology and Epidemiology, Academy of Military Medical Science, Beijing, China,3NO. 201 hospital, Liaoyang, Liaoning, China
☯These authors contributed equally to this work. *[email protected](JYL);[email protected](HBS)
Abstract
Objectives
This study was designed to identify common HIV-1 mutation complexes affecting the slope of inhibition curve, and to propose a new parameter incorporating both the IC50 and the slope to evaluate phenotypic resistance.
Methods
Utilizing site-directed mutagenesis, we constructed 22 HIV-1 common mutation complexes. IC50 and slope of 10 representative approved drugs and a novel agent against these muta-tions were measured to determine the resistance phenotypes. The values of new parameter incorporating both the IC50 and the slope of the inhibition curve were calculated, and the correlations between parameters were assessed.
Results
Depending on the class of drug, there were intrinsic differences in how the resistance muta-tions affected the drug parameters. All of the mutamuta-tions resulted in large increases in the IC50s of nucleoside reverse transcriptase inhibitors. The effects of the mutations on the slope were the most apparent when examining their effects on the inhibition of non-nucleo-side reverse transcriptase inhibitors and protease inhibitors. For example, some mutations, such as V82A, had no effect on IC50, but reduced the slope. We proposed a new concept, termed IIPatoxic, on the basis of IC50, slope and the maximum limiting concentrations of the
drug. The IIPatoxicvalues of 10 approved drugs and 1 novel agent were calculated, and
were closely related to the IIPmaxvalues (r>0.95,p<0.001).
OPEN ACCESS
Citation:Chang S, Zhuang D, Guo W, Li L, Zhang W, Liu S, et al. (2016) The Antiviral Activity of Approved and Novel Drugs against HIV-1 Mutations Evaluated under the Consideration of Dose-Response Curve Slope. PLoS ONE 11(3): e0149467. doi:10.1371/journal.pone.0149467
Editor:Luis Menéndez-Arias, Centro de Biología Molecular Severo Ochoa (CSIC-UAM), SPAIN
Received:December 14, 2015
Accepted:February 1, 2016
Published:March 1, 2016
Copyright:© 2016 Chang et al. This is an open access article distributed under the terms of the
Creative Commons Attribution License, which permits unrestricted use, distribution, and reproduction in any medium, provided the original author and source are credited.
Data Availability Statement:All relevant data are within the paper and its Supporting Information files.
Funding:The National Key S&T Special Projects on Major Infectious Disease grant, 2012ZX10001-002. Jingyun Li, (State Key Laboratory of Pathogen and Biosecurity, Institute of Microbiology and
Conclusions
This study confirms that resistance mutations cannot be accurately assessed by IC50 alone, because it tends to underestimate the degree of resistance. The slope parameter is of very importance in the measurement of drug resistance and the effect can be applied to more complex patterns of resistance. This is the most apparent when testing the effects of the mutations on protease inhibitors activity. We also propose a new index, IIPatoxic, which
incorporates both the IC50 and the slope. This new index could complement current IIP indi-ces, thereby enabling predict the efficacy of pre-clinical drugs for which human pharmacoki-netic is not available.
Introduction
Over the last two decades, advances in antiretroviral therapy have revolutionized the manage-ment of human immunodeficiency virus (HIV) and the control of HIV epidemics [1,2]. Despite these advances, however, some factors, such as drug resistance and rebound viremia under suboptimal treatment conditions [3–8] may lead to treatment failure. Thus, precise quantification of the activity of antiretroviral drugs and drug regimens against drug resistant variants is essential in choosing maximally active drugs and developing newer drugs with high activity and functionality.
Several pharmacodynamic properties are used to determine the activity of a drug. The cur-rently standard measure is the IC50, the concentration of drug required for 50% inhibitionin vitro. Furthermore, resistance and resistant mutants are typically identified by fold change in IC50 relative to that of the wild-type (WT) strain [9,10]. The IC50, however, represents only a single point on the dose-response curve and tends to be a poor reflection of antiviral activity among drug classes at higher drug concentrations. For example, recent studies reported that pharmacodynamic parameters such as the IC50 do not distinguish protease inhibitors (PIs) and non-nucleoside reverse transcriptase inhibitors (NNRTIs) from relatively less active nucle-oside reverse transcriptase inhibitors (NRTIs) [11–15]. Clinically, antiretroviral drugs are used at concentrations substantially above the IC50, and clinical outcomes may generally depend on whether 99% inhibition is achieved. Indeed, predicting concentrations of antiretroviral drugs based solely on the IC50 when the shape of the dose-response curve is known may result in the loss of important pharmacologic principles underlying the curve. If a drug has a steep dose-response curve, defined as a high slope, a small change in drug concentration can have a signifi-cant effect [14], which may push inhibition to less than 100% and lead to an unfavorable out-come. Thus, the slope of the dose-response curve is an important, but generally neglected parameter of antiviral activity [11–17].
Furthermore, it is implicit in current studies that resistance mutations shift dose-response curves to the right alone without affecting their slope [4,9,10]. It is noteworthy that resistance mutations that reduce the slope of the dose-response curve may result in substantial drug resis-tance. To date, however, the effects of resistance mutations on the slope have not been brought into the laboratory monitoring as a standard parameter when evaluating antiviral activity of a drug. Currently, the wide coverage of highly active antiretroviral therapy (HAART) has led to HIV-1 mutation complexes becoming the most frequent patterns in treating HIV-infected individuals. It is unclear that the effect of resistance mutation complexes on antiretroviral activ-ity under the consideration of dose-response curve slope.
Instantaneous inhibitory potential (IIP), which is dependent on IC50, slope, andin vivo
drug concentration, is a more accurate pharmacodynamic measure of antiviral activity than current parameters such as IC50 alone [11]. However, it is impossible to determine the plasma concentrations of novel, pre-clinical drugs. There is a need to add a parameter to the IIP indices to allow the assessment of drugs in the absence ofin vivoplasma concentration.
This study was therefore designed to evaluate the effects of common HIV-1 resistance muta-tion complexes on the IC50 and slope, and to propose a parameter that incorporates both IC50 and slope to determine the efficacy of pre-clinical antiretroviral drug candidates.
Materials and Methods
Antiretroviral compounds
The antiretroviral drugs used in this study included zidovudine (ZDV, AZT), lamivudine (3TC), indinavir (IDV), nelfinavir (NFV), saquinavir (SQV), and ritonavir (RTV), all from Sigma-Aldrich Co. (St. Louis, MO, USA); and didanosine (ddI), stavudine (d4T), nevirapine (NVP), and efavirenz (EFV), all from Shanghai Desano Chemical Pharmaceutical Develop-ment Co., Ltd. (Shanghai, China). All of these drugs are used commonly in China for antiretro-viral treatment. DG35 was a new PI, provided by Hesi Scientific and Technology Ltd (Xi’an, Shaanxi, China).
All of these drugs were dissolved in dimethyl sulfoxide (DMSO) and stored at -20°C. Drugs were serially diluted, such that the final concentration of DMSO in cell culture medium was 0.5%.
Cells and viruses
The human T-cell line MT-2 [18] was maintained in RPMI 1640 medium (Gibco, Gaithers-burg, MD, USA). Human embryonic kidney 293T cells [19] are adenovirus-transformed human embryonic kidney cells, and TZM-bl cells (JB53BL-13) [20] contain luciferase andβ -galactosidase genes under the control of HIV Tat expression. Both cell lines were cultured in Dulbecco’s Modified Eagle’s Medium (DMEM) (Gibco, Gaithersburg, MD, USA). All of these cell lines were kindly provided by Dr. Lu of the Laboratory of Nucleic Acid Vaccines at the University of Massachusetts Medical School (Worcester, MA, USA) in 2005. Culture media were supplemented with 10% fetal bovine serum (FBS) (Gibco, Gaithersburg, MD, USA), and cells were cultured at 37°C and 5% CO2. HIV-1NL4-3was initially obtained from Dr. Lu in 2006 and long-term stored in our laboratory.
Construction of HIV-1 mutants
\K103N\K238T mutations were introduced into the RT coding region. The ligations harboring the desired mutations were digested with the restriction enzymesSphIandAgeI(New England BioLabs, Ltd., Beijing, China), and the digested targeted segments were cloned into the pNL4.3-Δ(SphI-AgeI) vector. These plasmids were subsequently transfected into HEK293T cells using Lipofectamine12000 (Life Technologies Co., Carlsbad, CA, USA), according to the manufacturer’s instructions. Culture supernatants were harvested 2–3 days after transfection, stored at -80°C, and sequenced to confirm the presence of the desired mutations.
In vitro
drug susceptibility assay
For experiments testing RT inhibitors, triple serial dilutions spanning empirically determined ranges for each drug were added to wells of 384-well plates. TZM-bl cells (10,000 cells/well) were infected with recombinant virus at an MOI of 0.02 in plates containing pre-plated antire-troviral drugs. After 48 h, the expression of the luciferase reporter gene was measured using a Bright-Glo Luciferase Assay (Promega Co., Madison, WI, USA).
As the inhibitory effect of PIs cannot be detected in TZM-bl cells after 48 h, the protocol for PI susceptibility assays was based on a modification of the reporter gene assay for determining antiretroviral activity. During the first round of infection, 200 TCID50s of each viral stock were used to infect 13,500 MT-2 cells (MOI, 0.01) in diaphanous 384-well plates containing 3-fold serial dilutions of each tested PI. After 72 h in culture, 20μL of supernatant containingde novo
produced viral particles was transferred to new TZM-bl cultures (12,000 cells/well) in black 384-well plates. HIV-1 infection in this second round was monitored by measuringβ -galactosi-dase expression in infected target cells 24 h after infection.
In vitro
cellular toxicity assay
The potential cellular toxicities of drugs in MT-2 cells were determined by measuring cellular ATP levels in the presence of various concentrations of these compounds. MT-2 cells (13,500 cells/well) were cultured with each compound at 37°C and 5% CO2. After 72 h, CellTiter-Glo reagent (Promega Co., Madison, WI, USA) was added to each well, and chemiluminescence was measured. The maximum nontoxic concentration was defined as the concentration of inhibitor that had no effect on cellular ATP levels.
Analysis of dose-response curves
Percent inhibition was calculated as [1−(virus production in the presence of drug / virus pro-duction in the absence of drug)] × 100. The IC50 and slope of the inhibition curve of each inhibitor were determined by fitting the inhibition curves to the data using nonlinear regres-sion analysis to generate a four parameter sigmoid dose-response equation (GraphPad Prism, version 6.02). This step was performed in triplicate for duplicate plates of each concentration of antiretroviral drug. The mean IC50 and slope were calculated using all of the replicates for each virus and were expressed as mean ± standard deviation. The slope parameter is analogous to the Hill coefficient, which determines the degree of cooperativeness of the ligand binding to the enzyme or receptor [21]. A coefficient of 1 indicates that the affinity of the enzyme for a ligand is independent on whether or not other ligands are already present on the same enzyme. When the coefficient applies to the binding of anti-HIV drugs to the relevant HIV-1 enzymes, a coefficient of 1 indicates that there is only a single drug target mediating a step in the life cycle [22].
IIP, which incorporates IC50, slope, and drug concentration, was used to better evaluate the antiviral activity of drugs [11]. IIP was calculated using the equation:IIP = log [1 + (D / IC50)
results were expressed as fold changes in IC50 and fractional changes in slope and IIP. The fold change in IC50 reflected the IC50 of a particular drug to a mutant virus relative to the IC50 of the same drug to a wild-type reference virus (HIVNL4-3). The fractional change in slope was computed as:1−(mmutant/ mNL4-3)(2); and the fractional change in IIP was computed as:
1−(IIPmutant/ IIPNL4-3)(3).
Statistical analyses
The mean and standard deviations for IC50, slope, and IIP were calculated using Microsoft Office Excel 2013 software. Pearson’s correlation coefficient was used to determine correlations between parameters. All statistical analyses were performed using SPSS version 16.0 software, andp-values less than 0.05 were considered statistically significant.
Results
Analysis of dose-response curves
Drug susceptibility was assayed based on the MT-2/TZM-bl cells assay system.Fig 1shows the IC50 and slope of various approved drugs for wild-type HIVNL4-3. Depending on drug class, there were intrinsic differences in the dose-response curves, both in their location (IC50) and shape (slope). The degree of IC50 varied widely, and the slope values for NNRTIs and PIs, except for NFV, were above 1, although those for most NRTIs were less than 1.
Effect of RT inhibitor associated mutations on IC50 and slope
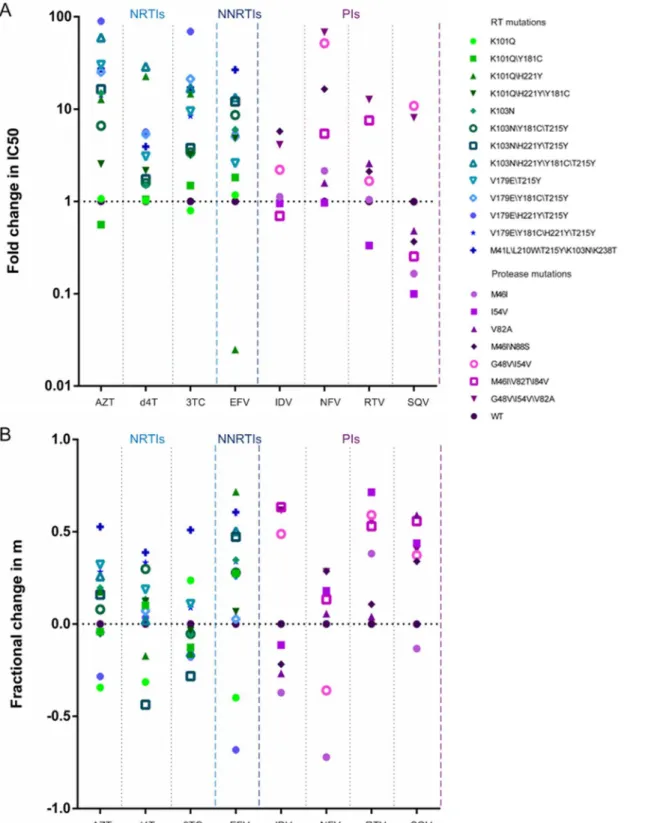
Utilizing site-directed mutagenesis, we constructed viruses bearing common mutations that confer drug resistance.Fig 2A and 2Bshow fold changes in IC50 and fractional changes in slope, respectively, for mutants relative to the wild-type virus. All of these mutations resulted in large increases in the IC50s for NRTIs, without affecting the slope of the curves (Fig 3A). Furthermore, similar results were also observed in the curves of some NNRTIs. For example, the inhibition curve of the K103N\H221Y\T215Y mutation was shifted toward a higher drug concentration for EFV (12.09-fold), with no alterations in shape. However, the K103N\H221Y \Y181C\T215Y mutation led to an intermediate shift in IC50 but a marked reduction in slope (Fig 3B). Although the virus harboring the K101Q\H221Y mutation was found to be hyper-susceptible to EFV, the slope of the curve was significantly decreased. This effect of resistance would not be found in assays based solely on fold changes in IC50.
Effect of PI associated mutations on IC50 and slope
Fig 1. (A) IC50s and (B) slopes of three classes of antiretroviral drugs against HIVNL4-3, as determined during multiple-round infectivity assays.
Fig 2. Effects of various resistance mutations on (A) IC50 and (B) slope, as calculated from dose-response curves.Fold changes in IC50 for mutants were relative to those for the wild-type virus, and fractional changes in slope were computed using equation (2). The drugs tested are grouped by class: NRTIs, NNRTI, and PIs. Within each class, different shapes indicate the various mutants.
Parameters for assessing approved and novel drugs
IIP was calculated using equation (1), which included the IC50, slope and concentration of antiviral drugs. To simulate the real activityin vivo, peak plasma concentrations of the drugs
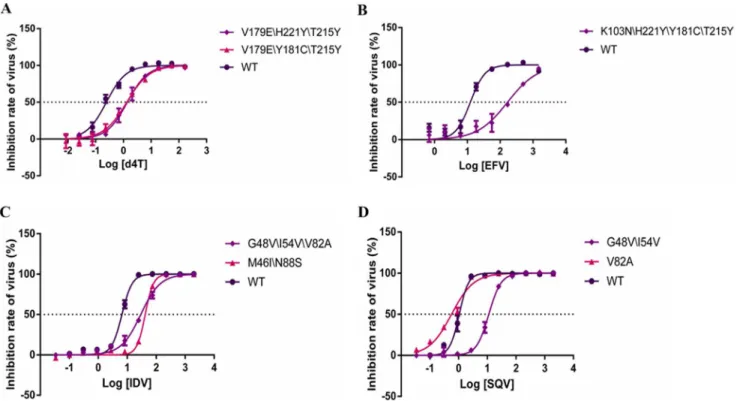
Fig 3. Curves of the dose-response of selected drugs.x axes indicate log of drug concentration (nM), y axes indicate the inhibitor rate of virus (%). (A) is the curve of the dose-response of 3 viruses (V179E\H221Y\T215Y, V179E\Y181C\T215Y and WTNL4.3) in d4T. (B) is the curve of the dose-response of 2 viruses (K103N\H221Y\Y181C\T215Y and WTNL4.3) in EFV. (C) is the curve of the dose-response of 3 viruses (G48V\I54V\V82A, M46I\N88S and WTNL4.3) in IDV. (D) is the curve of the dose-response of 3 viruses (G48V\I54V, V82A and WTNL4.3) in SQV.
doi:10.1371/journal.pone.0149467.g003
Table 1. Fold changes in IC50 and fractional changes in the slopes of the inhibition curves of various drugs for the selected protease inhibitors resistance mutations.
Mutations IDV NFV RTV SQV
Fold change in IC50*
Fractional change in slope*
Fold change in IC50*
Fractional change in slope*
Fold change in IC50*
Fractional change in slope*
Fold change in IC50*
Fractional change in slope*
M46I 1.12±0.06 -0.37±0.08 2.15±0.37 -0.72±0.06 1.05±0.32 0.38±0.15 0.16±0.03 -0.13±0.04 I54V 0.95±0.01 -0.11±0.13 0.97±0.01 0.18±0.08 0.33±0.12 0.71±0.11 0.10±0.03 0.44±0.08
V82A 1.09±0.17 -0.27±0.10 1.59±0.33 0.06±0.12 2.58±1.30 0.04±0.01 0.48±0.23 0.59±0.05
M46I\N88S 5.75±0.73 -0.22±0.05 16.54±9.03 0.29±0.02 2.11±0.26 0.11±0.02 0.37±0.04 0.34±0.18 G48V\I54V 2.20±0.71 0.49±0.02 51.78±6.00 -0.36±0.10 1.66±0.05 0.59±0.11 10.87±0.67 0.37±0.01 M46I\V82T
\I84V
0.70±0.06 0.63±0.15 5.42±2.11 0.13±0.06 7.56±2.44 0.53±0.15 0.25±0.01 0.56±0.05
G48V\I54V \V82A
4.12±1.90 0.62±0.07 68.14±1.45 0.28±0.14 12.72±1.86 0.56±0.01 8.07±2.54 0.40±0.07
WT# 1.00 0.00 1.00 0.00 1.00 0.00 1.00 0.00
*Values are expressed as means±standard deviations of three independent experiments.
#WT indicates the wild-type HIVNL4-3, as a control.
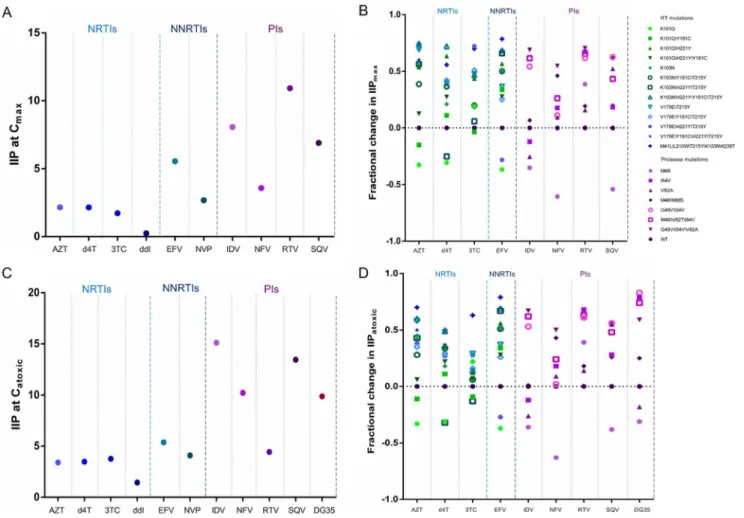
were used for the calculations, with the results shown as IIP at Cmax.Fig 4A and 4Bshow the IIPmaxvalues of the approved drugs against various viruses. The values for NNRTIs and PIs were greater than those for NRTIs. Due to the lack of clinical data, we could not calculate the IIPmaxvalues for novel drugs. In our pre-clinical evaluation, the maximum nontoxic concentra-tion of each drug was represented as D, and the values were shown as IIPatoxic. Both the toxicity and activity of an inhibitor were taken into consideration.Fig 4C and 4Dshow the IIPatoxic val-ues of the approved drugs and a novel, pre-clinical agent against various viruses. Similar to findings for IIPmax, the IIPatoxicvalues of NNRTIs and PIs exceeded those of NRTIs. Specially, the novel PI DG35 exhibited satisfactory activity against both wild-type and drug resistant viruses.
The relationship between fold changes in IC50 and fractional changes in
IIP
A lack of correlation was observed between fold changes in IC50 and fractional changes in
IIP-maxfor EFV and PIs (p>0.05 each). Using fractional change in IIPmaxaccounted for the effects of change in slope. Furthermore, fold changes in IC50 did not correlate with fractional changes
Fig 4. Effect of various viruses on (A, B) IIPmaxand (C, D) IIPatoxictoward (A, C) HIVNL4-3and (B, D) mutant viruses.IIP was calculated using equation (1), with the concentrations used being peak plasma concentrations for IIPmaxand the maximum nontoxic concentration for IIPatoxic. Fractional changes in IIP were calculated using equation (3). The drugs tested are grouped by class: NRTIs, NNRTI, and PIs. Within each class, different shapes indicate the various mutants.
in IIPatoxicfor any of the drugs tested (p>0.05 each), suggesting that IIPatoxiccan reflect the effects of change in slope. There were strong correlations (r>0.95 each) between fractional changes in IIPmaxand those in IIPatoxic(p<0.001 each) for all drugs tested.
Discussion
A problem with using IC50 as an indicator of antiviral activity is that it obscures differences in antiviral activity at higher drug concentrations. The slope of the dose-response curve, however, provides a better indication of antiviral activity at high drug concentrations. Slopes can distin-guish antiretroviral drugs from different classes with the same IC50 and are intrinsically drug class-specific [11–15]. Thus, slope is an important determinant of antiviral activity. This study showed that the IC50 values varied widely, and that the slopes of most NNRTIs and PIs were higher than those of most NRTIs, in agreement with previous studies [11–15]. This is likely to explain the satisfactory clinical utility of these two classes of antiretroviral drugs, with the most effective combination regimens including an NNRTI or a PI [23]. Currently, the PI monother-apy has been proposed and been undergoing evaluation [24]. The higher slope of PIs may be attributed to the cooperative binding of multiple ligands to a multivalent receptor [22].
Many studies have reported that longer cumulative exposure to HAART correlates with higher rates of HIV resistance in China [25–27]. The wide coverage of HAART has led to com-plex mutation patterns becoming a serious problem. Currently, HIV-1 mutation comcom-plexes have been the most frequent patterns in treating HIV-infected individuals. To illustrate the effect of anti-HIV-1 drug resistance mutations on IC50 and slope, we assessed the activity of 10 widely used drugs against 22 common HIV-1 resistance mutation complexes in China. All of the RT mutations we tested increased the IC50 for NRTIs but had relatively little effect on slope. By contrast, three of the seven PR mutations tested reduced the slope but increased the IC50 of PIs. Specially, our study also showed that there were mutations that affected the slope alone. For example, the findings indicated that the mutation V82A was not a primary mutation for SQV based on the parameter IC50. However, V82A reduced the slope of the dose-response curve, such that SQV activity was markedly reduced at concentrations above the IC50, an effect due to its molecular mechanism [28–30]. Under these conditions, the traditional single-param-eter (IC50) may underestimate the degree of resistance, leading to unsatisfactory outcomes in patients.
Taken together, our results revealed that resistance cannot be accurately assessed by IC50 alone, and that the effect of slope can be applied to more complex patterns of resistance. Fur-thermore, depending on drug class, there were intrinsic differences in the method by which resistance mutations affect drug parameters. The effects of mutants on slope were the most apparent when assessing the effects of mutants on PIs. The differences in the effects of the mutations on the parameters may be a consequence of the different mechanisms of drug inhi-bition. Mutations may lower enzyme efficiency, which affects the number of PR molecules needed to complete maturation. The exact mechanisms underlying the intrinsic differences in drug resistance are not yet fully understood and need further investigation.
For licensed drugs, the activity mainly depends on the intrinsic pharmacodynamic proper-ties (IC50 and slope) and the pharmacokinetic properproper-ties of each drugin vivo(the value of D over time) [13]. IIPmax, a parameter that takes into account the pharmacodynamic and phar-macokinetic properties of an individual drug, may be superior to traditional measures. D values
concentration of a drug based on its chemical structure. Thus, it is reasonable to calculate IIPatoxicon the basis of IC50, slope and the maximum limiting concentrations of promising pre-clinical inhibitors. Like fractional changes in IIPmaxhaving no relation with fold changes in IC50, we also observed a poor correlation between fractional changes in IIPatoxicand fold changes in IC50, suggesting that IIPatoxiccan account for the effects of changes in slope. Fur-thermore, strong correlations between fractional changes in IIPmaxand those in IIPatoxicfor all drugs tested were observed (r>0.95,p<0.001 each). Similar to their IIPmaxvalues, the IIPatoxicvalues of approved NNRTIs and PIs exceeded those of approved NRTIs. Using IIPatoxic values, we found that the novel PI (DG35) showed satisfactory performance against both wild-type and mutant viruses. The ability to calculate IIPatoxicin the absence of plasma concentra-tion suggests its potential use in screening for high-activity inhibitors from a large pool of potential candidates.
Conclusions
This study confirmed that resistance mutations cannot be accurately assessed by IC50 alone, because it tends to underestimate the degree of resistance. The slope parameter is of very importance in the measurement of drug resistance and the effect can be applied to more com-plex patterns of resistance. This was the most apparent when testing the effects of mutants on PI activity. We also added a new parameter, IIPatoxic, to IIP indices for novel, pre-clinical drugs. The new parameter incorporates both the IC50 and the slope, thereby enabling predict the effi-cacy of pre-clinical drugs for which human pharmacokinetic is not available.
Supporting Information
S1 Table. Fold changes in IC50 of various drugs for the protease inhibitors resistance muta-tions.
(XLSX)
S2 Table. Fractional changes in the slopes of the inhibition curves of various drugs for the protease inhibitors resistance mutations.
(XLSX)
Acknowledgments
We thank Dr. Lu for providing the cells and virus, and we thank Xi’an Hesi Scientific and Technology Ltd for providing the DG35.
Author Contributions
Conceived and designed the experiments: SC HS JL WZ. Performed the experiments: SC DZ WG LL. Analyzed the data: SC JL. Contributed reagents/materials/analysis tools: SL HL YL ZB JH. Wrote the paper: SC JL HS.
References
1. Montaner JSG, Lima VD, Barrios R, Yip B, Wood E, Kerr T, et al. Association of highly active antiretrovi-ral therapy coverage, population viantiretrovi-ral load, and yearly new HIV diagnoses in British Columbia, Canada: a population-based study. Lancet. 2010; 376(9740):532–9. doi:10.1016/S0140-6736(10)60936-1 ISI:000281266800032. PMID:20638713
3. Wei X, Ghosh SK, Taylor ME, Johnson VA, Emini EA, Deutsch P, et al. Viral dynamics in human immu-nodeficiency virus type 1 infection. Nature. 1995; 373(6510):117–22. PMID:7529365
4. Miller V, Phillips A, Rottmann C, Staszewski S, Pauwels R, Hertogs K, et al. Dual resistance to zidovu-dine and lamivuzidovu-dine in patients treated with zidovuzidovu-dine-lamivuzidovu-dine combination therapy: association with therapy failure. J Infect Dis. 1998; 177(6):1521–32. PMID:9607829
5. Deeks SG. Determinants of virological response to antiretroviral therapy: Implications for long-term strategies. Clinical Infectious Diseases. 2000; 30:S177–S84. doi:10.1086/313855
ISI:000088576100011. PMID:10860903
6. Clavel F, Hance AJ. HIV drug resistance. N Engl J Med. 2004; 350(10):1023–35. Epub 2004/03/05. doi:10.1056/NEJMra025195350/10/1023 [pii]. PMID:14999114.
7. Chun TW, Davey RT Jr., Engel D, Lane HC, Fauci AS. Re-emergence of HIV after stopping therapy. Nature. 1999; 401(6756):874–5. PMID:10553903
8. Harrigan PR, Whaley M, Montaner JSG. Rate of HIV-1 RNA rebound upon stopping antiretroviral ther-apy. Aids. 1999; 13(8):F59–F62. doi:10.1097/00002030-199905280-00001ISI:000080504300001. PMID:10371167
9. Petropoulos CJ, Parkin NT, Limoli KL, Lie YS, Wrin T, Huang W, et al. A novel phenotypic drug suscep-tibility assay for human immunodeficiency virus type 1. Antimicrob Agents Ch. 2000; 44(4):920–8. doi: 10.1128/Aac.44.4.920-928.2000ISI:000085997200019.
10. Japour AJ, Mayers DL, Johnson VA, Kuritzkes DR, Beckett LA, Arduino JM, et al. Standardized periph-eral blood mononuclear cell culture assay for determination of drug susceptibilities of clinical human immunodeficiency virus type 1 isolates. The RV-43 Study Group, the AIDS Clinical Trials Group Virol-ogy Committee Resistance Working Group. Antimicrob Agents Chemother. 1993; 37(5):1095–101. Epub 1993/05/01. PMID:8517697; PubMed Central PMCID: PMC187907.
11. Shen L, Peterson S, Sedaghat AR, McMahon MA, Callender M, Zhang HL, et al. Dose-response curve slope sets class-specific limits on inhibitory potential of anti-HIV drugs. Nat Med. 2008; 14(7):762–6. doi:10.1038/nm1777ISI:000257452700024. PMID:18552857
12. Shen L, Siliciano RF. Viral reservoirs, residual viremia, and the potential of highly active antiretroviral therapy to eradicate HIV infection. The Journal of allergy and clinical immunology. 2008; 122(1):22–8. Epub 2008/07/08. doi:10.1016/j.jaci.2008.05.033PMID:18602567.
13. Shen L, Rabi SA, Siliciano RF. A novel method for determining the inhibitory potential of anti-HIV drugs. Trends Pharmacol Sci. 2009; 30(12):610–6. Epub 2009/10/20. doi:10.1016/j.tips.2009.09.003PMID: 19837466; PubMed Central PMCID: PMCPmc3385974.
14. Jilek BL, Zarr M, Sampah ME, Rabi SA, Bullen CK, Lai J, et al. A quantitative basis for antiretroviral ther-apy for HIV-1 infection. Nat Med. 2012; 18(3):446–U211. doi:10.1038/nm.2649ISI:000301264800048. PMID:22344296
15. Deng K, Zink MC, Clements JE, Siliciano RF. A quantitative measurement of antiviral activity of anti-human immunodeficiency virus type 1 drugs against simian immunodeficiency virus infection: dose-response curve slope strongly influences class-specific inhibitory potential. J Virol. 2012; 86 (20):11368–72. Epub 2012/08/10. doi:10.1128/jvi.01563-12PMID:22875968; PubMed Central PMCID: PMCPmc3457139.
16. Holford NH, Sheiner LB. Understanding the dose-effect relationship: clinical application of pharmacoki-netic-pharmacodynamic models. Clin Pharmacokinet. 1981; 6(6):429–53. Epub 1981/11/01. PMID: 7032803.
17. Sampah MES, Shen L, Jilek BL, Siliciano RF. Dose-response curve slope is a missing dimension in the analysis of HIV-1 drug resistance. P Natl Acad Sci USA. 2011; 108(18):7613–8. doi:10.1073/pnas. 1018360108ISI:000290203100066.
18. Harada S, Koyanagi Y, Yamamoto N. Infection of HTLV-III/LAV in HTLV-I-carrying cells 2 and MT-4 and application in a plaque assay. Science. 1985; 229(MT-4713):563–6. Epub 1985/08/09. PMID: 2992081.
19. Graham FL, Smiley J, Russell WC, Nairn R. Characteristics of a human cell line transformed by DNA from human adenovirus type 5. The Journal of general virology. 1977; 36(1):59–74. Epub 1977/07/01. doi:10.1099/0022-1317-36-1-59PMID:886304.
20. Wei X, Decker JM, Liu H, Zhang Z, Arani RB, Kilby JM, et al. Emergence of resistant human immunode-ficiency virus type 1 in patients receiving fusion inhibitor (T-20) monotherapy. Antimicrob Agents Che-mother. 2002; 46(6):1896–905. PMID:12019106
21. Hill AV. The Possible Effects of the Aggregation of the Molecules of Hemoglobin on its Dissociation Curves. Physiology. 1909; 40(supplement).
(91):91ra63. Epub 2011/07/15. doi:10.1126/scitranslmed.3002304PMID:21753122; PubMed Central PMCID: PMCPmc3488347.
23. Gunthard HF, Aberg JA, Eron JJ, Hoy JF, Telenti A, Benson CA, et al. Antiretroviral treatment of adult HIV infection: 2014 recommendations of the International Antiviral Society-USA Panel. Jama. 2014; 312(4):410–25. Epub 2014/07/20. doi:10.1001/jama.2014.8722PMID:25038359.
24. Calza L, Manfredi R. Protease inhibitor monotherapy as maintenance regimen in patients with HIV infection. Curr HIV Res. 2012; 10(8):661–72. Epub 2012/09/29. PMID:23016538.
25. Zhang M, Han XX, Cui WG, Jia MH, Meng XD, Xing AH, et al. The impacts of current antiretroviral ther-apy regimens on Chinese AIDS patients and their implications for HIV-1 drug resistance mutation. Jap-anese journal of infectious diseases. 2008; 61(5):361–5. Epub 2008/09/23. PMID:18806342.
26. Xing H, Ruan Y, Li J, Shang H, Zhong P, Wang X, et al. HIV drug resistance and its impact on antiretro-viral therapy in Chinese HIV-infected patients. PLoS One. 2013; 8(2):e54917. Epub 2013/02/14. doi: 10.1371/journal.pone.0054917PMID:23405098; PubMed Central PMCID: PMCPmc3566114. 27. Liu H, Ma Y, Su Y, Smith MK, Liu Y, Jin Y, et al. Emerging trends of HIV drug resistance in Chinese
HIV-infected patients receiving first-line highly active antiretroviral therapy: a systematic review and meta-analysis. Clin Infect Dis. 2014; 59(10):1495–502. Epub 2014/07/24. doi:10.1093/cid/ciu590 PMID:25053721; PubMed Central PMCID: PMCPmc4565655.
28. Tzoupis H, Leonis G, Avramopoulos A, Mavromoustakos T, Papadopoulos MG. Systematic molecular dynamics, MM-PBSA, and ab initio approaches to the saquinavir resistance mechanism in HIV-1 PR due to 11 double and multiple mutations. The journal of physical chemistry B. 2014; 118(32):9538–52. Epub 2014/07/19. doi:10.1021/jp502687qPMID:25036111.
29. Ahmed SM, Maguire GE, Kruger HG, Govender T. The impact of active site mutations of South African HIV PR on drug resistance: Insight from molecular dynamics simulations, binding free energy and per-residue footprints. Chem Biol Drug Des. 2014; 83(4):472–81. Epub 2013/11/26. doi:10.1111/cbdd. 12262PMID:24267738.