Submitted7 January 2016 Accepted 21 February 2016 Published10 March 2016
Corresponding author Evon R. Hekkala, [email protected]
Academic editor James Reimer
Additional Information and Declarations can be found on page 14
DOI10.7717/peerj.1793
Copyright 2016 Aplasca et al.
Distributed under
Creative Commons CC-BY 4.0
OPEN ACCESS
Genetic diversity and structure in the
Endangered Allen Cays Rock Iguana,
Cyclura cychlura inornata
Andrea C. Aplasca1,4, John B. Iverson2, Mark E. Welch3, Giuliano Colosimo3
and Evon R. Hekkala1
1Department of Biological Sciences, Fordham University, New York, NY, United States 2Department of Biology, Earlham College, Richmond, IN, United States
3Department of Biological Sciences, Mississippi State University, Mississippi, MS, United States 4Current affiliation: College of Veterinary Medicine, Cornell University, Ithaca, NY, United States
ABSTRACT
The Endangered Allen Cays Rock Iguana (Cyclura cychlura inornata) is endemic to the Allen Cays, a tiny cluster of islands in the Bahamas. Naturally occurring populations exist on only two cays (<4 ha each). However, populations of unknown origin were recently discovered on four additional cays. To investigate patterns of genetic variation among these populations, we analyzed nuclear and mitochondrial markers for 268 individuals. Analysis of three mitochondrial gene regions (2,328 bp) and data for eight nuclear microsatellite loci indicated low genetic diversity overall. Estimates of effective population sizes based on multilocus genotypes were also extremely low. Despite low diversity, significant population structuring and variation in genetic diversity measures were detected among cays. Genetic data confirm the source population for an experimentally translocated population while raising concerns regarding other, unauthorized, translocations. Reduced heterozygosity is consistent with a documented historical population decline due to overharvest. This study provides the first range-wide genetic analysis of this subspecies. We suggest strategies to maximize genetic diversity during ongoing recovery including additional translocations to establish assurance populations and additional protective measures for the two remaining natural populations.
SubjectsBiodiversity, Conservation Biology, Genetics
Keywords Allen cays rock iguana, Island conservation, Reintroduction, Genetic structure
INTRODUCTION
Invasive species, anthropogenically mediated sea level rise and stochastic natural events such as hurricanes disproportionately affect island populations (Spiller, Losos & Schoener, 1998;Schoener, Spiller & Losos, 2004). Insular species are less likely to recover from such events due to the demographic and genetic attributes of naturally small populations. In particular, reduced effective population size and genetic diversity may constrain the ability of small, isolated populations to recover after such impacts.
the Conservation of Nature (Alberts, 2000;Knapp & Pagni, 2011).Cycluraspp. are these islands’ largest native extant vertebrates and perform a key ecosystem role as herbivores and seed dispersers (Iverson, 1985). However, loss of habitat, introduced mammals, harvesting by humans for food, and poaching for the pet trade have severely impacted populations (Alberts, 2000). Additional threats are posed by climate-related sea level rise and an increase in stochastic weather events. These factors can radically reduce population numbers in a short period of time, potentially leading to an ‘‘Extinction Vortex,’’ wherein extrinsic factors contribute to small population size, at which point intrinsic factors such as inbreeding further reduce individual fitness (Caughley, 1994;Frankham, 1998;Brook, Sodhi & Bradshaw, 2008). Hence, measures of genetic diversity and inbreeding can reveal whether a population may be particularly vulnerable to local extirpation (Frankham, 2005).
Within the Bahamas archipelago, the Allen Cays Rock Iguana (Cyclura cychlura inornata), currently classified as Endangered by the IUCN (Alberts, 2000;Blair & West Indian Iguana Specialist Group, 2000), is one of three subspecies ofCyclura cychlurathat also includes the Andros Island Rock Iguana (C. c. cychlura) and the Exuma Island Rock Iguana (C. c. figginsi).Cyclura c. inornata was believed extinct due to human harvest when it was originally described (Barbour & Noble, 1916). However, the subspecies was rediscovered, and is known from the Allen Cays, a few small islands in the northern Exuma Island chain of the Central Bahamas (Schwartz & Carey, 1977). For the past 35 years,C. c. inornatahas been actively studied and population density is quite high on some islands (Iverson et al., 2006). It has been the subject of active management, including translocation, in an effort to establish an assurance colony in the nearby protected Exuma Cays Land and Sea Park (Knapp, 2001). Recently, human activities have again impacted populations of Allen Cays Rock Iguana (Smith & Iverson, 2006;Smith & Iverson, in press;Knapp et al., 2013); however, the magnitude of the effects on iguanas of natural disturbances, such as hurricanes, and periodic drought has not been studied.
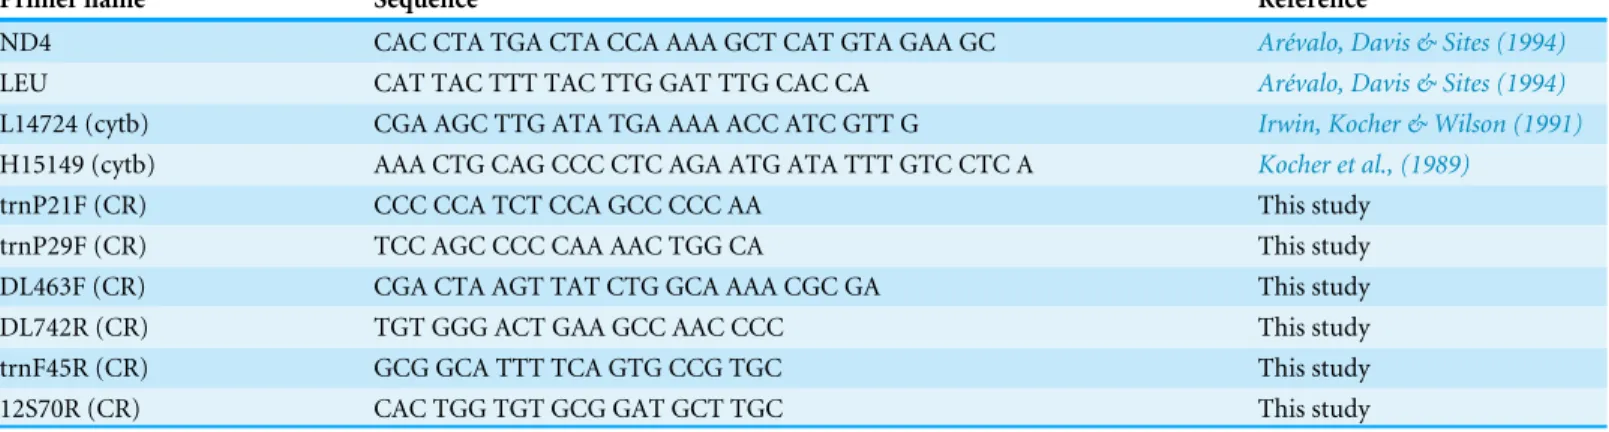
Table 1 Primer pairs used to sequence three separate mitochondrial DNA regions (ND4-LEU, cytochrome b (cytB), and Control Region (CR)) for Allen Cays Rock Iguana.
Primer name Sequence Reference
ND4 CAC CTA TGA CTA CCA AAA GCT CAT GTA GAA GC Arévalo, Davis & Sites (1994)
LEU CAT TAC TTT TAC TTG GAT TTG CAC CA Arévalo, Davis & Sites (1994)
L14724 (cytb) CGA AGC TTG ATA TGA AAA ACC ATC GTT G Irwin, Kocher & Wilson (1991)
H15149 (cytb) AAA CTG CAG CCC CTC AGA ATG ATA TTT GTC CTC A Kocher et al., (1989)
trnP21F (CR) CCC CCA TCT CCA GCC CCC AA This study
trnP29F (CR) TCC AGC CCC CAA AAC TGG CA This study
DL463F (CR) CGA CTA AGT TAT CTG GCA AAA CGC GA This study
DL742R (CR) TGT GGG ACT GAA GCC AAC CCC This study
trnF45R (CR) GCG GCA TTT TCA GTG CCG TGC This study
12S70R (CR) CAC TGG TGT GCG GAT GCT TGC This study
breakdown of natural iguana behavior (habitat use, and food preferences), and altered blood chemistry, in the Allen Cays Iguana (Iverson et al., 2006;Hines, 2011;Knapp et al., 2013).
Here, we examine patterns of genetic diversity and structuring among these small, insular populations of the Allen Cays Iguana (C. c. inornata) to better inform conservation management planning for the northern Exumas. Specifically, we (1) assess genetic related-ness among populations; (2) identify the likely origins of recently discovered translocated populations; and (3) evaluate the potential for natural dispersal, and translocation to aid in population persistence and resilience in the face of increasing anthropogenic impacts. The current study investigated twelve DNA microsatellite loci and three mitochondrial DNA regions to examine genetic diversity inC. c. inornataacross the known (natural and translocated) distribution of the subspecies in the Exuma Islands (Iverson & Mamula, 1989;
Iverson, Hines & Valiulis, 2004;Smith & Iverson, 2006;Iverson et al., 2006).
METHODS
Sample collection and estimation of population size
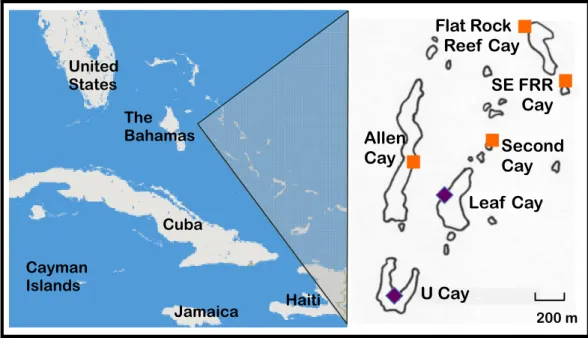
The Allen Cays are a small group of islands located in the northern Exuma island chain in the Bahamas (Fig. 1,Schwartz & Carey, 1977). Most iguanas (>85%) in the Allen Cays are now uniquely identifiable by a combination of toe clips and passive integrated transponder (PIT) tags due to an ongoing field study that was initiated in 1980. Samples were collected and processed under permits from the Bahamas National Trust, the Bahamas Environment Science and Technology (BEST) Commission, the Exuma Cays Land and Sea Park, and the Bahamas Department of Agriculture.
Figure 1 Naturally occurring populations of the Allen Cays Rock Iguana (Cyclura cychlura inornata) are found on two cays in the Northern Bahamas, Leaf and U Cay, marked by the symbol, . Islands with recently documented iguanas (Allen, Flat Rock Reef, Southeast Flat Rock Reef, and Second Cay) are marked by the symbol, . The experimentally translocated population on Alligator Cay located far-ther south in the Exuma Island Chain of the Bahamas is not shown. (Adapted fromHines, 2011; Iver-son, Hines & Valiulis, 2004.)
We marked unidentified iguanas with a unique combination of toe clips, and toe clip samples were stored in 85% ethanol at ambient temperatures. Approximately 50% of subadults and adults from Leaf and U Cays are captured each year, and recapture rates of marked animals vary between 85% and 90%. Hence our population size estimates are quite reliable (see alsoIverson et al., 2006).
Laboratory methods
We extracted genomic DNA from blood and tissue using Qiagen DNeasy Blood and Tissue Kits (Qiagen, Inc., Valencia, CA, USA) and an Applied Biosystems 6,100 Nucleic Acid PrepStation (Applied Biosystems, Carlsbad, CA, USA) following manufacturer’s instructions. Final elutions of DNA were stored at−20◦C.
We sequenced 95 of the 285 individuals sampled for three mitochondrial loci (NADH-4, CytB, and Control Region). These 95 individuals included representatives from all sampling sites (Table 1) to assess mtDNA variation among islands. We sequenced a portion of the NADH-4 (903 bp), and CytB (425 bp) loci using published primers (Arévalo, Davis & Sites, 1994;Irwin, Kocher & Wilson, 1991). We designed additional primers to target 1,000 bp of the control region (Table 2). We amplified target regions using Illustra Ready-To-Go PCR beads (GE Healthcare, Pittsburgh, PA, USA). Total reaction volumes were 25.5µL
including∼15 ng of template DNA with forward and reverse primer concentrations of 10 pmol each. Thermal cycler conditions included a 2 min initial denaturation at 96◦C, 35
cycles of 96◦C for 30 s, 50◦C for 30 s and 72◦C for 1 min, and a final extension at 72◦C
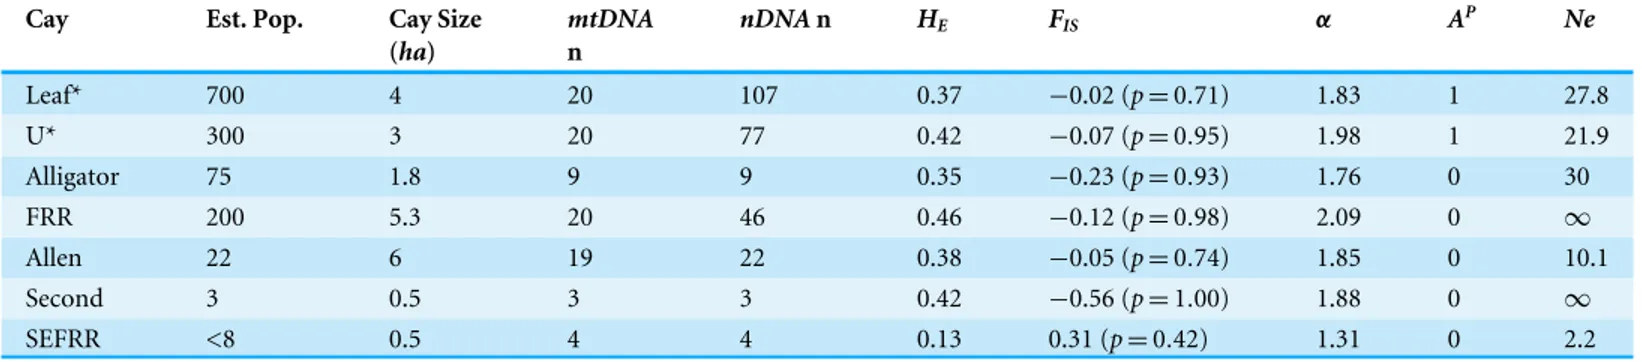
Table 2 Estimated census population sizes (N), island sizes (ha), expected heterozygosity (HE), inbreeding coefficients (FIS), Allelic richness
(α), number of private alleles (AP), and effective population sizes (Ne) based on eight polymorphic microsatellite loci for known Cays support-ing the Allen Cays Rock Iguana (Cyclura cychlura inornata)in the Exuma Islands, the Bahamas.Leaf and U Cays (*) are presumed natural popu-lations.
Cay Est. Pop. Cay Size
(ha)
mtDNA n
nDNAn HE FIS α AP Ne
Leaf* 700 4 20 107 0.37 −0.02 (p=0.71) 1.83 1 27.8
U* 300 3 20 77 0.42 −0.07 (p=0.95) 1.98 1 21.9
Alligator 75 1.8 9 9 0.35 −0.23 (p=0.93) 1.76 0 30
FRR 200 5.3 20 46 0.46 −0.12 (p=0.98) 2.09 0 ∞
Allen 22 6 19 22 0.38 −0.05 (p=0.74) 1.85 0 10.1
Second 3 0.5 3 3 0.42 −0.56 (p=1.00) 1.88 0 ∞
SEFRR <8 0.5 4 4 0.13 0.31 (p=0.42) 1.31 0 2.2
PCR products were cleaned using AMPure magnetic beads (Agencourt, Beverly, MA, USA), and cycle-sequenced using BigDye Terminator v 3.1 Kit (Applied Biosystems, Carlsbad, CA, USA). Sequencing products were purified using CleanSeq (Agencourt, Beverly, MA, USA) and run on an ABI 3730xl DNA Analyzer (Applied Biosystems, Carlsbad, CA, USA). We aligned and edited sequences using Sequencher 5.0 (Gene Codes Corporation, Ann Arbor, MI, USA).
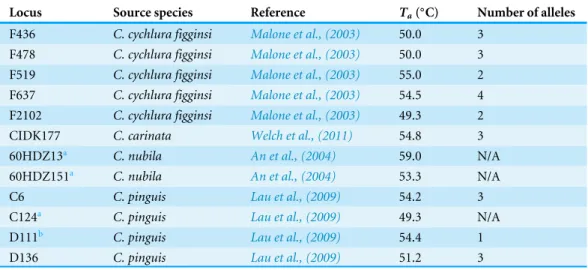
We attempted to genotype all 285 individuals at 12 microsatellite loci (Table 3) previously developed for other taxa in the genusCyclura(Malone et al., 2003;Lau et al., 2009;Welch et al., 2011). These 12 loci were scored using standard PCR based methods, and were selected because they were found to be polymorphic inCyclura cychlura cychlura(Colosimo et al., 2014). PCR amplification was performed in a 13.75 µl total volume containing 10 ng
of template DNA, 5 pmol of fluorescently-labeled forward primer, 5 pmol of unlabeled reverse primer, and 0.3 U AmpliTaqR Gold (Applied Biosystems, Carlsbad, CA, USA). Thermal cycling conditions were as follows: 5 min initial denaturation at 96◦C, 35 cycles
of 94◦C for 30 s,Ta◦C (primer specific) for 30 s 72◦C for 30 s, and a final extension at
72◦C for 10 min.
Amplified products were visualized on a 1% agarose gel using GelRedTM (Biotium, Inc., Hayward, CA, USA) and microsatellite genotyping was performed using an ABI 3100 DNA Analyzer with GeneScanTM500 LIZR size standard. Alleles were identified using GeneMarkerR (SoftGenetics, State College, PA, USA).
Data analysis
Table 3 Twelve microsatellite loci developed forCycluraspp. that were screened for polymorphism in Cyclura cychlura inornatausing the specified annealing temperatures (Ta).
Locus Source species Reference Ta(◦C) Number of alleles
F436 C. cychlura figginsi Malone et al., (2003) 50.0 3 F478 C. cychlura figginsi Malone et al., (2003) 50.0 3 F519 C. cychlura figginsi Malone et al., (2003) 55.0 2 F637 C. cychlura figginsi Malone et al., (2003) 54.5 4
F2102 C. cychlura figginsi Malone et al., (2003) 49.3 2
CIDK177 C. carinata Welch et al., (2011) 54.8 3
60HDZ13a C. nubila An et al., (2004) 59.0 N/A
60HDZ151a C. nubila An et al., (2004) 53.3 N/A
C6 C. pinguis Lau et al., (2009) 54.2 3 C124a C. pinguis Lau et al., (2009) 49.3 N/A
D111b C. pinguis Lau et al., (2009) 54.4 1
D136 C. pinguis Lau et al., (2009) 51.2 3
Notes.
aPoor amplification bMonomorphic
with a random stepwise-addition maximum parsimony tree, followed by 1,000 bootstrap replicates (Felsenstein, 1985).
Genetic diversity measures, including allelic richness (α), Hardy-Weinberg Equilibrium (HWE), tests of linkage disequilibrium, F-statistics based onWeir & Cockerham (1984), expected heterozygosity (HE), and observed heterozygosity (HO), were calculated using
the program GENEPOP v. 4.1 (Raymond & Rousset, 1995;Rousset, 2008). Markov Chain Monte Carlo (MCMC) parameters for GENEPOP calculations were 10,000 iterations and 1,000 batches. Allelic richness (α) corrected for unequal sample sizes was calculated using the rarefaction method (Hurlbert, 1971;El Mousadik & Petit, 1996;Leberge, 2002) with the program FSTAT v. 2.9.3.2 (Goudet, 1995). Correlations between population size (N) and genetic diversity measures (α,HE,HO,Ne), as well as between island size and genetic
diversity measures (α,HE,HO) (Frankham 1996) were computed using IBM SPSS Statistics
(IBM, Somers, NY, USA). One-tailed tests for significance were determined atα=0.05 (Frankham 1996). The relationship between geographic distance and genetic distance (FST) was tested for significance with a Mantel test using the Isolation by Distance Web
Service (Jensen, Bohonak & Kelley, 2005). Geographic distance was measured as the shortest distance between island pairs and log transformed according toRousset (1997).
To estimate contemporaryNein sampled cays we usedNe-Estimator(Do et al., 2014).
The software takes advantage of a single-time sampling event, multi-locus genotypes, and three different algorithms to estimate the parameter: the Linkage Disequilibrium, or LD method (Waples & Do, 2008); the Heterozygous Excess, or Hetexmethod (Pudovkin, Zaykin
& Hedgecock, 1996;Pudovkin, Zhdanova & Hedgecock, 2010;Zhdanova & Pudovkin, 2008); and the Coancestry method (Nomura, 2008). The LD method is based on the Burrow’s1
coefficients were then used to estimatesNevalues (Waples & Do, 2008). The Hetexis based on the excess heterozygous offspring expected from the mating between parents with differences in allele frequencies (Pudovkin, Zaykin & Hedgecock, 1996). The Coancestry method is based on the estimates of a molecular coancestry parameter. This estimate of the effective number of breeders is generated from the average probability that alleles at loci in two individuals at generationt are inherited from the same individual in generationt-1 (Nomura, 2008). When estimatingNeusing the LD and Hetexmethods, only alleles with frequencies greater than 0.05 were considered to prevent biases associated with low allele sample sizes.
Individuals were assigned to genetic clusters using the Bayesian clustering algorithm implemented in STRUCTURE v. 2.3.4 (Pritchard, Stephens & Donnelly, 2000;Hubisz et al., 2009). Using an admixture model with no priors, a total of 106MCMC iterations were run, and the first 100,000 replicates were discarded as burn-in. Given that seven cays were sampled, we hypothesized 1≤K≤10 possible populations and performed 10 replicates of the MCMC run for eachKvalue. Allowing forK>7 increased our chances of discovering genetic structure within cays if it were to exist. The most likely number of clusters was estimated using the Evanno method, based on the second order of difference in likelihood function of K and implemented in the web tool STRUCTURE—HARVESTER (Evanno, Regnaut & Goudet, 2005).
RESULTS
We collected samples from a total of 285 individuals ofC. c. inornatafrom all known inhabited cays (Table 1). On Allen and Second Cays all known individuals had been captured and marked resulting in a unique opportunity to characterize complete genetic diversity for these localities. Despite small numbers of individuals for these sites, we included these data in genetic analyses based on the expected influence of complete sampling on estimates of allelic richness and other parameters when using a rarefaction approach (Leberge, 2002).
Extractions for 15 of 285 individuals (5%) did not produce high enough quality DNA for sequencing and genotyping and were excluded from further analyses. Removal of individuals of unknown locality and poor quality DNA left 268 individuals available for analysis. Our alignment of concatenated mitochondrial sequences for NADH-4, cytochrome b and the control region for the subsample ofC. c. inornata(n=95) resulted in a single haplotype (Genbank accession KM275472, KM275473 andKM275474). Phylogenetic analysis of our data with publishedCyclurasequences resulted in a combined C. c. inornataandC. c. figginsisubclade as inMalone et al. (2000).
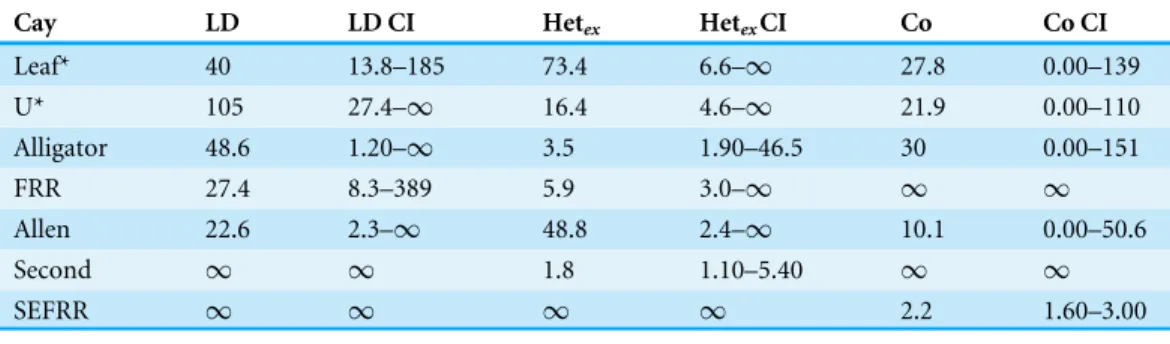
Table 4 Effective population size (NE) estimates for the two natural populations (*), and the five
translocated populations sampled. NEwas estimated using the Linkage Disequilibrium Method (LD),
the Heterozygous Excess method (Hetex), and the Coancestry method (Co). Confidence intervals (CI, 95%) on the three estimates are also provided.
Cay LD LD CI Hetex HetexCI Co Co CI
Leaf* 40 13.8–185 73.4 6.6–∞ 27.8 0.00–139
U* 105 27.4–∞ 16.4 4.6–∞ 21.9 0.00–110
Alligator 48.6 1.20–∞ 3.5 1.90–46.5 30 0.00–151
FRR 27.4 8.3–389 5.9 3.0–∞ ∞ ∞
Allen 22.6 2.3–∞ 48.8 2.4–∞ 10.1 0.00–50.6
Second ∞ ∞ 1.8 1.10–5.40 ∞ ∞
SEFRR ∞ ∞ ∞ ∞ 2.2 1.60–3.00
Table 5 PairwiseFST(Weir & Cockerham, 1984) values among sampled populations ofCyclura cy-chlura inornataspanning their current range in the Bahamas (GENEPOP v 4.1;Raymond & Rousset, 1995;Rousset, 2008).
Cay Leaf U Alligator FRR Allen Second
U 0.163
Alligator 0.050 0.224
FRR 0.121 0.016 0.177
Allen 0.007 0.177 0.063 0.134
Second 0.101 0.264 0.172 0.198 0.076
SEFRR 0.156 0.298 0.228 0.276 0.183 0.426
In total, 23 distinct alleles were detected across eight polymorphic microsatellite loci and allelic richness (α) ranged from 1.76 to 2.09 (Table 1). Across all localities examined, no significant deviations from Hardy-Weinberg Equilibrium were detected. However, estimates of FIS were negative for all islands except the small, all-female sample from
Southeast Flat Rock Reef (SEFRR) Cay. Among islands, expected heterozygosity (HE)
ranged from 0.13 to 0.46, and observed heterozygosity (HO) ranged from 0.09 to 0.58. The
population from SEFRR Cay exhibited both the lowestHE andHO. When this site was
excluded, the ranges ofHE andHOwere 0.35–0.46 and 0.38–0.58, respectively. Effective
population sizes were low relative to estimated census sizes. In the two presumed natural populations, parametric estimates ranged from 16.4 to 105, and 95% confidence intervals had variable if not infinite ranges (Table 4). Estimates ofNEfor the translocated populations
were also considered. However, sample sizes were typically low, and assumptions of these methods were not likely met given the uncertain demographic history of these populations.
Pairwise FST values ranged from 0.01 to 0.30 with a mean of 0.17 (Table 5). The
population on U Cay exhibitedFST values greater than 0.15 with all other populations
except Flat Rock Reef Cay (Fig. 1). The population on Leaf Cay exhibitedFSTvalues greater
than 0.15 with populations on U and SEFRR Cays andFST values less than 0.15 with the
other populations.
The correlations between population size and genetic diversity measures (α,HE,HO)
Figure 2 (A) Correlations to assess the relationship between Allen Cays Rock Iguana population size (N) and genetic diversity measures (allelic richness, expected heterozygosity (HE), observed
heterozy-gosity (HO)) (alpha level=0.05,n=7). (B) Correlations between island area and allelic richness as well as island area and expected heterozygosity (alpha=0.05).
between island area withα(p=0.06) andHE (p=0.093) were both positive. According to
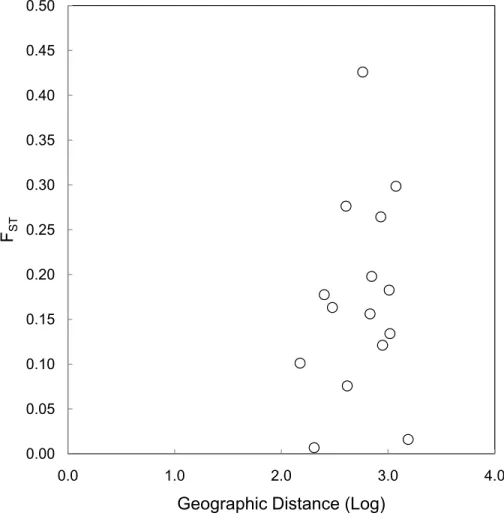
the Mantel test (Fig. 3), the relationship between geographic distance and genetic distance was not significant (p=0.33). Prior to the test, Alligator Cay was removed from this analysis due to its history as a confirmed human-introduced population.
Figure 3 Mantel test for a correlation between geographic distance and genetic distance (FST) for Allen Cays Rock Iguana (p=0.33,r=0.19).
DISCUSSION
Combined analysis of mitochondrial DNA and nuclear DNA microsatellite markers revealed low levels of genetic variation withinC. c. inornata. This contrasts with several other recent analyses, including that byAn et al. (2004)who screened 20 microsatellite loci in Cyclura nubilaand found a greater range in number of alleles per locus, and
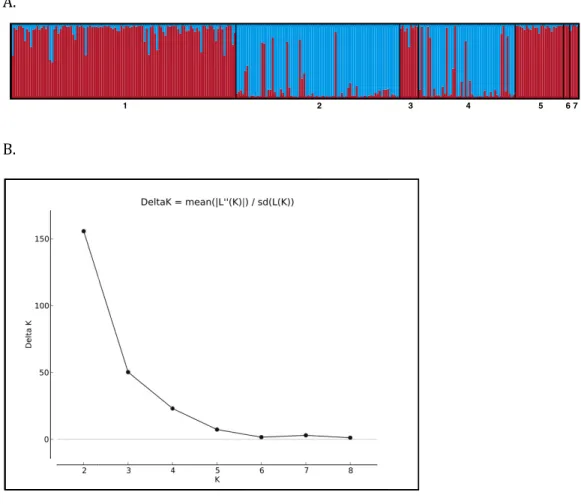
Figure 4 (A) STRUCTURE barplot (k=2) using 8 microsatellite loci for the Allen Cays Rock Iguana (Cyclura cychlura inornata). 1=Leaf, 2=U, 3=Alligator, 4=Flat Rock Reef, 5=Allen, 6=Second, 7=SE Flat Rock Reef. Alligator Cay (3) is an experimentally translocated population from Leaf (1). (B) Delta K values forK=1–9 indicating highest likelihood atK=2.
Island Rock Iguanas (C. c. figginsi; 1.63–2.75) in the southern region of the same island chain (Malone et al., 2003).
The reduced genetic diversity of the Allen Cays Rock Iguana is notable relative to other insular reptiles studied thus far. For example, genetic analysis of the Galápagos Land Iguana (Conolophus subcristatus) revealed allelic richness values of 5.55 and 4.78 for two separate island populations (Fabiani et al., 2011) after a severe reduction in population size due to harvest. The endemic New Zealand Tuatara (Sphenodonsp.) exhibited 84 unique alleles across six microsatellite loci and allelic richness ranged from 2.2 to 5.6 in 14 island populations (MacAvoy et al., 2007). Whitakers Skink (Cyclodina whitakeri) from insular New Zealand also exhibited relatively high diversity with 114 unique alleles across twelve microsatellite loci (Miller et al., 2009).
Observed heterozygosity in the Allen Cays Rock Iguana (0.38–0.58), excluding the small all-female population on Southeast Flat Rock Reef Cay, are comparable to those for Anegada Iguanas (0.27–0.88,Mitchell et al., 2011) and Galápagos Land Iguanas (0.38–0.67,
and genetic diversity in the Allen Cays Rock Iguana is consistent with expectations given the small population sizes, small island sizes, and marked range fragmentation (Frankham, 1997; Willi, Griffin & Van Buskirk, 2013). Further, many if not all of these populations are believed to have passed through one or more bottlenecks in their recent histories.
Leaf and U Cays host the only two populations ofC. c. inornatathought to be natural. The remaining five populations are likely the result of translocations. The two natural populations have significantly different allele frequencies (pairwise FST=0.16). This
suggests that these two populations have been isolated since rising sea-levels associated with the current interglacial partially inundated the Great Bahama Bank, a finding consistent with observations made regardingC. c. figginsi(Malone et al., 2003). If there is ongoing gene flow between these two Allen Cay populations it is clearly insufficient to prevent divergence between them.Colosimo et al. (2014)found that narrow water channels on Andros Island were sufficient to impede gene flow inC. c. cychlura. Hence, it is not surprising that we find evidence for divergence, and limited gene flow where Cays are separated by a fast flowing tidal channel that is more than 300 m wide. Further, iguanas have never been observed naturally dispersing among these islands during 35 years of fieldwork, nor are we aware of any anecdotal accounts by residents familiar with these islands (J Iverson, 2006–2016, unpublished data). However, our data suggest that unauthorized translocations of iguanas among some islands are highly likely (Smith & Iverson, 2006; J Iverson, 2006–2016, unpublished data). Populations on U Cay and Flat Rock Reef Cay have very similar allele frequencies (pairwiseFST=0.016), yet they are separated by the greatest
geographic distance, excluding Alligator Cay which is known to result from translocation. A Mantel test for geographic distance and FST excluding the Flat Rock Reef Cay
population illustrated a positive trend and implied a stronger correlation, but was not significant (p=0.10,r=0.60). Long-term capture records identifying the presence of individuals on Flat Rock Reef Cay that were previously marked on U Cay (most) or Leaf Cay (J Iverson, 2006–2016, unpublished data) are suggestive of such unauthorized translocations.
Although the genetic diversity of C. c. inornatawas relatively low compared to other studied Cycluraspecies, genetic structure was still evident among populations. Overall, Bayesian STRUCTURE analyses revealed that two unique genotypic clusters exist within the subspecies and mirrored patterns of genetic diversity described above (Fig. 4). The majority of individuals on Leaf and U Cay were assigned to unique clusters with high probability and likely provide the source of individuals for the surrounding cays. All the individuals on Alligator Cay were assigned to the same cluster as individuals on Leaf Cay, which is consistent with the fact that the Alligator Cay population was founded by individuals from Leaf Cay (Knapp, 2001). Moreover, the lowFST value between Alligator
and Leaf Cay (0.048) clearly reflects the recent (1988–1990) translocation event.
Small, discrete populations eventually experience inbreeding and loss of genetic variation (Frankham, 1995). Effective population size (NE), defined as the actual number of breeding
individuals in a population, is predicted to influence the rate at which this loss is expected to happen (Crow & Kimura, 1970). Hence, estimating a parameter such asNE is important
the two naturally occurring populations (Table 4). Bottlenecks and founder events could have resulted in this pattern. Because of the intensive mark-recapture work over the past 35 years, population size estimates for the natural populations are particularly robust (Iverson et al., 2006). ContrastingNE estimates inC. c. inornotawith these population size
estimates allowed us to predict the effects of the species’ population ecology on its capacity to maintain genetic variation. AlthoughNE is typically much lower than actual population
size, averaging three estimates of N:NE for both of the natural populations suggesting
that this ratio is extremely high (17.4 for Leaf Cay, and 11.6 for U Cay). Factors likely responsible for the high N:NE inC. c. inornatainclude largely overlapping generations, and
highly variable reproductive success. Further, the abundance of juveniles in the population likely influences N:NE because the age of maturity inC. c. inornatais 12 years, the longest
known for a lizard (Iverson, Hines & Valiulis, 2004).
Population size and habitat area have been positively linked to genetic variation and evolutionary potential (Frankham, 1996). Our results suggest a positive relationship between these parameters, although the correlations are not statistically significant. Low levels of genetic diversity, low variation in island size, and the confounding effects of historic and ongoing anthropogenic factors including translocations likely hinder our ability to detect such correlations (Van Treuren et al., 1993). In addition, the current phylogeny for the genus CycluraplacesC. cychlura as the most recently derived species (Malone et al., 2000;Starostová, Rehák & Frynta, 2010). During the last glacial maximum approximately 18,000 years ago, Andros Island and the Exuma Island chain were a single contiguous land mass, and only with a subsequent rise in sea level did the islands fragment to the degree they are today (Malone et al., 2003). Combined, these findings imply that the low genetic diversity associated with a young species may have been further attenuated by the reduction in population size resulting from rising sea levels. Similar analysis of mtDNA sequences revealed shallow divergence in Whitaker’s Skink (Cyclodina whitakeri), which also is endemic to islands once joined as a single landmass during the last glacial maximum (Chapple, Daugherty & Ritchie, 2008).
The low genetic diversity in the Allen Cays Rock Iguana could reflect geologic history, recent anthropogenic effects, or a combination, and these factors warrant additional investigation. In particular, the most dramatic impact on populations of the Allen Cays Rock Iguana may be sourced to the extreme overharvesting of the species at the beginning of the twentieth century. Barbour & Noble (1916)declared ‘‘the species [sic]inornata, which once doubtless existed on several islands about Allen’s Harbor, is now beyond doubt extinct. Since these creatures are excellent for food, they are constantly hunted. . . often with dogs trained for the purpose.’’
Conservation
Molecular data can augment data from ecological and behavioral research to benefit those managing wild populations. Our preliminary analyses of nuclear and mitochondrial markers inC. c inornatarevealed low levels of genetic diversity. However, small samples sizes for some populations and historical influences make interpretation of these results difficult. Biogeography and historical and current anthropogenic factors are all suspected to have contributed to observed patterns.
For future planning, it is important to recognize that high levels of natural inbreeding in this insular species in combination with anthropogenic and environmental stressors could send the species into an extinction vortex (Caughley, 1994;Brook, Sodhi & Bradshaw, 2008). Consistent with this interpretation are the number of other natural populations of C. cychlura between the current ranges ofinornataandfigginsiin the Exumas that have gone extinct (Schwartz & Carey, 1977).
The maintenance of genetic diversity is an important component of conservation planning. Expected increases in hurricane activity and sea level rise under projected climate change scenarios pose significant threats to the persistence ofC. c. inornata. Our evidence for genetically distinct natural populations on U Cay and Leaf Cay supports their treatment as separate management units. However, it appears that animals from Leaf Cay have already been translocated without authorization to U Cay, potentially compromising any genetic distinction of the latter population. Hence, additional translocations to historically occupied sites may still be warranted in order to maximize the preservation of remaining genetic diversity. In addition, these sites could provide beneficial assurance populations in the event of stochastic extirpations.
ACKNOWLEDGEMENTS
The authors would like to thank the editors and three reviewers for comments which greatly improved the manuscript. We thank Seven C’s Charters which provided transportation and housing.
ADDITIONAL INFORMATION AND DECLARATIONS
Funding
Grant Disclosures
The following grant information was disclosed by the authors: Zoo Atlanta.
International Iguana Foundation. Late Ned and Sally Test.
Cope Museum Fund of Earlham College. Hekkala Laboratory at Fordham University.
Sackler Institute for Comparative Genomics at the American Museum of Natural History. Fordham University Graduate School of Arts and Sciences.
Graduate Student Association. Sigma Xi Grants-in-Aid of Research. Laboratory of JI.
Mohamed bin Zayed species Conservation Fund: 11253150.
Competing Interests
The authors declare there are no competing interests.
Author Contributions
• Andrea C. Aplasca conceived and designed the experiments, performed the experiments, analyzed the data, wrote the paper, prepared figures and/or tables, reviewed drafts of the paper.
• John B. Iverson conceived and designed the experiments, performed the experiments, analyzed the data, contributed reagents/materials/analysis tools, wrote the paper, prepared figures and/or tables, reviewed drafts of the paper.
• Mark E. Welch and Giuliano Colosimo performed the experiments, analyzed the data, contributed reagents/materials/analysis tools, wrote the paper, prepared figures and/or tables, reviewed drafts of the paper.
• Evon R. Hekkala conceived and designed the experiments, analyzed the data, contributed reagents/materials/analysis tools, wrote the paper, prepared figures and/or tables, reviewed drafts of the paper.
Animal Ethics
The following information was supplied relating to ethical approvals (i.e., approving body and any reference numbers):
Samples were collected and processed under an IACUC to JI from the Animal Care and Use Committee of Earlham College.
Field Study Permissions
The following information was supplied relating to field study approvals (i.e., approving body and any reference numbers):
DNA Deposition
The following information was supplied regarding the deposition of DNA sequences: Genbank accession numbersKM275472,KM275473andKM275474.
Supplemental Information
Supplemental information for this article can be found online athttp://dx.doi.org/10.7717/ peerj.1793#supplemental-information.
REFERENCES
Alberts AC. 2000.West Indian iguanas: status survey and conservation action plan.
Switzerland: IUCN.
Alberts AC, Lemm JM, Perry AM, Morici LA, Phillips JA. 2002.Temporary alteration of
local social structure in a threatened population of Cuban Iguanas (Cyclura nubila). Behavioral Ecology and Sociobiology51:324–335 DOI 10.1007/s00265-001-0445-z.
An J, Sommer JA, Shore GD, Williamson JE, Brenneman RA, Louis EE. 2004.
Charac-terization of 20 microsatellite marker loci in the West Indian Rock Iguana (Cyclura nubila).Conservation Genetics5:121–125DOI 10.1023/B:COGE.0000014062.86556.e3.
Arévalo E, Davis SK, Sites Jr JW. 1994.Mitochondrial DNA sequence divergence
and phylogenetic relationships among eight chromosome races of theSceloporus grammicuscomplex (Phrynosomatidae) in central Mexico.Systematic Biology
43:387–418DOI 10.1093/sysbio/43.3.387.
Bahamas National Trust. 2013.Press release: native iguanas and shearwaters saved from
invasive mice on allen cay.Available athttp:// www.bnt.bs/ press-releases/ Native-Iguanas-and-Shearwaters-saved. Archived by WebCiteR athttp://www.webcitation. org/6WCddfOzD(accessed 8 February 2015).
Barbour T, Noble GK. 1916.A revision of the lizards of the genusCyclura.Bulletin of the
Museum of Comparative Zoology60:137–164.
Blair D, West Indian Iguana Specialist Group. 2000. Cyclura cychlurassp.inornata. In:
The IUCN red list of threatened species. Version 2015.2.Available atwww.iucnredlist. org (accessed 27 June 2015).
Brook BW, Sodhi NS, Bradshaw CJA. 2008.Synergies among extinction drivers under
global change.Trends in Ecology and Evolution23:453–460 DOI 10.1016/j.tree.2008.03.011.
Caughley G. 1994.Directions in conservation biology.Journal of Animal Ecology
63:215–244DOI 10.2307/5542.
Chapple DG, Daugherty CH, Ritchie PA. 2008.Comparative phylogeography
reveals pre-decline population structure of New ZealandCyclodina (Rep-tilia: Scincidae) species.Biological Journal of the Linnean Society 95:388–408 DOI 10.1111/j.1095-8312.2008.01062.x.
Colosimo G, Knapp CR, Wallace LE, Welch ME. 2014.Inferredvsrealized patterns of
Crow JF, Kimura M. 1970.An introduction to population genetics theory. New York: Harper and Row.
Do C, Waples RS, Peel D, Macbeth GM, Tillett BJ, Ovenden JR. 2014.NeEstimator
v2: Re-implementation of software for the estimation of contemporary effective population size (Ne) from genetic data.Molecular Ecology Resources14:209–214 DOI 10.1111/1755-0998.12157.
El Mousadik A, Petit R. 1996.High level of genetic differentiation for allelic richness
among populations of the Argan Tree [Arganiaspinosa(L.) Skeels] endemic to Morocco.Theoretical and Applied Genetics92:832–839DOI 10.1007/BF00221895.
Evanno G, Regnaut S, Goudet J. 2005.Detecting the number of clusters of
individ-uals using the software STRUCTURE: a simulation study.Molecular Ecology
14:2611–2620DOI 10.1111/j.1365-294X.2005.02553.x.
Fabiani A, Trucchi E, Rosa S, Marquez C, Snell HL, Snell HM, Tapia Aguilera W,
Gentile G. 2011.Conservation of Galápagos land iguanas: genetic monitoring and
predictions of a long-term program on the island of Santa Cruz.Animal Conservation
14:419–429DOI 10.1111/j.1469-1795.2011.00442.x.
Felsenstein J. 1985.Confidence limits on phylogenies: an approach using the bootstrap.
Evolution39:783–791.
Frankham R. 1995.Effective population size/adult population size ratios in wildlife: a
review.Genetical Research89:491–503.
Frankham R. 1997.Do island populations have lower genetic variation than mainland
populations?Heredity78:311–327.
Frankham R. 1998.Inbreeding and extinction: island populations.Conservation Biology
12:665–675DOI 10.1046/j.1523-1739.1998.96456.x.
Frankham R. 2005.Genetics and extinction.Biological Conservation126:131–140
DOI 10.1016/j.biocon.2005.05.002.
Gasc A, Duryea M, Cox RM, Kern A, Calsbeek R. 2010.Invasive predators deplete
genetic diversity of island lizards.PLoS ONE5:e12061 DOI 10.1371/journal.pone.0012061.
Gentile G, Fabiani A, Marquez C, Snell HL, Snell HM, Tapia W, Sbordoni V. 2009.
An overlooked pink species of land iguana in the Galápagos.Proceedings of the National Academy of Sciences of the United States of America106:507–511 DOI 10.1073/pnas.0806339106.
Goudet J. 1995.FSTAT (Version 1.2): a computer program to calculate F-statistics.
Journal of Heredity86:485–486.
Hayes WK, Carter RL, Cyril S, Thornton B. 2004. Conservation of an endangered
Bahamian rock iguana. I. Population assessments, habitat restoration, and behavioral ecology. In: Alberts AC, Carter RL, Hayes WK, Martins EP, eds.Iguanas: biology and conservation. Berkeley: University of California Press, 232–257.
Hayes WK, Iverson JB, Knapp CR, Carter RL. 2012.Do invasive rodents impact
Hines KN. 2011.Effects of ecotourism on endangered Northern Bahamian Rock Iguanas (Cyclura cychlura).Herpetological Conservation and Biology6:250–259.
Hubisz MJ, Falush D, Stephens M, Pritchard JK. 2009.Inferring weak population
structure with the assistance of sample group information.Molecular Ecology Resources9:1322–1332DOI 10.1111/j.1755-0998.2009.02591.x.
Hurlbert SH. 1971.The nonconcept of species diversity: a critique and alternative
parameters.Ecology52:577–586 DOI 10.2307/1934145.
Irwin DM, Kocher TD, Wilson AC. 1991.Evolution of the cytochrome b gene of
mammals.Journal of Molecular Evolution32:128–144DOI 10.1007/BF02515385.
Iverson JB. 1978.The impact of feral cats and dogs on populations of the West Indian
Rock Iguana,Cyclura carinata.Biological Conservation14:63–73 DOI 10.1016/0006-3207(78)90006-X.
Iverson JB. 1985.Lizards as seed dispersers?Journal of Herpetology19:292–293
DOI 10.2307/1564185.
Iverson JB, Converse SJ, Smith GR, Valiulis JM. 2006.Long-term trends in the
demography of the Allen Cays Rock Iguana (Cyclura cychlura inornata): human disturbance and density-dependent effects.Biological Conservation132:300–310 DOI 10.1016/j.biocon.2006.04.022.
Iverson JB, Hines KN, Valiulis JM. 2004.The nesting ecology of the Allen Cays Rock
Iguana,Cyclura cychlura inornatain the Bahamas.Herpetological Monographs
18:1–36DOI 10.1655/0733-1347(2004)018[0001:TNEOTA]2.0.CO;2.
Iverson JB, Mamula MR. 1989.Natural growth in the Bahaman iguanaCyclura cychlura.
Copeia1989:502–505DOI 10.2307/1445454.
ITWG. 2011.Iguanas of the world. version 2011.2.Available atwww.iucn-isg.org.
Jensen JL, Bohonak AJ, Kelley ST. 2005.Isolation by distance, web service.BMC Genetics
6:13.
Jones HP. 2010.Prognosis for ecosystem recovery following rodent eradication and
seabird restoration in an island archipelago.Ecological Applications20:1204–1216 DOI 10.1890/09-1172.1.
Knapp CR. 2001.Status of a translocatedCycluraiguana colony in the Bahamas.Journal
of Herpetology35:239–248DOI 10.2307/1566114.
Knapp CR, Hines KN, Zachariah T, Perez-Heydrich C, Iverson JB, Buckner SD,
Halach SC, Lattin CR, Romero LM. 2013.Physiological effects of tourism and
associated food provisioning in an endangered iguana.Conservation Physiology
1:1–12DOI 10.1093/conphys/cot032.
Knapp CR, Malone CL. 2003.Patterns of reproductive success and genetic variability in a
translocated iguana population.Herpetologica59:195–202 DOI 10.1655/0018-0831(2003)059[0195:PORSAG]2.0.CO;2.
Knapp C, Pagni L. 2011.Andros iguana: conservation action plan, 2005–2011. Gland:
IUCN/SSC Iguana Specialist Group.
Kocher TD, Thomas WK, Meyer A, Edwards SV, Pääbo S, Villablanca FX, Wilson AC.
sequencing with conserved primers.Proceedings of the National Academy of Sciences of the United States of America86:6196–6120DOI 10.1073/pnas.86.16.6196.
Lanave CG, Perparata C, Sacone G, Serio. 1984.A new method for calculating
evolutionary substitution rates.Journal of Molecular Evolution20:86–93 DOI 10.1007/BF02101990.
Lau J, Alberts AC, Chemnick LG, Gerber GP, Jones KC, Mitchell AA, Ryder OA. 2009.
Isolation and characterization of 23 polymorphic microsatellite loci for a West Indian Iguana (Cyclura pinguis) from the British Virgin Islands.Molecular Ecology Resources9:1412–1414DOI 10.1111/j.1755-0998.2009.02683.x.
Leberge P. 2002.Estimating allelic richness: effects of sample size and bottlenecks.
Molecular Ecology 11:2445–2449.
MacAvoy ES, McGibbon LM, Sainsbury JP, Lawrence H, Wilson CA, Daugherty CH,
Chambers GK. 2007.Genetic variation in island populations of tuatara (Sphenodon
spp) inferred from microsatellite markers.Conservation Genetics8:305–318 DOI 10.1007/s10592-006-9170-5.
Malone CL, Knapp CR, Taylor JF, Davis SK. 2003.Genetic consequences of Pleistocene
fragmentation: isolation, drift, and loss of diversity in rock iguanas (Cyclura). Conservation Genetics4:1–15DOI 10.1023/A:1021885323539.
Malone CL, Wheeler T, Taylor JF, Davis SK. 2000.Phylogeography of the Caribbean
rock iguana (Cyclura): implications for conservation and insights on the biogeo-graphic history of the West Indies.Molecular Phylogenetics and Evolution17:269–79 DOI 10.1006/mpev.2000.0836.
Miller K, Chapple D, Towns D, Ritchie P, Nelson N. 2009.Assessing genetic diversity for
conservation management: a case study of a threatened reptile.Animal Conservation
12:163–171DOI 10.1111/j.1469-1795.2009.00236.x.
Mitchell AA, Lau J, Chemnick LG, Thompson EA, Alberts AC, Ryder OA, Gerber GP.
2011.Using microsatellite diversity in wild Anegada Iguanas (Cyclura pinguis) to
establish relatedness in a captive breeding group of this critically endangered species. Conservation Genetics12:771–781DOI 10.1007/s10592-011-0184-2.
Nomura T. 2008.Estimation of effective number of breeders from molecular
coancestry of single cohort sample.Evolutionary Applications1:462–474 DOI 10.1111/j.1752-4571.2008.00015.x.
Pritchard JK, Stephens M, Donnelly P. 2000.Inference of population structure using
multilocus genotype data.Genetics155:945–959.
Pudovkin AI, Zaykin DV, Hedgecock D. 1996.On the potential for estimating the
effec-tive number of breeders from heterozygote-excess in progeny.Genetics144:383–387.
Pudovkin AI, Zhdanova OL, Hedgecock D. 2010.Sampling properties of the
heterozygote-excess estimator of the effective number of breeders.Conservation Genetics11:759–771DOI 10.1007/s10592-009-9865-5.
Raymond M, Rousset F. 1995.GENEPOP (version 1.2): population genetics software for
exact tests and ecumenicism.Journal of Heredity86:248–249.
Rousset F. 1997.Genetic differentiation and estimation of gene flow from F-statistics
Rousset F. 2008.GENEPOP’007: a complete re-implementation of the genepop software for Windows and Linux.Molecular Ecology Resources8:103–106 DOI 10.1111/j.1471-8286.2007.01931.x.
Schoener TW, Spiller DA, Losos JB. 2004.Variable ecological effects of hurricanes:
the importance of seasonal timing for survival of lizards on Bahamian islands. Proceedings of the National Academy of Sciences of the United States of America
101:177–181DOI 10.1073/pnas.0306887101.
Schwartz A, Carey M. 1977.Systematics and evolution in the West Indian iguanid genus
Cyclura.Studies on the Fauna of Curaçao and Other Caribbean Islands53.1:15–97.
Smith GR, Iverson JB. 2006.Changes in sex ratio over time in the endangered iguana
Cyclura cychlura inornata.Journal of Zoology 84:1522–1527.
Smith GR, Iverson JB. 2015.Effects of tourism on body size, growth, condition, and
demography in the Allen Cay Iguana,Cyclura cychlura inornata, on Leaf Cay, The Bahamas.Herpetological Conservation and BiologyIn Press.
Spiller DA, Losos JB, Schoener TW. 1998.Impact of a catastrophic hurricane on island
populations.Science281:695–697 DOI 10.1126/science.281.5377.695.
Stamatakis A. 2014.RAXML version 8: a tool for phylogenetic analysis and post-analysis
of large phylogeneies.Bioinformatics30:1312–1313 DOI 10.1093/bioinformatics/btu033.
Starostová Z, Rehák I, Frynta D. 2010.New haplotypes ofCyclura nubila nubilafrom
Cuba changed the phylogenetic tree of rock iguanas: a challenge for conservation strategies?Amphibia-Reptilia31:134–143DOI 10.1163/156853810790457795.
Tamura K, Stecher G, Peterson D, Filipski A, Kumar S. 2013.MEGA6: molecular
evolu-tionary genetics analysis version 6.0.Molecular Biology and Evolution30:2725–2729 DOI 10.1093/molbev/mst197.
Thompson JD, Higgins DG, Gibson TJ. 1994.CLUSTAL W: improving the sensitivity
of progressive multiple sequence alignment through sequence weighting, position-specific gap penalties and weight matrix choice.Nucleic Acids Research22:4673–4680.
Van Treuren R, Bijlsma R, Ouborg NJ, Van Delden W. 1993.The significance of genetic
erosion in the process of extinction. IV. Inbreeding depression and heterosis effects caused by selfing and outcrossing inScabiosa columbaria.Evolution47:1669–1680.
Waples RS, Do C. 2008.LDNE: a program for estimating effective population size
from data on linkage disequilibrium.Molecular Ecology Resources8:753–756 DOI 10.1111/j.1755-0998.2007.02061.x.
Weir BS, Cockerham CC. 1984.Estimating F-statistics for the analysis of population
structure.Evolution38:1358–1370DOI 10.2307/2408641.
Welch ME, Long GJ, Berk JW, Getz AH, Gerber GP, Wallace LE. 2011.Twenty- nine
polymorphic microsatellite loci inCyclura carinata, the Turks and Caicos Iguana, a critically endangered island endemic.Conservation Genetics Resources3:209–212 DOI 10.1007/s12686-010-9324-0.
Willi Y, Griffin P, Van Buskirk J. 2013.Drift load in populations of small size and low
Wright S. 1940.Breeding structure of populations in relation to speciation.The American Naturalist 74:232–248DOI 10.1086/280891.
Yang Z. 1994.Maximum likelihood phylogenetic estimation from DNA sequences
with variable rates over sites: approximate methods.Journal of Molecular Evolution
39:306–314DOI 10.1007/BF00160154.
Zhdanova OL, Pudovkin AI. 2008.Nb_HetEx: a program to estimate the effective