125
ANALYSIS OF PROJECTED FREQUENCY AND INTENSITY
CHANGES OF PRECIPITATION IN THE CARPATHIAN REGION
KIS ANNA, PONGRÁCZ RITA, BARTHOLY JUDIT 1
ABSTRACT. – Analysis of projected frequency and intensity changes of precipitation in the Carpathian region. Precipitation is the major atmospheric source
of surface water, thus, in order to build appropriate adaptation strategies for various economic sections related to water resources it is essential to provide projections for precipitation tendencies as exact as possible. Extreme precipitation events are especially important from this point of view since they may result in different environmental, economical, and/or even human health damages. Excessive precipitation for instance may induce floods, flash-floods, landslides, traffic accidents. On the other hand, lack of precipitation is not favorable either: long dry periods affect agricultural production quite negatively, and hence, food safety can be threatened. Several precipitation-related indices (i.e., describing drought or intensity, exceeding different percentile-based or absolute threshold values) are analyzed for the Carpathian region for 1961–2100. For this purpose 11 completed regional climate model simulations are used from the ENSEMBLES database. Before the thorough analysis, a percentile-based bias correction method was applied to the raw data, for which the homogenized daily gridded CarpatClim database (1961–2010) served as a reference. Absolute and relative seasonal mean changes of climate indices are calculated for two future time periods (2021–2050 and 2071–2100) and for three subregions within the entire Carpathian region, namely, for Slovakia, Hungary and Romania. According to our results, longer dry periods are estimated for the summer season, mainly in the southern parts of the domain, while precipitation intensity is likely to increase. Heavy precipitation days and high percentile values are projected to increase, especially, in winter and autumn.
Keywords: regional climate simulation, extreme precipitation, drought, climate index
1. INTRODUCTION
Precipitation is one of the most important meteorological elements, as it is the major atmospheric source of surface water, therefore it has a huge effect both on natural and cultivated vegetation. Extreme precipitation events – related to lack or excess of precipitation – may result in several environmental, economical, natural and even human health damages. They can induce floods, flash floods, landslides, traffic accidents, whereas drought can threaten food safety as well. For instance, the year 2012 was quite dry in Hungary with only 470 mm annual precipitation amount (Rajhonáné Nagy, 2013), which is about 83% of the climatic
1 Eötvös Loránd University, Deparment of Meteorology, 1117 Budapest, Hungary,
126
normal value. As a result, this dry year affected the agricultural production quite negatively, e.g., by 24% less cereal was harvested according to KSH (2013). In order to build appropriate adaptation strategies in time to reduce precipitation-related damages, it is essential to provide reliable projections and assessments of the future tendencies for various economical sections related to water resources.
2. DATA AND METHODS USED IN THE ANALYSIS
For analysing the past precipitation tendencies (1961–2010) the new, homogenized, high quality CarpatClim database (Szalai et al., 2013) was used. For investigating the future trends, precipitation outputs of 11 regional climate model (RCM) simulations from the ENSEMBLES project (van der Linden and Mitchell, 2009) with 25 km horizontal resolution were used. All the RCMs consider the intermediate A1B emission scenario (Nakicenovic and Swart, 2000), which estimates the global mean CO2 level exceeding 700 ppm by 2100. The necessary initial and boundary conditions for RCM experiments were provided by three different global climate models (GCMs).
Since precipitation is a highly variable climatic element, simulation of the complex climate system obviously includes biases. Pongrácz et al. (2011) showed that RCM simulations from the ENSEMBLES underestimate the measured summer precipitation in the Carpathian Region and overestimate the measurements in the rest of the year. In order to eliminate these systematic errors, before the calculations and the detailed analyses a percentile-based bias correction method was applied to the raw simulation outputs (Pongrácz et al., 2014). For each RCM, each month, and each gridcell the empirical distribution functions determined for the 1961–2010 time period were fit to the distribution of the reference of CarpatClim. After applying this bias correction method to the raw data, monthly precipitation sums and several precipitation-related climate indices (e.g., CDD, MDS, RR1, RR5, RR10, RR15, RR20, RR25, RR30, RR35, RR40, RR50, RX1, RX5, R90p, R95p, R99p, R90pGT, R95pGT, R99pGT) were calculated for the entire 1961–2100 period using all the 11 RCM simulations. Estimated values and the seasonal relative mean changes were also determined for two future time periods (2021–2050 and 2071–2100) relative to the 1971–2000 reference period for five subregions (SK, UA, HU, RO, SR).
3. RESULTS
127
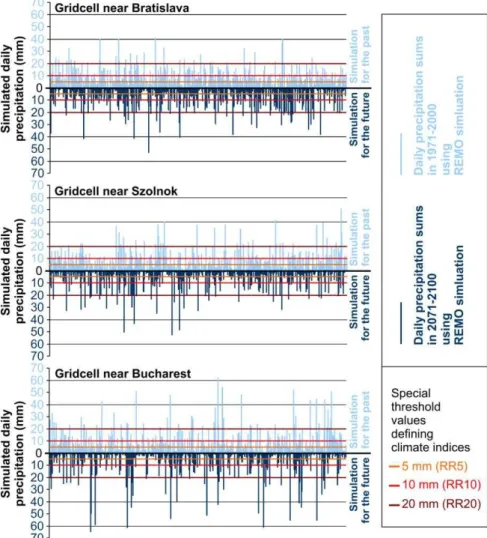
emphasized with individual horizontal colored lines indicating moderate (RR5), heavy (RR10), and very heavy (RR20) precipitation events.
Fig. 1. Summer precipitation daily totals for 1971–2000 and 2071–2100 from the bias-corrected REMO simulation for three selected gridcells. 5 mm, 10 mm, and 20 mm daily
precipitation thresholds are indicated by colored lines
128
for all the indices, the projected winter increasing trend is larger in the northwestern part than in the southeastern part of the Carpathian domain.
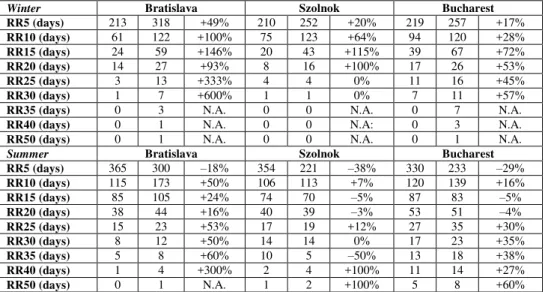
Table 1. The total number of days exceeding specific daily precipitation thresholds in winter and summer in three selected gridcells for 1971–2000 (left columns) and
for 2071–2100 (middle columns, projected relative change is indicated in the right columns) calculated from the bias-corrected outputs of REMO simulation
Winter Bratislava Szolnok Bucharest
RR5 (days) 213 318 +49% 210 252 +20% 219 257 +17%
RR10 (days) 61 122 +100% 75 123 +64% 94 120 +28%
RR15 (days) 24 59 +146% 20 43 +115% 39 67 +72%
RR20 (days) 14 27 +93% 8 16 +100% 17 26 +53%
RR25 (days) 3 13 +333% 4 4 0% 11 16 +45%
RR30 (days) 1 7 +600% 1 1 0% 7 11 +57%
RR35 (days) 0 3 N.A. 0 0 N.A. 0 7 N.A.
RR40 (days) 0 1 N.A. 0 0 N.A: 0 3 N.A.
RR50 (days) 0 1 N.A. 0 0 N.A. 0 1 N.A.
Summer Bratislava Szolnok Bucharest
RR5 (days) 365 300 –18% 354 221 –38% 330 233 –29%
RR10 (days) 115 173 +50% 106 113 +7% 120 139 +16%
RR15 (days) 85 105 +24% 74 70 –5% 87 83 –5%
RR20 (days) 38 44 +16% 40 39 –3% 53 51 –4%
RR25 (days) 15 23 +53% 17 19 +12% 27 35 +30%
RR30 (days) 8 12 +50% 14 14 0% 17 23 +35%
RR35 (days) 5 8 +60% 10 5 –50% 13 18 +38%
RR40 (days) 1 4 +300% 2 4 +100% 11 14 +27%
RR50 (days) 0 1 N.A. 1 2 +100% 5 8 +60%
In summer general decreasing and increasing trends are projected for RR5 and RR10, respectively. In case of RR15 and RR20, it is estimated to slightly decrease in the southern regions of the Carpathian domain (including the gridcells representing Szolnok and Bucharest), and it is projected to increase in the northern regions (e.g., the gridcell representing Bratislava). Overall, the frequency of large precipitation is likely to decrease in the future, however, more intense precipitation with extreme daily totals (i.e., exceeding 40 mm or even 50 mm) is also projected. Table 1 suggests that the more south the gridcell is located, the larger extreme values are estimated to occur. For instance, in the gridcell near Bucharest (at 44.375°N latitude) daily precipitation is more likely to exceed 50 mm or even 60 mm in the future, whereas near Bratislava (at 48.125°N latitude) the largest simulated daily value is around 50 mm (Fig. 1).
129
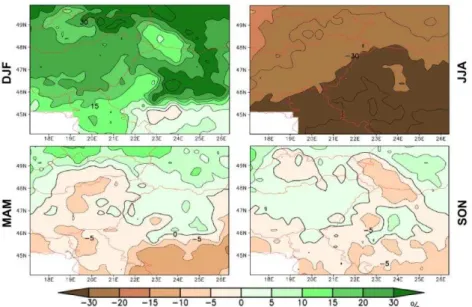
on average) and spring. In winter the number of precipitation days exceeding 5 mm is estimated to increase in the Carpathian region, mainly in the northeastern parts of the domain, where the mean relative change is projected to exceed 30%. In autumn and spring the estimated mean changes are not so remarkable as in the solstice seasons, however, an overall zonal structure can still be recognized.
Fig. 2. Composite maps of the relative seasonal mean changes of RR5 using 11 bias-corrected simulations for 2071–2100 (reference period: 1971–2000)
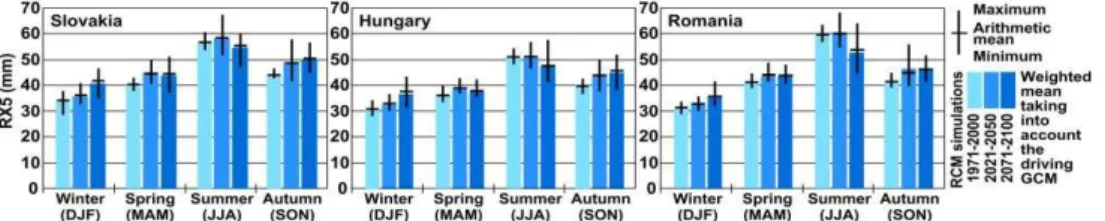
The highest five-day precipitation amount (RX5) can be considered one of the key causing factors of floods since it indicates both the length and the intensity of precipitation. Therefore, we selected this climate index for more detailed analysis to be presented in this paper. Fig. 3 summarizes the ranges of simulated values of RX5 spatially averaged for Slovakia, Hungary, and Romania, and temporally averaged for three 30-year long time slices (1971–2000, 2021–2050, 2071–2100). The thick color bars of the graphs indicate the GCM-weighted average values. Thin black bars represent the uncertainty of the multi-model estimations, and horizontal black lines show the arithmetic mean of the calculated seasonal mean RX5 values from daily precipitation outputs of all the 11 RCM simulations. In general, the projected changes by the mid-century tend to continue in the second half of the 21st century resulting in more pronounced changes by 2071–2100 than by 2021–2050. Increasing trend is estimated for all seasons, except summer when decrease of RX5 is more likely. This opposite seasonal trend in summer can be partially explained by the fact that summer precipitation is often connected to convective processes, which do not last as long as frontal precipitation, and therefore resulting in smaller RX5 values overall.
130
The average projected summer change is –4% and –8% in Slovakia and Hungary, respectively. These estimated changes imply that the more south the region is located, the larger the summer decrease of RX5.
Fig. 3. Estimated RX5 values using the bias-corrected outputs of 11 RCM simulations for 1971–2000, 2021–2050, and 2071–2100 in Slovakia, Hungary, and Romania
The largest relative average changes are estimated for winter: 20%, 18%, and 12% in Slovakia, Hungary, and Romania, respectively. For instance, in Slovakia RX5 is projected to reach 41 mm in 2071–2100, whereas it was only 34 mm in the reference period, 1971–2000. In autumn remarkable increasing trend is also likely to occur, the average estimated change in all the selected subregions is about 11%. For spring no significant change is projected.
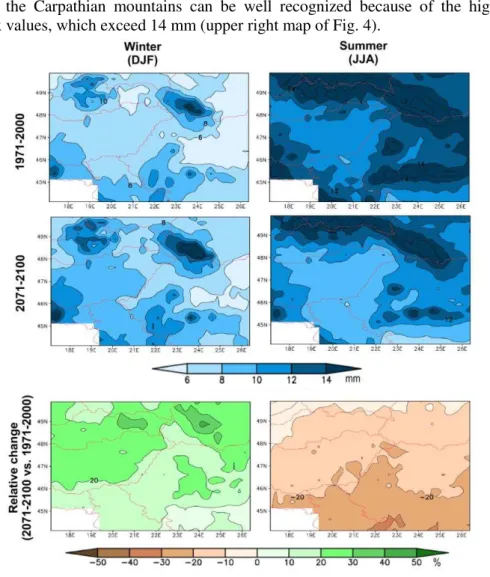
Extreme precipitation is often characterized by high percentile values of time series instead of the maximum values, which belongs to a single event rather than the entire distribution of possible precipitation events. That is why we selected one of the percentiles, i.e., the 95th percentile of daily precipitation for more detailed analysis to be presented in this paper. Similarly to other extreme indices, R95p is also estimated to increase in winter in the whole Carpathian domain, whereas in summer a general decreasing trend of R95p is projected for the future (lower maps in Fig. 4). In general, zonal patterns can be recognized in the spatial structures of the seasonal mean changes, larger increase/decrease is estimated by the late century in the north/south of the Carpathian domain than in the southern/northern regions.
In winter considerable increase (exceeding 20%) is likely to occur in the entire area of Hungary, in Slovakia, in Ukraine (within the analyzed domain), and in some parts of Romania (lower left map of Fig. 4). In the reference period the 95th percentile of daily precipitation was 6–8 mm on average, however, in the higher elevated, mountainous areas it exceeded 14 mm (upper left map o Fig. 4). At the end of the 21st century the spatial distribution is estimated to remain very similar to the past, although R95p values are estimated to increase by about 2 mm compared to the 1971–2000 reference period, and become 8–10 mm on average (middle left map of Fig. 4).
131
2000 the Carpathian mountains can be well recognized because of the highest index values, which exceed 14 mm (upper right map of Fig. 4).
Fig. 4. Composite maps of the simulated R95p values for winter (on the left) and summer (on the right) in 1971–2000 (upper panel) and 2071–2100 (middle panel). The estimated
seasonal mean changes of R95p for 2071–2100 (lower panel) are shown relative to the reference period, 1971–2000
132 4. CONCLUSIONS
Precipitation frequency and intensity were analyzed in this paper using daily precipitation outputs of 11 RCM simulations, and the CarpatClim database as a reference for the percentile-based bias correction, which was necessary to apply to the raw data in order to eliminate the systematic simulation errors. After the correction several precipitation-related indices were calculated for the entire 1961– 2100 time period for five subregions within the Carpathian domain. According to our results, a general drying tendency is estimated for summer, especially in the southern regions of the domain. Heavy precipitation days with more than 20 mm precipitation in summer are likely to decrease in frequency, however, more intense precipitation (even exceeding 50 mm) is projected to occur in the future. In winter and also in autumn both the frequency and intensity of precipitation is projected to increase, mainly in the northern parts of the Carpathian domain. These estimated changes clearly highlight the importance of developing appropriate adaptation strategies in this region, which can help to decrease the estimated effects of potential natural hazards related to either droughts or precipitation events.
Acknowledgements
The ENSEMBLES data used in this work was funded by the EU FP6 Integrated Project ENSEMBLES (Contract number 505539) whose support is gratefully acknowledged. Furthermore, we acknowledge the CARPATCLIM Database © European Commission - JRC, 2013. Research leading to this paper has been supported by the following sources: the Hungarian Scientific Research Fund under grants K-78125, K-83909, and K109109, the European Union and the European Social Fund through project FuturICT.hu (TÁMOP-4.2.2.C-11/1/KONV-2012-0013), and the AGRÁRKLIMA2 project (VKSZ_12-1-2013-0001).
REFERENCES
1. Bartholy, J., Pongrácz, R., Kis, A. (2015), Projected changes of extreme precipitation using multi-model approach.Időjárás (in press)
2. KSH (2013), Output of Hungary’s agriculture in 2012 (Economic accounts for
agriculture, 2012). Statistical Reflections, 48 (7), 5.
3. Nakicenovic, N., Swart, R. (2000), Emissions Scenarios. A special report of IPCC
Working Group III. Cambridge University Press, UK, 570p.
4. Pongrácz, R., Bartholy, J., Kis A. (2014), Estimation of future precipitation conditions for Hungary with special focus on dry periods.Időjárás, 118 (4), 305–321.
5. Pongrácz, R., Bartholy, J., Miklós, E. (2011), Analysis of projected climate change for Hungary using ENSEMBLES simulations. Appl. Ecol. Environ. Res. 9 (4), 387–398.
6. Rajhonáné Nagy, A. (2013), Weather of 2012. Légkör, 58, 35–39. (in Hungarian)
7. Szalai, S., Auer, I., Hiebl, J., Milkovich, et al. (2013), Climate of the Greater Carpathian Region. Final Technical Report. www.carpatclim-eu.org
8. van der Linden, P., Mitchell, J.F.B. (Eds.) (2009), ENSEMBLES: Climate Change and Its Impacts: Summary of research and results from the ENSEMBLES project.