UNIVERSIDADE FEDERAL DO RIO GRANDE DO NORTE CENTRO DE BIOCIÊNCIAS
PROGRAMA DE PÓS-GRADUAÇÃO EM ECOLOGIA – MESTRADO DEPARTAMENTO DE BOTÂNICA, ECOLOGIA E ZOOLOGIA
Natalia de Medeiros Pires
ECONOMY OF THE ISLAND OF ECO-TOURISM: THE ROLE OF SHARK-DIVING AND SHARK HARVESTING
NATALIA DE MEDEIROS PIRES
ECONOMY OF THE ISLAND OF ECO-TOURISM: THE ROLE OF SHARK-DIVING AND SHARK HARVESTING
Dissertação apresentada à Coordenação do Curso de Pós-graduação em Ecologia da Universidade Federal do Rio Grande do Norte, em cumprimento às exigências para obtenção do Grau de Mestre.
Orientadora: Prof.ª Dr.ª Adriana Rosa Carvalho
Co-orientador: Prof. Dr. Ricardo Clapis Garla
Catalogação da Publicação na Fonte. UFRN / Biblioteca Setorial do Centro de Biociências
Pires, Natalia de Medeiros.
Economy of the island of eco-tourism: the role of shark-diving and shark harvesting / Natalia de Medeiros Pires. – Natal, RN, 2015.
39 f.: il.
Orientadora: Profa. Dra. Adriana Rosa Carvalho. Coorientador: Prof. Dr. Ricardo Clapis Garla.
Dissertação (Mestrado) – Universidade Federal do Rio Grande do Norte. Centro de Biociências. Programa de Pós-Graduação em Ecologia.
1. Ecossistema. – Dissertação. 2. Conservação. – Dissertação. 3. Valor socioeconômico. – Dissertação. I. Carvalho, Adriana Rosa. II. Garla, Ricardo Clapis. III. Universidade Federal do Rio Grande do Norte. IV. Título.
Sumário
Lista de Figuras ... 4
Lista de Tabelas ... 5
Abstract. ... 7
Introduction ... 8
Methods ... 11
Study Area ... 11
Data collection ... 13
Economic estimates ... 14
Travel Cost Method ... 15
Social benefits from sharks... 16
Predictors of Expenditure ... 18
Results ... 19
Overview on tourists and diving activity in Noronha ... 19
Expenditures of tourists ... 20
Economic benefits generated to the island ... 23
Economic valuation by the travel cost method ... 23
Economic benefit transferred to the local economy ... 23
By the industry of tourism ... 23
By shark diving ... 24
Socio-economic benefits just from shark diving and shark harvesting ... 26
Predictors of expenditure ... 27
Discussion ... 29
Acknowledgments ... 32
References ... 33
4 Lista de Figuras
Figure 1.Location of the study area and boundaries of protected areas: the Environmental Protection Area (APA) defined by the isobath of 50 m deep and the Marine Protected Area (PARNAMAR). ... 12
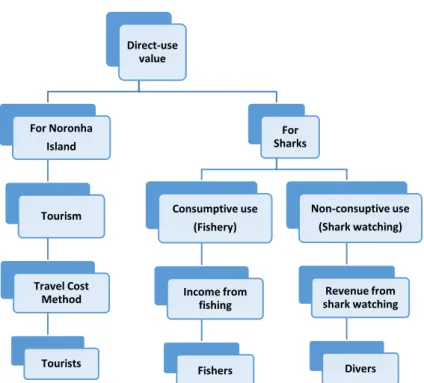
Figure 2. Description of the direct use values estimated, the type of use assessed and the method/information used to each target public interviewed... 14
Figure 3. Monthly flow of tourists (black line, N=189,775) and monthly number of scuba diving (grey line, N=73,653) conducted in Fernando de Noronha from 2011 to 2013. Source: ADEFN and ICMBio. ... 19
Figure 4. Mean daily individual expenditures and per trip (± Std. Error) by different categories of expenses incurred by tourists visiting Fernando de Noronha among 2011 and 2013. ... 21
Figure 5. Demand curve for visitation rate of tourists visiting Fernando de Noronha from 2011 to 2013. ... 23
Figure 6. Values for total revenues generated by the entire tourism activities. ... 24
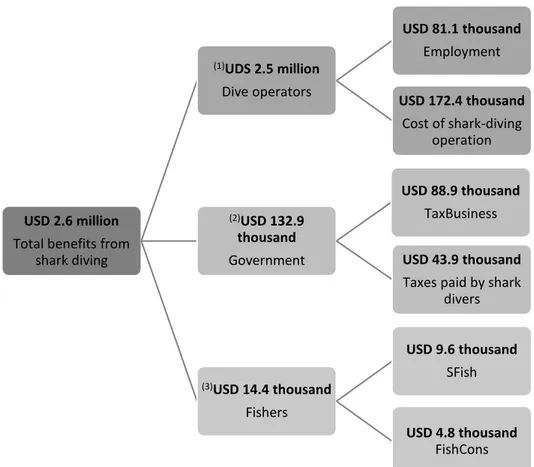
Figure 7. Total economic benefits generated by shark diving to (1) dive operators, (2) government and to (3) Fishers ... 25
5 Lista de Tabelas
Table 1. Economic sectors assessed to the estimates and the number of interviewees providing the information collected at each sampled sector. (Env. Mgt Autority = Environmental Management Authority). ... 13
Table 2. Zones defined according to political regions to estimate travel costs and description of each region/zone. ... 21
Table 3. Economic estimates by region based on information provided by visitants of Fernando de Noronha island (Vrate – visitation rate; CS – consumer surplus). ... 22
Table 4 Current and potential economic gains from shark diving in Noronha. ……….27
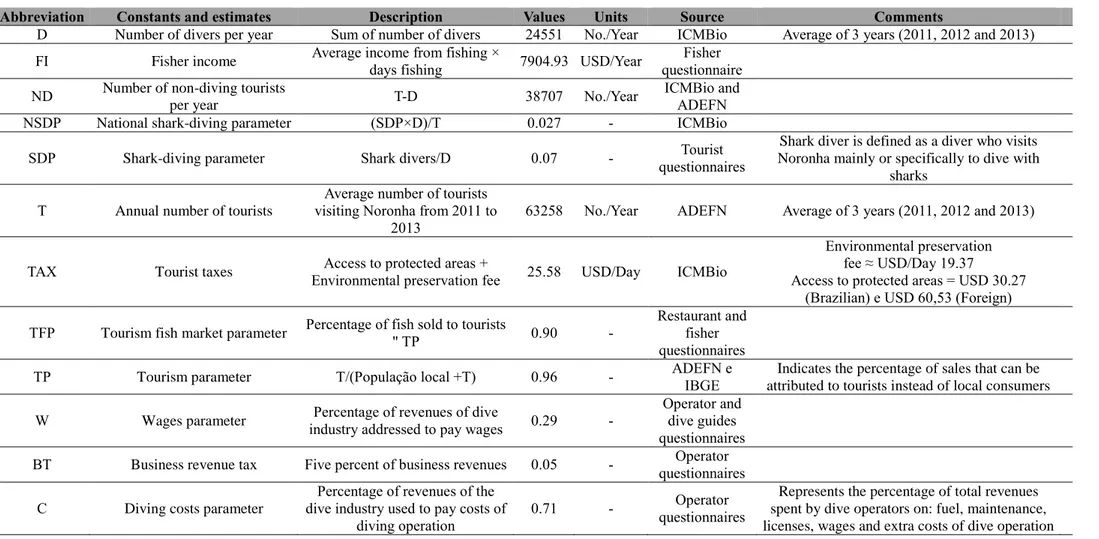
Table I. Description of variables and constants used to calculate parameters and estimates of economic benefits related to the tourism and shark-diving in Noronha. ... 37
6
7
Economy of the island of eco-tourism: the role of shark-diving and
shark harvesting
N. M. PiresA, A. R.CarvalhoB, R. C.GarlaC
A Post-graduation Program in Ecology at Universidade Federal do Rio Grande do Norte, RN - Brazil. E-mail:
nataliampires@hotmail.com
B Departament of Ecology at Universidade Federal do Rio Grande do Norte, RN - Brazil.
E-mail:acarvalho.ufrn@gmail.com
C E-mail: rgarla@hotmail.com
Abstract. Beyond its importance in maintaining ecosystems, sharks provide services that play important socioeconomic roles. The rise in their exploitation as a tourism resource in recent years has highlighted economic potential of non-destructive uses of sharks and the extent of economic losses associated to declines in their population. In this paper, we present estimates for use value of sharks in Fernando de Noronha Island - the only ecotouristic site offering shark diving experience in the Atlantic coast of South America. Through the Travel Cost Method we estimate the total touristic use value aggregated to Noronha Island by the travel cost was up to USD 91 million annually, of which USD 73.8 million are transferred to the local economy. Interviewing people from five economic sectors, we show shark-diving contribute with USD 2.6 million per year to Noronha’s economy. Shark-diving provides USD 81.1 thousand of income to employed islanders, USD 132.9 thousand to government in taxes and USD 4.8 thousand to fishers due to the increase in fish consumption demanded by shark divers. We discover, though, that fishers who actually are still involved in shark fishing earn more by catching sharks than selling other fish for consumption by shark divers. We conclude, however, that the non-consumptive use of sharks is most likely to benefit large number of people by generating and money flow if compared to the shark fishing, providing economic arguments to promote the conservation of these species.
8 Introduction
Shark populations perform important functions to human communities worldwide. From an ecological point of view, sharks hold indirect-use values providing services that play important socioeconomic role. The presence of apex predators such as sharks results in higher productivity and biomass in the marine ecosystem (Friedlander & DeMartini, 2002) since fish species targeted by sharks direct more energy to reproduction, increasing the abundance in the fish community (Sandin et al., 2010). Besides, the depletion of populations of sharks result in trophic cascades in marine ecosystems, given the increase in population of their prey, affecting the biomass of other organisms (Myers et al., 2007; Heithaus et al., 2008).
In a strictly economic view, sharks may represent a source of protein and products such as leather, cartilage, oil, and fins that are important for several communities in many countries (Camhi et al., 1998). In addition, during the last three decades the non-destructive use of shark populations as an economic activity has been under rapid development globally, providing higher incomes to an increasing number of people who rely on their exploitation as a tourism resource (Gallagher & Hammerschlag, 2011).
9 2006). A better understanding of the socio-demographics and travel-related variables which influence tourist expenditures has allowed travel markets to create effective and viable management strategies to anticipate possible scenarios.
On a local scale, the commercial value of sharks as tourism resources far exceeds their value as fishery products, given one dead shark provides income for a single fisher only once, whereas an individual shark alive produces a continuous income flow that benefits several economic sectors for many years (De la Cruz Modino et al., 2010). However, the first global assessment of the economic value of shark-diving put its value at around USD 314 million, while the revenue generated by shark fishing is estimated at USD 630 million (Cisneros-Montemayor et al., 2013). The large difference among estimates is likely due to the spatial range of the two activities, since fishing is an activity spread throughout the world, whereas the shark tourism is restricted to those sites where diving is currently well developed and sharks are present. Furthermore, there are no assessments of many sites where sharks are resident or migratory species and the development of shark watching as an economic activity is possible (Cisneros-Montemayor et al., 2013).
In fact, out of 260 sites proper to shark watching mentioned in "The Shark Watcher's Handbook" (Cawardine & Watterson, 2002), only 83 have shark ecotourism operations, with economic data on sharks as tourism resource available for only 31 (Gallagher & Hammerschlag, 2011). This shark-diving industry has been jeopardized by the decline of sharks caused worldwide due to a variety of human activities, but the absence of wide-ranging economic data on shark watching makes it unfeasible to predict the extent of economic losses associated to this decline.
10 the Asian market (Worm et al., 2013). Besides this, habitat degradation, pollution, climate change, and mislabeling of shark meat (Simpfendorfer et al., 2011; Bornatowski et al., 2014) are additional threats faced by shark populations globally. The low growth and reproductive rates, the late sexual maturity and limited offspring when compared to bony fishes (Camhi et. al., 1998) decreases their ability to respond to reductions in their populations (Musick et al., 2000) increasing the vulnerability of most shark species.
This is the scenario for the insular shelf surrounding the Fernando de Noronha Archipelago (Noronha), northeastern Brazil. Noronha is the only site with shark dive operations in the Atlantic Coast of South America and so far, the economic benefits generated by diving activities, including shark watching, were never assessed, hampering its inclusion in the global value of sharks estimated by Cisneros-Montemayor et al. (2013). The Caribbean reef Carcharhinus perezi, nurse Ginglymostom acirratum, and lemon Negaprion brevirostris are the most common sharks in the region. Occasionally tiger shark Galeocerdo cuvier and silk shark Carcharhinus falciformis can also be sighted. Shark fisheries were active in Noronha from 1992 to 1997 severely depleting shark populations according to local dive operators. Just Carcharhinus perezi comprised 60% of the total shark caught during the last 18 months of shark fishery operations in the island (Garla et al., 2006). Recreational and commercial fishers (Garla, 2004) report landings of small sharks (neonates and juveniles) and mislabeling also exists.
11 share of the use value of the island is due to shark tourism? (iii) which variables best predict expenditures of tourists visiting the island? (iiii) what is the potential economic contribution through non-destructive direct use of the three shark species that occur in the archipelago? We hope to supply valuable information on the economic benefits of non-destructive use of sharks and promote better understanding on this economic activity and on management and conservation actions that would support shark ecotourism worldwide.
Methods Study Area
12 Figure 1.Location of the study area and boundaries of protected areas: the Environmental Protection Area (APA) defined by the isobath of 50 m deep and the Marine Protected Area (PARNAMAR).
The Gross Domestic Product (GDP) is estimated at USD 13.3 million (IBGE, 2010) generated mainly by tourism activities developed by nearly 60 thousand visitants annually.
13 Data collection
To estimate the direct economic use value of the island and the direct economic use value of sharks, information was collected by interviewing people from five economic sectors (Table1).
Table 1. Economic sectors assessed and number of interviewees providing the information collected at each sampled sector. (Env. Mgt Authority = Environmental Management Authority).
Economic sector Date Number of
informants Information collected
Tourists Jul/2012,
Jan/2014 621
Demographic characteristics, motivations to visit the island, knowledge of the local shark occurrence, interest in shark diving, diving and other expenses while in Noronha.
Fishers Jan 2014 15 Production, fishing income, target species and interaction levels with sharks.
Restaurant owners Jan 2014 2
Annual income, number of employees and salary values, product sales associated with sharks, number of fishermen supplying shark meat; market volume and prices
Dive operators and
photo producers Jan 2014 6
Average annual gross income, company's operating costs, wages received by tourism professionals and taxes generated to the government.
Dive guides Jul, Aug
2012 20
Number of clients and tourist preferences, estimated income, main dive attractions, popular dive sites for shark diving, shark species commonly observed.
Env. Mgt Authority Jan 2014 Representative Authority Monthly number of scuba diving operations and number of visitants in the island from 2011 to 2013
14 were interviewed at the port when arriving from fishing trips. Owners of restaurants, shops, dive operators, dive guides and management authority were interviewed both during working hours and after work.
Figure 2. Description of the direct use values estimated, the type of use assessed and the method/information used to each target public interviewed.
Two Environmental Management Authorities were also contacted. The local office of the Brazilian Environmental Agency (ICMBIO) provided the number of tourists scuba-diving per month from 2011 to 2013. The Fernando de Noronha Administration (ADEFN) informed the total number of visitants for the same period.
Economic estimates
The economic value of the island aggregated by tourism activity was calculated through the Travel Cost Method (Hotelling, 1947). The method proposed by Vianna et al. (2012) was used to estimate the socioeconomic value generated by fishing, diving and
Direct-use value
For Noronha Island
Tourism
Travel Cost Method
Tourists
For Sharks
Consumptive use (Fishery)
Income from fishing
Fishers
Non-consuptive use (Shark watching)
Revenue from shark watching
15 shark watching activities. Only the proportion of tourists who declared shark watching as their main motivation to visit Noronha was used to assess socioeconomic benefits of sharks. All values were converted to US dollars according to the exchange rate on October 22nd 2014 (USD 1.00 = BRL 2.47).
Travel Cost Method
The Travel Cost Method proposed by Hotelling (1947) was used to determine the recreational value of a site based on the time and money spent to visit it (Pascual et al., 2010). The places of origin of tourists visiting Noronha were grouped into distance classes (zones), assuming that tourists of a given zone have similar trip costs. The method assumes that the farther the tourists reside, the lower is their visitation rate, because of an increase in the travel costs (Motta, 1998). Tourists who have purchased travel packages to Noronha that included other destinations were excluded from the sample to avoid a multiple-destinations bias.
This method also assumes that the displacement to a tourism location includes a cost related to the distance traveled (mobility cost) and the time spent during the trip (cost of time). The information about distances travelled was estimated using the Google Maps route tool (www.maps.google.com.br, accessed March 2014). To estimate the value of the time spent traveling, travel hours were multiplied by the value of each working-hour, considering the average income reported by respondents and assuming a 40-hour workweek.
A visitation rate was calculated for each zone, by the formula (TVi/1000) =
[(Vi/n)× N × 1000]/P where TVi/1000 = rate of visits per 1,000 people per year; Vi =
number of visitors from zone i; n = sample size; N = total number of visitors per year; and P = total population of zone i (IBGE, 2010).
16 which reflects the variation on the demand for an asset or service according to changes in its price. As the travel cost increases, the demand for visitation tends to decrease.
Finally, the consumer surplus (CS) that represents the difference between the willingness of tourists to pay and the price they actually pay for the trip was estimated using the formula:
Whose analytical solution is:
and EC = consumer surplus; Vi = number of visitors of the ith
population zone; Ti = current travel cost of the ith population; and Tm = maximum travel
cost.
In order to determine the economic benefit from tourism, the total estimated travel cost was obtained multiplying the sum of consumer surplus from each zone by the number of tourists received per year.
Social benefits from sharks
Social benefits from shark watching were determined through a market valuation technique using expenses of tourists interested in shark watching, the per capita income reverted to the community and the value of taxes paid by the diving activity (see also Vianna et al., 2012).
The information on variables, formulas and parameters used in this calculation model are detailed in the Appendix (Tables I and II). The number of divers and total of tourists visiting Noronha used in this estimate were calculated based on data from 2011-2013. The five main parameters required were:
Revenue from Shark-divers. This is based on the average expenses per trip of divers, the number of divers per year, and the proportion of divers interested in sharks (estimated from the questionnaires). It includes accommodation, food, diving and others costs,
Tm
Ti
VidT i)
(
EC
) (
)
(i Vi Tm Ti
17 such as souvenirs and tours while in Noronha. Air tickets are not included in this calculation, given there is little or no flow of those expenses to the local economy.
Indirect value of shark diving to fisher (FishCons) –. Represent the income produced to fishers by selling their catches to divers interested in sharks via a chain of commerce (restaurants, hotels, fish market). This value is estimated considering the average annual income of fishers, the proportion of fish sold to tourists, and the number of tourists interested in shark watching. The value is then compared to the profits provided by selling shark meat in Noronha.
Direct community income from shark diving (Employment). This parameter estimates the
economic benefit of salaries paid to employees in dive operators. It was calculated
using the average diver expenditure on dives, the share of the diving industry receipt
allocated to the payment of salaries, the proportion of tourists interested in shark
watching and the number of divers per year visiting Noronha.
Tax revenues from shark diving. Taxes paid by tourists interested in shark diving,
including the environmental preservation fee (compulsory for all tourists and charged
according to the amount of days spent in Noronha) and the payment of a permit to
access protected areas. The estimate also considers a revenue tax of 5% on most
expenditures made by shark divers paid by businesses to government.
Cost of shark-diving operation. This parameter estimates the general costs of dive
operators with fuel, equipment maintenance, licenses, wages and extras. The number
of divers per year and the proportion of divers interested in sharks are used for this.
Potential Scenarios
18 with sharks and the present economic context. From the current situation, the first scenario is built based on the percentage of tourists who declared having decided to dive due to the likelihood of shark watching while diving. The second scenario considers the percentage of tourists who are interested in seeing sharks in countries where such practice is widespread (as Australia and South Africa).
Predictors of Expenditure
Aiming to predict which features might determine the tourists willingness to spend money on the island, twelve variables were selected: (1)age, (2)sex, (3)income, (4)length of
stay, (5)distance from their origin to Noronha, (6)motivation to visit the island or to dive, (7)knowledge of destinations alternative to Noronha, (8)number of visits to Noronha, (9)diving activity, (10)interest in observing sharks, (11)knowledge of Noronha as shark
nursery area and (12)awareness that the island is the best place to spot sharks in Brazil.
Generalized additive models (GAMs) were used to relate expenditures to these different factors. GAMs are often used for their ability to deal with linear and non-monotonic relationships between the response variable and the explanatory variables (Hastie & Tibshirani 1986; Wood, 2006). GAM models were developed using the ‘mgcv’ package in R (Wood, 2013). We applied a gaussian distribution using the default thin plate regression splines as the smoothing function (Wood, 2003) and limiting of smoothing to 4 degrees of freedom for each spline to avoid overfitting (Forney, 2000).
Variable selection was performed with forward and backward stepwise selection of variables and all the possible interaction terms, based on Akaike Information Criterion (AIC), Un-Biased Risk Estimator (UBRE) and deviance explained. The principle of parsimony was applied to limit the number of interaction terms, i.e., any term was added if the benefit in performance was too small compared to the cost of increasing the model complexity.
19 minimum age for people be considered economically active. Analyses were done using free software R 3.1.1 (R Core Team, 2014).
Results
Overview on tourists and diving activity in Noronha
In average up to 63.258 tourists visited Noronha annually from 2011 to 2013. A minimum of 3500 tourists traveled to Noronha monthly even during the low visited months. During this period, the three companies for scuba diving operating in Noronha leaded in average 24551 dive activities. Even though Noronha present good conditions for diving all year round, frequency of dives were higher on October and November than on May-June, when the frequency of tourist visits was slightly lower (Figure 3).
Figure 3. Monthly flow of tourists (black line, N=189,775) and monthly number of scuba diving (grey line, N=73,653) conducted in Fernando de Noronha from 2011 to 2013. Source: ADEFN and ICMBio.
A survey of over 425 tourists interviewed in Noronha indicated that Brazilians from the southeast accounted for 50% of inbound visits to the island, mainly arriving from São Paulo (28%). Roughly the same proportion of male (48%) and female (52%) tourists aging around 35 years old (ranged from 6 to 69 yrs old) visited Noronha. Most interviewees were visiting the island for the first time (83%).
0 1000 2000 3000 4000 5000 6000 7000
Jan Feb Mar Apr May Jun Jul Aug Sep Oct Nov Dec
20 The motivations for the trip were sightseeing (66%), visiting the beaches (61%) or diving (46%). Over half the interviewees were aware of the role of the island as mating and nursery area for sharks but many (68%) were unaware of the potential of Noronha as the best shark viewing area in the country.
Interviewees indicated high interest (40%) or modest interest (28%) in watching sharks. This implies roughly 25,300 tourists interested in shark watching annually and 1,400 tourists per month moderately interested in shark watching. Few tourists showed slight interest in seeing sharks (11%) or were not interested on shark viewing (14%) while 7% of interviewees were unable to provide an answer on this issue.
However, following the first days in the island, 23% of tourists declared having decided to dive due to the likelihood of shark watching while diving. Additionally, throughout face-to-face interviews, 7% of tourists (from 196 respondents) declared shark-diving as their main motivation for visiting the island. Accordingly, all estimates of economic benefits produced by sharks were based on the abovementioned proportion of tourists interested in shark diving prior to visiting the island.
Expenditures of tourists
From an average monthly income of USD 4,341.00/person (≈ 15 minimum salaries in BRL currency), tourists spent an average of USD 246.80 on daily expenses. The mean expenses per trip were USD 1,349.45 for a mean length of stay around 5.5 days, even though mostly stays lasted for four days (Figure 4).
21 Figure 4. Mean daily individual expenditures and per trip (± Std. Error) by different categories of expenses incurred by tourists visiting Fernando de Noronha between 2011 and 2013.
Table 2. Zones defined according to federative units to estimate travel costs and description of each region/zone.
Zone Distance class (km) Number of tourists
Minutes of
trip
(Mean ± SE)
Frequency of visits
(Mean ± SE)
Total
population/zone
AL 742.53 5 110(±0) 1.2 (±0.032) 3300935
BA 1218.66 - 1944.66 12 300(±17) 1.8 (±0.14) 15044137
CE 810.92 5 125(±0) 1.0 (±0) 8778576
DF 2199.25 3 210(±0) 1.6 (±0.084) 2789761
ES 2025.33 5 280(±0) 1.0 (±0) 3839366
GO 2376.85 6 300(±0) 1.0 (±0) 6434048
MA 1751.16 - 2527.16 3 465(±28) 1.0 (±0) 6794301
MG 2185.34 - 2800.34 15 252(±12) 1.1 (±0.02) 20593356
MT 3000.03 2 355(±0) 1.0 (±0) 3182113
PB 662.03 3 167(±0) 1.0 (±0) 3914421
PE 542.03 - 1016.03 33 107(±8) 1.6 (±0.10) 9208550
PI 1478.17 2 165(±0) 1.0 (±0) 3184166
PR 3005.5 6 335(±0) 1.1 (±0.02) 10997465
680 ±28 357±14 172 ±10 140 ±9
0 500 1000 1500 2000 2500 3000 3500
Per Trip
Accommodation Feed Other Dive
123 ±4 64 ±2 33 ±2 26 ±1
0 100 200 300 400 500 600
Daily
22
RJ 2420.98 - 2607.98 24 239(±2) 1.4 (±0.09) 16369179
RN 377.27 8 70(±0) 1.0 (±0) 3373959
RS 3524.61 - 3568.01 5 387(±1) 1.0 (±0) 11164043
SC 3150.97 4 345(±0) 1.2 (±0.03) 6634254
SP 2675.5 - 3122.5 47 268(±4) 1.3 (±0.06) 43663669
Annual benefit provided by the island to all tourists is high (CS - consumer surplus = USD 1452.24/year) mainly in the southeastern states (SP, RJ and MG) (Table 3). Even though the Northeastern states (RN, AL, PE, CE, PB) are closer to Noronha Island, the state of São Paulo (SP) had the highest visitation rate and higher consumer surplus (Table 3) but also the higher travel cost (Figure 5).
Table 3. Economic estimates by region based on information provided by visitants of Fernando de Noronha island (Vrate – visitation rate; CS – consumer surplus).
Zone Travel cost (± SE)(USD) Time cost (± SE) (USD) Vrate/1000 CSurplus
AL 624.62 (± 4) 49.60 (± 1) 0.001 7.65
BA 1505.67 (± 114) 298.62 (± 24) 0.01 66.80
CE 698.79 (± 10) 50.28 (± 2) 0.003 20.12
DF 1390.00 (± 37) 144.53 (± 2) 0.0007 3.28
ES 809.72 (± 11) 121.01 (± 2) 0.001 8.50
GO 1273.16 (± 9) 131.21 (± 4) 0.003 15.55
MA 885.95 (± 25) 206.84 (± 23) 0.001 8.74
MG 1047.09 (± 29) 148.54 (± 11) 0.02 129.96
MT 839.07 (± 0) 89.80 (± 0) 0.0005 2.82
PB 800.93 (± 4) 38.34 (± 1) 0.0009 5.30
PE 630.81 (± 15) 28.22 (± 3) 0.02 141.30
PI 1037.25 (± 0) 41.75 (± 0) 0.0005 2.74
PR 1208.38 (± 28) 98.50 (± 14) 0.005 27.13
RJ 1074.13 (± 32) 127.85 (± 15) 0.03 164.78
RN 545.26 (± 23) 18.99 (± 2) 0.002 12.79
RS 1238.06 (± 40) 124.45 (± 11) 0.004 22.67
SC 1691.30 (± 18) 349.88 (± 63) 0.002 9.27
SP 1430.32 (± 60) 111.82 (± 14) 0.17 802.83
23 hindering the graphical analysis.
Figure 5. Demand curve for visitation rate of tourists visiting Fernando de Noronha from 2011 to 2013.
Economic benefits generated to the island
Economic valuation by the travel cost method
The total touristic use value of Noronha Island according to the travel cost method was up to USD 91 million. This value represents the total expenses incurred by every tourist visiting Noronha and is assumed as the willingness of tourists to pay for the island. However, part of these costs represents expenses assumed before coming to the island (for instance by purchasing flight tickets). Hence, estimates in the next section represent the amount of money effectively transferred by tourism and tourists to the local economy.
Economic benefit transferred to the local economy
By the industry of tourism
24 annually by tourists to the Park Authority (tax of admission into the park area and the tax for environmental preservation of the island). The remaining amount (USD 72.2 million) indicates the sum received annually by all commercial shops providing any service related to the touristic activities.
Figure 6. Values for total revenues for the entire tourism activities. Values presented are the revenues from tourist expenses excluding taxes (left) and the revenue from taxes paid by tourists (right). Both are further divided into divers, non-divers and shark-divers tourists.
The revenue from these touristic services are roughly half due to activities performed by non-divers tourists (49.6%) and half (50.4%) due to activities developed by the 24 thousand diving tourists visiting the island annually (Figure 6).
By shark diving
Based on the 7% of interviewed tourists interested in shark diving, it was possible to assume that close to 4,400 tourists arrive in Noronha annually aiming to shark dive. This indicates an economic benefit generated to Noronha by shark diving of roughly USD
USD 73.8 million
Total revenues from tourism
USD 72.2 million
Revenues from Tourism activities
USD 36.4 million
Revenue from Divers
USD 2.5 million
Revenue form Shark divers
USD 35.8 million
Revenue from Non-divers
USD 1.6 million
Revenues from taxes
USD 628.1 thousand
Taxes paid by divers
USD 43.9 thousand
Taxes paid by shark divers
USD 990.3 thousand
Taxes paid by
-25 2.5 million annually.
Figure 7. Total economic benefits from shark diving to (1) dive operators, (2) government and to (3) Fishers. Employment = Total annual salaries paid to employed islanders by dive operators; Cost of shark-diving operation =Economic benefit generated from the total paid by shark divers as costs for shark diving operation; TaxBusiness = portion of total benefits to government coming just from taxes paid by business like shops, hotels, restaurants and dive operators; Taxto access park area = Portion of total governmental benefits coming from taxes paid daily by shark divers for park conservation and to have access to the park area; SFish = Economic benefits to fishers due to shark fishing; FishCons = Economic benefits to fishers due to the increase in fish consumption demanded by shark divers.
However, shark diving provides income and revenue to all sectors involved in tourism, including islanders employed by dive operators and fishers. If all those sectors that benefit from shark diving are taken into account, the total revenue produced by shark diving in the island reaches up to USD 2.6 million (Figure 7), of which 94.43% is passed to dive operators, 5.02% to government and 0.55% to fishers.
USD 2.6 million
Total benefits from shark diving
(1)UDS 2.5 million
Dive operators
USD 81.1 thousand
Employment
USD 172.4 thousand
Cost of shark-diving operation
(2)USD 132.9
thousand
Government USD 43.9 thousand
Taxes paid by shark divers USD 88.9 thousand
TaxBusiness
(3)USD 14.4 thousand
Fishers
USD 9.6 thousand
SFish
26 Socio-economic benefits just from shark diving and shark harvesting
Shark diving generated a total of USD 132.9 thousand in taxes. This corresponded to USD 43,973.00/year in taxes paid by shark divers to the Park Authority and around USD 88.9 thousand paid to the government in the form of taxes upon the revenue of dive operators and other shops providing services to shark divers.
Shark diving activity also supplied a total of USD 81,147.00 annually in payments to islanders employed by dive operators.
The interest on sharks also indirectly benefited fishers by increasing the demand for bony fishes in restaurants. This benefit may reach up the conservative estimate of USD 195.00 annually per fisher if considering just the 7% of tourists mainly motivated by shark watching to visit the island. This may sum over USD4,875.00 of annual benefit to all 25 fishers exploiting fishery resources in the island. Considering just half of the 40% of tourists that declared high interest in shark viewing, this value rises to USD 557.14/year per fisher, to a total of USD 13,928.50 for these 25 fishers. The revenue from the destructive use of sharks through incidental fishery and by selling sharks to local restaurants indicated an individual income of USD 968.00 for 10 fishers who are still involved in shark fishing. This value may come to a total of over USD 9,684.00 annually to those fishers.
Potential Scenarios
27 Table 4: Current and potential economic gains from shark diving in Noronha
Scenario Total BenefitsFrom Shark Diving (USD)
Dive operators
(USD) Government (USD) FishCons (USD)
Atual (7%) 2.6 million 2.5 million thousand132.9 thousand4.8
20% 7.8 million 7.4 million thousand379.7 thousand13.7
40% 15 million 14.2 million thousand759.4 thousand27.4
Predictors of expenditure
The final model explained 41.5% of total variance and underlined income (p = 0.001), length of stay (p = 0.008) and distance (p = 0.01) as the predictors for daily expenses. Expenses were higher among tourists with higher incomes. Expenses became even higher among tourists earning more than USD 8000.00 monthly.
28 Figure 8. Estimated contribution of distance (a), income (b) and days of stay (c) to the daily expenses. The dotted curves are the 95% confidence limit. Each vertical bar at the base of the graph denotes an observation with that value.
(a)
(c)
) (a) (b)
29 Discussion
Interest in shark-diving has been raised world-wide promoting an increase in the number of visitors at shark watching sites of almost 30% during the last 20 years
(Gallagher and Hammerschlag, 2011; Cisneros-Montemayor et al., 2013). In all sites offering shark-watching opportunities, diving has supplied millions of dollars to local and regional economies (Clua et al., 2011). Yet, global estimates on economic contribution of shark watching operations are highly unclear, since the economic benefits of shark watching remain unknown for many sites (Cisneros-Montemayor et al., 2013).
In this paper we present an estimate of use value for Fernando de Noronha Island and for the shark watching activity developed in the island. Results shown that even though shark-diving industry is not present in the island, 2.8% of the island’s use value is due to the direct and non-consumptive use of sharks for shark watching. Considering that turtles, coral reef fish and dolphins account for the main interest in marine wildlife observation (Techera and Klein, 2013) and that activities of local diving operators are not led by shark watching, the value achieved by sharks indicates the important role of shark species as a tourism asset at Noronha.
The economic social benefits of shark watching in Noronha (2.6 million annually) are relevant mainly if compared to the value achieved by shark-diving industries established for years at the main shark watching sites such as in South Africa (≈1.8 million annually; Dicken and Hosking, 2009), French Polinesia (≈5,4 million annually) or in Palau, Western Australia (≈1.9 million; Vianna et al., 2012). However, it must be noted that other aspects besides the presence of sharks on the island are taken into account by shark divers in their choice of travel destination, making it possible that this value can overlap with other resources and environmental attractions present on the island.
30 lack of information on this activity in Noronha does not allow us to confirm if the interest on shark watching has been raised in the island. Indeed, recent analysis of shark diving operations around the world did not include Noronha as a promising area for shark watching, mainly because of this lack of information on the economic and tourism potential of the island as shark spot. (Gallagher & Hammerchalag, 2011).
The entire touristic sectors benefit more from shark watching than from shark fishing, though not the fishers, as hypothesized in the paper. However this is not essentially due to market values or demand for shark since in Noronha shark finning never existed and the demand for shark meat is limited (just three restaurants have shark meat as menu option). This unbalanced distribution of earnings is most frequently caused by local people lacking the necessary qualifications to supply the services required by the tourism industry (Viana et al., 2012). This scenario weakens the awareness of fishers about shark conservation once they may feel they do not benefit from ecotourism.
Currently, participation in shark watching and in the benefits produced by the activity underlines awareness and support for conservation (Garrod & Wilson, 2003).
There is also evidence in the literature that fishers may increase their earnings by supporting the shark-diving industry (for instance by supplying fish to restaurants) rather than competing with this industry for the same resource by exploiting sharks (Vianna et al., 2012). As a rule, economic estimates on shark watching and on shark diving aim to underscore the higher value of live sharks over dead sharks for the local economy, including for fishers if they are properly engaged in the tourism activities, either directly or indirectly (Clua et al., 2011).
31 here implying lower benefits to fishers, diving operators mobilized from 2011 to 2013 USD 81 thousand annually in salary payments. Part of these payments is directed to the acquisition of material assets and several services in the island. (e.g. as maintenance, feeding), distributing the economic benefit throughout the island. Therefore, the non-consumptive use of sharks is most likely to benefit a larger number of people by generating more flow of money if compared to the shark fishing.
A pleasing level of diving experience compels divers to return to specific destinations if they can be assured in meeting the marine wildlife they seek (Jones et al., 2009) and guarantees the continuation of social benefits generated by shark watching. Besides, divers are often willing to pay more for natural assets they are interested in watching (Dearden et al., 2006). Specifically in Noronha the mean expenses of divers (USD 1,483.24/trip) exceeds expenses of non-divers (USD 925.46/trip) and the mean income of divers is higher than the mean income of non-divers underscoring the role of income as a predictor of expenditures incurred by tourists. Additionally, the willingness to pay for diving experiences is likely to be the same for shark divers and divers as a whole, since their mean income is roughly the same (USD 4,492.00 x USD 4,446.15). Furthermore, given that reef sharks can display high levels of site fidelity (Garla et al., 2006) so will be the divers visiting this site and spending money on their nature-based activities.
32 watching keep from visiting Noronha due to the depletion in shark population. Considering the percentage of tourists declaring having decided to dive due to the likelihood of shark watching and the number of interviewees that indicated high interest (40%) in watching sharks, the potential scenarios are plausible and show the economic loss that an untapped resource environmental can cause. From an economic point of view, this is an important issue to be taken into account when discussing conservation strategies in the island.
The values presented here referred only to use value of the island and use value (by ecotourism) of sharks. However, other nature-based assets are important to provide income to different sectors of the local economy. Furthermore, the economic benefit of shark watching activity to Noronha is likely underestimated since wages and salaries were quantified just for jobs in diving operators, not for jobs created in different sectors of the tourism industry such as hotels, restaurants and souvenir shops. However, as the value of the island or any of its environmental products was never assessed before, these findings are valuable for future decision making on economics and conservation in the island. If the island were established as shark watching site in the future the number of visits to shark watching would likely increase, improving the participation of local people in the activity and in its profits. As a result, direct and indirect values of sharks would increase contributing to the understanding of the value of sharks alive to the local economies.
Acknowledgments
33 P. F. M., Angelini, R., Guariento, R. D and Penna, N.R. for important comments on early versions of this manuscript.
References
Bornatowski, H., Braga, R. R., & Vitule, J. R. S. (2014). Threats to sharks in a developing country: The need for effective simple conservation measures. Natureza & Conservação,12(1), 11-18.
Brasil. 2004. Plano de manejo da APA de Fernando de Noronha – Rocas – São Pedro e São Paulo. MMA/IBAMA/ARCADIS TETRAPLAN S.A. 1206p. Disponível em: http://www.icmbio.gov.br/portal/biodiversidade/unidades-de-conservacao/biomas-brasileiros/mar inho/unidades-de-conservacao-marinho/2242-apa-de-fernando-de-noronha.html (Acesso em setembro de 2013).
Camhi, M. (1998).Sharks and their relatives: ecology and conservation(No. 20). IUCN.
Cagua, E. F., Collins, N., Hancock, J., & Rees, R. (2014). Whale shark economics: a valuation of wildlife tourism in South Ari Atoll, Maldives.PeerJ,2, e515.
Catlin, J., Jones, T., Norman, B., & Wood, D. (2010). Consolidation in a wildlife tourism industry: the changing impact of whale shark tourist expenditure in the Ningaloo coast region.International Journal of Tourism Research,12(2), 134-148.
Carwardine, M., & Watterson, K. (2002). The Shark Watcher's Handbook: A
Guide to Sharks and where to See Them. BBC Worldwide.
Cisneros-Montemayor, A. M., Barnes-Mauthe, M., Al-Abdulrazzak, D., Navarro-Holm, E., & Sumaila, U. R. (2013). Global economic value of shark ecotourism: implications for conservation.Oryx,47(03), 381-388.
Cline, W. (2008). Shark diving overview for the islands of the Bahamas.Economic report prepared for the Bahamas Dive Association and the Ministry of Tourism. p,36.
Clua, E., Buray, N., Legendre, P., Mourier, J., & Planes, S. (2011). Business partner or simple catch? The economic value of the sicklefin lemon shark in French Polynesia.Marine and Freshwater Research,62(6), 764-770.
De la Cruz Modino, R., Esteban, A., Crilly, R., & Pascual-Fernández, J. (2010). Bucear con tiburones y rayas en España. Análisis de su potencial en España y de los beneficios económicos de la actividad en las Islas Canarias. Instituto Universitario de Ciencias Políticas y Sociales de la Universidad de La laguna y nef.
Dearden, P., Bennett, M., & Rollins, R. (2006). Implications for coral reef conservation of diver specialization.Environmental Conservation,33(04), 353-363.
34
Dicken, M. L., & Hosking, S. G. (2009). Socio-economic aspects of the tiger shark diving industry within the Aliwal Shoal Marine Protected Area, South Africa. African Journal of Marine Science, 31(2), 227-232.
Forney, K. A. (2000). Environmental models of cetacean abundance: reducing uncertainty in population trends.Conservation Biology,14(5), 1271-1286.
Friedlander, A. M., & DeMartini, E. E. (2002). Contrasts in density, size, and biomass of reef fishes between the northwestern and the main Hawaiian islands: the effects of fishing down apex predators.Marine Ecology Progress Series,230(253), e264.
Gallagher, A. J., & Hammerschlag, N. (2011). Global shark currency: the distribution, frequency, and economic value of shark ecotourism. Current Issues in Tourism,14(8), 797-812.
Garla, R. C., Garcia, J., Veras, L. B., & Lopes, N. P. (2009). Fernando de Noronha as an insular nursery area for lemon sharks, Negaprion brevirostris, and nurse sharks, Ginglymostoma cirratum, in the equatorial western Atlantic Ocean. Marine Biodiversity Records,2, e109.
Garla, R. C. (2004). Ecologia e conservação dos tubarões do arquipélago de Fernando de Noronha, com ênfase no tubarão-cabeça-de-cesto Carcharhinus perezi
(Poey, 1876) (Carcharhiniformes, Carcharhinidae). Tese de doutorado, Unesp, Rio Claro, 170p.
Garla, R. C., Chapman, D. D., Wetherbee, B. M., & Shivji, M. (2006). Movement patterns of young Caribbean reef sharks, Carcharhinus perezi, at Fernando de Noronha Archipelago, Brazil: the potential of marine protected areas for conservation of a nursery ground.Marine Biology,149(2), 189-199.
Garrod, B., & Wilson, J. C. (Eds.). (2003).Marine ecotourism: issues and experiences. Channel View Publications.
Google Maps. Disponível em: http://www.maps.google.com.br (acesso em março de 2014).
Hastie, T., & Tibshirani, R. (1986). Generalized additive models. Statistical science, 297-310.
Heithaus, M. R., Frid, A., Wirsing, A. J., & Worm, B. (2008). Predicting ecological consequences of marine top predator declines. Trends in Ecology & Evolution,23(4), 202-210.
Hotelling H. 1947. Letter to the National Park Service. In. Reprinted in An Economic Study of the Monetary Evaluation of Recreation in the National Parks (1949). US Department of the Interior, National Park Service and Recreational Planning Division, Washington, DC.
IBGE. Censo 2010. Instituto Brasileiro de Geografia e Estatística. Ministério do
planejamento, orçamento e gestão. Disponível em
http://www.ibge.gov.br/cidadesat/index.php (Acesso em setembro de 2013).
35 ICMBIO, unpublished. Instituto Chico Mendes de Conservação da Biodiversidade. Dados fornecidos em janeiro de 2014.
Jones, T., Wood, D., Catlin, J., & Norman, B. (2009). Expenditure and ecotourism: predictors of expenditure for whale shark tour participants. Journal of Ecotourism,8(1), 32-50.
da MOTTA, R. S. (1998). Manual para valoração econômica de recursos
ambientais. IPEA/MMA/PNUD/CNPq.
Musick, J. A., Burgess, G., Cailliet, G., Camhi, M., & Fordham, S. (2000). Management of sharks and their relatives (Elasmobranchii).Fisheries,25(3), 9-13.
Myers, R. A., Baum, J. K., Shepherd, T. D., Powers, S. P., & Peterson, C. H. (2007). Cascading effects of the loss of apex predatory sharks from a coastal ocean.
Science,315(5820), 1846-1850.
Pascual, U., Muradian, R., Brander, L., Gómez-Baggethun, E., Martín-López, B., Verma, M., Verman, M., Armsworth,P., Christie, M., Cornelissen, H., Eppink, F. ... & Turner, R. K. 2010. The economics of valuing ecosystem services and biodiversity. In: Kumar, P. (ed.) The Economics of Ecosystems and Biodiversity – Ecological and Economic Foundations, Chapter 5. Earthscan, London, pp 183-256
R Core Team. 2014. R: A language and environment for statistical computing. R Foundation for Statistical Computing, Vienna, Austria. Disponível em: http://www.R-project.org/.
Sandin, S. A., Walsh, S. M., & Jackson, J. B. (2010). Prey release, trophic cascades, and phase shifts in tropical nearshore ecosystems. Trophic Cascades: Predators, Prey, and the Changing Dynamics of Nature, 71-90.
Simpfendorfer, C. A., Heupel, M. R., White, W. T., & Dulvy, N. K. (2011). The importance of research and public opinion to conservation management of sharks and rays: a synthesis. Marine and Freshwater Research,62(6), 518-527.
Stoeckl, N., Birtles, A., Farr, M., Mangott, A., Curnock, M., & Valentine, P. (2010). Live-aboard dive boats in the Great Barrier Reef: regional economic impact and the relative values of their target marine species.Tourism Economics,16(4), 995-1018.
Techera, E. J., & Klein, N. (2013). The role of law in shark-based eco-tourism: lessons from Australia.Marine Policy,39, 21-28.
Vianna, G. M. S., Meekan, M. G., Pannell, D. J., Marsh, S. P., & Meeuwig, J. J. (2012). Socio-economic value and community benefits from shark-diving tourism in Palau: a sustainable use of reef shark populations. Biological Conservation,145(1), 267-277.
Vianna, G. M. S., Meekan, M. G., Pannell, D., Marsh, S., & Meeuwig, J. J. (2010). WANTED DEAD OR ALIVE? The relative value of reef sharks as a fishery and an ecotourism asset in Palau. Australian Institute of Marine Science and University of Western Australia, Perth, Australia.
36
Wood, S. (2006). Generalized additive models: an introduction with R. CRC press.
Wood, S. N. (2013). mgcv R package.
Appendix
Table I. Description of variables and constants used to calculate parameters and estimates of economic benefits related to the tourism and shark-diving in Noronha.
Abbreviation Constants and estimates Description Values Units Source Comments
D Number of divers per year Sum of number of divers 24551 No./Year ICMBio Average of 3 years (2011, 2012 and 2013) FI Fisher income Average income from fishing ×
days fishing 7904.93 USD/Year questionnaireFisher
ND Number of non-diving tourists per year T-D 38707 No./Year ICMBio and ADEFN
NSDP National shark-diving parameter (SDP×D)/T 0.027 - ICMBio
SDP Shark-diving parameter Shark divers/D 0.07 - Tourist
questionnaires
Shark diver is defined as a diver who visits Noronha mainly or specifically to dive with
sharks
T Annual number of tourists
Average number of tourists visiting Noronha from 2011 to
2013 63258 No./Year ADEFN Average of 3 years (2011, 2012 and 2013)
TAX Tourist taxes Environmental preservation feeAccess to protected areas + 25.58 USD/Day ICMBio
Environmental preservation fee ≈ USD/Day 19.37
Access to protected areas = USD 30.27 (Brazilian) e USD 60,53 (Foreign)
TFP Tourism fish market parameter Percentage of fish sold to tourists
" TP 0.90
-Restaurant and fisher questionnaires
TP Tourism parameter T/(População local +T) 0.96 - ADEFN e IBGE Indicates the percentage of sales that can be attributed to tourists instead of local consumers
W Wages parameter Percentage of revenues of dive
industry addressed to pay wages 0.29
-Operator and dive guides questionnaires BT Business revenue tax Five percent of business revenues 0.05 - Operator
questionnaires
C Diving costs parameter
Percentage of revenues of the dive industry used to pay costs of
diving operation 0.71
-Operator questionnaires
38 Table II. Description of formulas and sources of data used to calculate parameters and estimates of economic benefits related to the tourism and shark-diving in Noronha.
Abbreviation Variables Formula Values Units Source Comments
Business revenues from tourism
BRD Business revenues from divers D×DET 36.4 million USD/Year
BRND Business revenues from non-divers ND×NDE 35.8 million USD/Year BRS Business revenues from shark divers BRD×SDP 2.5 million USD/Year
BRT Business revenues from tourism
activities BRD+BRND 72.2 million USD/Year
Economic benefits from shark diving
DCIDI Direct community income from dive
industry D×DED×W 1.15 million USD/Year
Operator questionnaires
Represents the expenditure of dive industry on wages
Employment Direct community income from shark
diving DCIDI×SDP 81.1 thousand USD/Year
Operator questionnaires
Expenditure of the shark-diving industry on salaries
FishCons Indirect value of shark diving to fisher FI×TFP×NSDP 195.00 USD/Year Fisher questionnaire
CSDO Cost of shark-diving operation Diving
expenses×D×C×SDP 172 thousand USD/Year
Operator questionnaires
Represents the expenditure of shark diving operations on: fuel, maintenance, licenses, wages and extra costs of dive operation
Tax revenues from shark diving
DTSD Taxes paid by shark divers SDP×D×TAX 43,9 thousand USD/Year
TaxBusiness Business revenue tax from shark diving
(SDP×D×BT× Diving expenses)+ (NSDP*T*Accomodation expenses) +(NSDP×T×BT×Other expenses)
88.9 thousand USD/Year BRTSD is the sum of revenue taxes from shark divers from diving and other expenses
TTRSD Total tax revenues from shark diving DTSD+BRTSD 132.9
thousand USD/Year
Total revenues
TRD Total revenues from divers D×TDET 37.0 million USD/Year
TRND Total revenues from non-divers ND×TNDE 36.8 million USD/Year
39
TRT Total revenues from tourism TRD+TRND 73.8 million USD/Year
Expenditures
DDE Daily diver expenditure DET/Length of stay 264.50 USD/Day Tourist questionnaires
DED Diver expenditure on dives Sum of diving expenses/
Respondents 162.81 USD/Trip
Tourist questionnaires
Average expenditure of a diver on dives per trip
DNDE Daily non-diver expenditure NDE/ Length of stay 191.46 USD/Day Tourist questionnaires
NDE Non-diver expenditure per trip Accommodation expenses
+ Extra expenses + Tours 925.46 USD/Trip
Tourist questionnaires
Average of the total expenditures in the specified categories by non-divers. ‘‘Extra’’
includes extras expenses during the trip not specified in the other categories (i.e.
souvenirs, landbased tours, etc) TNDE Total non-diver expenditure per trip NDE+TAX 951.04 USD/Trip
DET Diver expenditure per trip
Accommodation expenses + Diving expenses + Extra
expenses
1483.24 USD/Trip Tourist questionnaires
Average of the total expenditures in the specified categories by divers. ‘‘Extra’’ includes extras expenses during the trip not specified in the other categories (i.e.
souvenirs, landbased tours, etc)